HAL Id: halshs-00772617
https://halshs.archives-ouvertes.fr/halshs-00772617
Submitted on 31 Dec 2019HAL is a multi-disciplinary open access archive for the deposit and dissemination of sci-entific research documents, whether they are pub-lished or not. The documents may come from teaching and research institutions in France or abroad, or from public or private research centers.
L’archive ouverte pluridisciplinaire HAL, est destinée au dépôt et à la diffusion de documents scientifiques de niveau recherche, publiés ou non, émanant des établissements d’enseignement et de recherche français ou étrangers, des laboratoires publics ou privés.
How to adapt a tactical board wargame for marketing
strategy identification
Stéphane Goria
To cite this version:
Stéphane Goria. How to adapt a tactical board wargame for marketing strategy identification. Journal of Intelligence Studies in Business, 2013, 2 (3), pp.12-28. �halshs-00772617�
How to adapt of a tactical board wargame
for marketing strategy identification
Stéphane GORIA
CREM – University of Lorraine – France
[email protected]
1 Introduction
In order to be competitive or simply to survive, companies have to choose de-velopment strategies. Innovation is a common solution for many of them (Trot 2008, 77-78) (Lundvall 2010, 328). But innovating is always risked, because one can’t know if strategic orientation of innovation will be good before the new product or service will be on market. Another approach concerns quality meth-ods which propose often some solutions to perform company process (Weaver 1991) (Pyzdek and Keller 2003). But, those take a long time for implementation and need an important organizational involvement. In addition, they work in a homogeneous way and consequently their impact is homogenous too and easily predictable. Another choice is proposed by marketing warfare (Kotler and Singh 2001). With that approach: war analogy, their authors propose to elaborate company strategic planning, according to war laws and the position of the com-pany on its markets. But till now, marketing warfare is reduced to abstract anal-ogies and it is not easy for the most part of people to envisage a company strat-egy with only abstractions. A partial response to this seems to be proposed by a business wargame approach. From war and battle models for military strategies development, some people tried to fit them to markets (Herman et al. 2009)
(Gilad 2009). This approach gives some keys to simulate a competitive environ-ment and it’s its first interest for competitive intelligence (Kurtz and Schuller 2008) and economic intelligence (Besson et al. 2010). Nowadays it is considered as a marketing intelligence analysis tool (Jenster and Søilen 2009, 165), for a warning system (Gilad 2003, 93) or an accelerator for the decision-making pro-cess with capacity to anticipate future (Fuld 2003) (Cares and Miskel 2007). However, in our opinion it has a drawback: it doesn’t propose, as its military cousins, some visual systems to identify and consider marketing warfare maneu-vers. Thus, for a long time, competitive intelligence community was already in-terested by information visualization tools for their applications (Shaker and Gembicki 1998, 130) (Bose 2008) (Besson et al. 2010, 122). Then, we can sup-pose that a visual application for wargaming will improve the use of competitive intelligence. With this consideration, the wargames are tool for creative competi-tive intelligence, i.e. a kind of competicompeti-tive intelligence where we use creacompeti-tive techniques to stimulate imagination of decision-makers and analysts in a goal of opportunity and threat identification. Then, in this paper, we try to solve this problem: how to display information in order to propose a solution for marketing warfare maneuvers visual presentation in real competitive context? We ground our work on information clarifying in relation with, first the marketing warfare theories, in the second place on wargame history and solutions and, in the third place to propose a visual representation of war analogy with visual tool already developed for it: board wargames. Finally, we present our methodology to trans-form some market or product intrans-formation in a tactical board wargame. To illus-trate this, we create a map dedicated to home video game consoles battle, on French market, between Sony and Nintendo from 1995 to 2007.
2 Marketing warfare
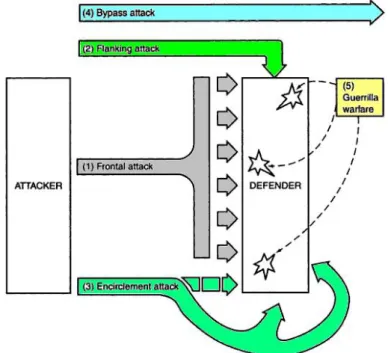
By analogy with the war, marketing warfare is based on the idea that many competiveness situations can be interpreted in terms of war strategies. In the beginning of 1980s, (Kotler and Singh 2001) and (Ries and Trout 2006, 44) pro-posed to consider the mind of consumer as a battleground. Then, they interpret company strategy possible choices with four categories: (1) defensive, (2) offen-sive, (3) flanking attack and (4) guerrilla. In the case of (Kotler and Singh 2001)
there are two flank/flanking attacks1 (figure 1): simple and bypass (a bypass
at-tack wins the battle by atat-tacking not defended zones). For (Ries and Trout 2006, 83) bypass attacks are not accurate and encirclement attack is included in flank-ing option. However, they add which strategy is good for which company.
• Defending option suits to the market leader, it implies than all strong com-petitive move should be blocked and the best defensive strategy is the courage to attack oneself.
• Direct offensive option suits to the number 2 company on the market, it implies to consider the strength of the leader’s position, to find a weakness in the leader’s strength and attack at that point and to launch an attack on a front so narrow as possible.
• Flanking option suits to smaller companies, it implies tactical surprise, ori-ented attack into an uncontested area and to pursuit attack to its end.
• Guerrilla option suits to local and regional companies, it implies for these companies to find a market segment small enough to defend, to never act like the leader and to be prepared to run away at any time.
Figure 1. Attack alternatives in marketing warfare (Kotler and Singh, 2001)
1In marketing warfare, it seems “flanking attack” expression is preferred to “flank attack”; but for military terminology, it seems to be about it differently. Then in this paper, when we talk about marketing warfare we use “flanking attack” and when we talk about military battle we chose “flank attack” wording.
However, these propositions seemed shake strategic and tactical attack and de-fence warfare levels. For example, guerrilla warfare is a type of warfare and not really kind of attack. To respond to this problem, (James 1985, 7) proposed 4 kinds of strategic maneuvers: deterrent, attack, defence and alliance. “Deterrent
strategies in business attempt to induce stability by encouraging prudence on the part of competitors” (James 1985, 31). Attack and defence strategic
maneu-vers contain each one a set of tactical maneumaneu-vers. Attack includes (Kotler and Singh 2001) alternatives and isolation and unconventional offense. Unconven-tional offense is a kind of interpretation for guerrilla tactics when guerrilla forces look for a local superiority to strike the enemy and to retreat otherwise. Isolation alternative is a specific (James 1985, 60) proposition. With this tactic, enemy strong points “are bypassed by main forces and mopped up by later waves of
troops or left to surrender”. Tactical defence maneuvers include: position
de-fence (intensification of its positions), mobile dede-fence, pre-emptive strike, flank positioning (reinforcing flanks), counter offensive and withdrawal.
But, for all of those propositions, marketing warfare doesn’t suggest a less met-aphoric interpretation of maneuvers. The only system proposed is a reference to market segmentation. It is interesting, but too much abstracted to interpret a situation in terms of attack or defence alternatives. To apply this kind of idea people as us need to imagine battleground and armies positions. In fact, at a tactical level, marketing warfare seems have no solution to guide our interpreta-tion of clash acinterpreta-tions and battle orders. At this level, marketing warfare is a kind of philosophy to consider and to manage a market situation.
Another criticism of marketing warfare is the use of some innovation solutions to
illustrate it without a real place for innovation in the construction of strategy. For (Ries and Trout 2006, 58) innovation (attacking yourself) is an element of a ma-neuver to attack or defend a position (for example: Starbucks coffee, Gilette ra-zors and iPod). But they don’t give any information to identify a kind of innova-Figure 2. Two counters for a board wargame (Great Battles of Alexander, GMT
tion efficiently in these cases and the others. To found this kind of information, to include innovation with more guidance in marketing warfare strategy, we looked into innovation literature and specifically into the buyer utility map (see chapter 4.1).
3 Wargame proposition
Wargame is a tool made to consider a war situation with many possibilities of development. It helps the decision-maker to envisage his choices and those of the opposite front. “The object of any wargame (historical or otherwise) is to
en-able the player to recreate a specific event and, more importantly, to be en-able to explore what might have been if the player decides to do things differently”
(Dunnigan 2000, 1). Its recent history has two centuries as regards military ap-plications and around 60 years for business considerations. Wargames propose different options to consider war situations from skirmish level to strategic level including tactical level.
3.1 Brief history of wargames
It is difficult to date origin of wargame. Most of authors give an origin around the 7th century BC. The two traditional ancestors of wargame are the Game of Go and the Chess, respectively: Wei Hei from China and Chaturanga from India. Personally, we add at these two ancestors, three other forgotten abstract games with similar rules: Petteia2 (Greece), Seega (Egypt) and Latrunculorum (Rome),
which are appeared around the 5th century BC. From those very abstract war or battle representations, others kinds of war game appeared. One could be
Metromaxia, a Chess evolution which presents around 1578 a medieval battle
simulation between two armies and two castles, and a resolution of the battles based on mathematics (Boutin and Parlebas 1999). Some years after, a battle-ground simulation appeared in Prussia. In 1644 C. Weickhmann created the
Koenigsspiel (King’s game). It's a game derived from Chess: a first “War Chess”
model including a board bigger than usual and thirty tokens for each player. One century later, in 1779, J.Clerk proposed a simulation of naval engagement,
haps the first naval wargame (Perla 1990, 20). This game used small wooden tokens to represent combat actions between warships with rules including geom-etry and mathematics to solve firepower effects, ship maneuvers and wind ef-fects. Admiral G.B. Rodney tested some new tactics studied with Clerks wargame and validated them with his victory in the Battle of Saintes (1782). Modern war-game history begun at this time. In 1780, C.L. Helwig modified War Chess to transform them into a modern wargame. He extended the game board to a 1666 squares board, using coloured squares to represent ground variations (forests, rivers, mountains, …) which have an impact on tokens movement, he proposed the aggregation concept: “employing a single playing piece to represent a large
body of soldiers or organized combats units” (Perla 1990, 18) and, he included
an umpire to supervise the play (to decide in case of ambiguities). Right after, in 1797, Georg Venturini adapted Clerk's game with topographic maps (battleships were removed by battalions). Finally, we can say that modern wargame was re-ally born in Prussia with the invention of kriegspiel (literre-ally wargame) by Von Reißwitz, father and son, between 1811 and 1824. The game used a map like Venturini's game and rules included a calculation system to quantify the combat effects of different types of units of this time (Perla 1990, 28). After a first failure to propose this game to teach war principles to young Prussian officers, the game modified by the son was adopted by Prussian army. We notify than some years later, in Prussia, two conceptions of kriegspiel (wargame) are defended: the rigid kriegspiel, based on statistics and calculations for movement and en-gagement resolution with lots of detailed rules, and the easier and faster free
kriegspiel, notably because troops capacities are based on umpire interpretation
according to the context. Prussian and German victories of the second half of 19th century contributed to develop both wargame systems in others countries (USA, UK, Japan …).
Afterward, the evolution of wargame was made in the USA. First, Lieutenant C.A.L. Totten published in 1880, Strategos: a serie of american games of war
based upon military principles. This game was designed for history fans and is
one of the first wargames dedicated to civilians. Totten contributed in wargame development with the reintroduction of squares on the board with a topographic square grid map to simplify movement calculation (Patrick 1977). Second, Major W.R. Livermore edited in 1882 The American kriegspiel, A game for Practicing
Art of War Upon a Topographical Map, a translation of rigid German kriegspiel.
From Livermore, tokens are often counters with specific informations marked above (figure 2). This solution helps the facilitated use of rigid wargame.
After Totten's works, civilians quickly adopted wargames for their concerns, and the hobby of wargame was developed in two types: board wargames (with coun-ters and map) and wargames with miniatures (little tin soldiers or vehicles) initi-ated by H.G. Wells's game: Little wars in 1912. But, the true wargame hobby development is after the Second World War, in 1958, the year of Avalon Hill cre-ation, a company dedicated to wargame edition for civilians. This company crea-tion was followed by many others along the years 1960-1990. Concerning the application of wargame to business, it seems that its beginning is linked to mili-tary electronic wargaming development. During the Second World War, comput-ers and electronic calculators were developed. In 1958, the Navy announced de-velopment of NEWS (Navy Electronic Warfare Simulator). Then, the same year (Andlinger 1958) proposed a kind of business wargame to the consulting firm of McKinsey & Company (Faria and Nulsen 1996).
3.2 Wargame application to business
From the application point of view to market, wargames are generally called “business wargames”. But in these cases (Kurtz 2003) (Gilad 2009, 17) (Oriesek and Schwarz 2008, 22), the business wargame is a kind of role-playing game applied to competitive environment. From the 1970s (Kalman and Rehnman 1975), it seems that the business wargame is thought as a set of teams (2 to 6) associated with a market complex computing simulations and a set of scenarios. The role-playing simulation in competitive business situation with a computing model can be linked to the rigid business wargame and those without simulation, simplest to manipulate, can be linked to the free business wargame (Gilad 2009, 19). A business wargame takes around 6 weeks to 12 weeks for the rigid ver-sions (Herman et al. 2009, 15) and 1 to 2 days for the free verver-sions (Gilad 2003, 90).
The phases of a business wargame as for others simulation developments are most often on this model (Oriesek and Schwarz 2008, 119):
1. Design: objective and requirement definition, interview with senior man-agement;
2. Preparation: game book conception, market and control models develop-ment, pre-tests;
3. Execution: team motivation, run the wargame;
4. Debriefing and documentation: documentation about lessons learned and implications for next steps strategy realizations.
Unfortunately, in these cases of wargame use to market, we didn't find a real visual map to identify competitive maneuvers. The only option about which we know is a business board game based on monopoly board (Schwartz and Teach 2002) and this type of presentation is not what we have been looking for. This is why; we turned to wargame hobby and in particular to board wargames, in order to found some interesting presentations for our problematic.
3.3 Board wargame presentation
A board wargame usually includes five types of elements: (1) a map, (2) counters or others pieces representing units, (3) rules, (4) few player aid cards and (5) a set of scenarios.
Nowadays, there are essentially three kinds of maps for board wargame: geo-morphic, geographical and point to point. Geomorphic maps are mostly hexago-nal grid maps (an Avalon Hill Company creation), these maps are generally used for tactical level games. Geographical area maps are maps where counters are put on areas identified among others by a frontier. Point-to-point system maps use mostly some intersections, generally communication ways to put the coun-ters above. On a map some particular context elements can be shown like ground variations. Geographical and point to point maps are generally used for strategic level games. Size of map depends of the game, but generally is display on a sheet around 17*22” to 22*34” (43.2*55.9 cm to 55.9*86.4 cm or ~A2 to A1 page format).
Shape of the counters (like in figure 2) is mostly square or double squares. (Simonen 1977) specified that the standard counter size is 13.86 mm (~0.54”) for a map with standard hexagons of a diameter of 16 mm (~0.63”). Counters
are designed to present important information for the gameplay. On each coun-ter, a set of data is displayed according to its relative importance. An order and a code (position on the counter and a specific colour) to represent items on coun-ter is chosen to identify one from another. (Simonen 1977) presents a list of questions to display items on a counter:
1. Who owns the counter? 2. What type of counter is it?
3. What is the primary value(s) of the counter?
4. What historical or functional information not included in above categories is necessary for the play of the game?
5. What historical information not included in categories above is desirable to display on the counter even though the information is not functionally nec-essary?
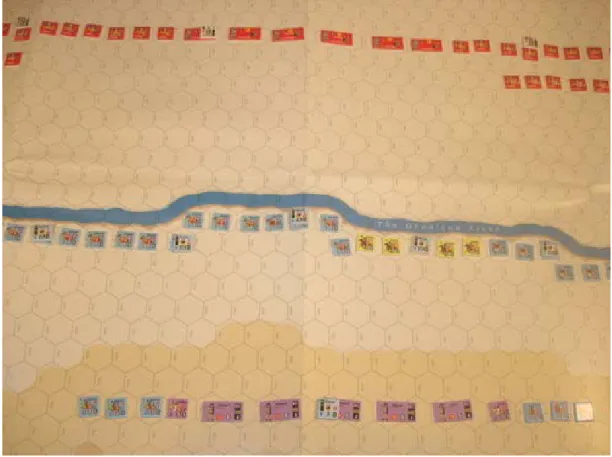
Figure 3. Great Battles of Alexander (GMT Games) board wargame map with ar-mies to represent the Battle of Granicus River
Counters represent most of the time military units or others specials elements like units leaders. To help identification of units, units of the same origin (country or army) are represented with counters of the same colour. In addition, to solve ambiguities in case of a large set of counters, their origin is written on the coun-ter. For the same consideration, the type of unit or leader is displayed with an abbreviation associated to an image representing the unit or the personage.
Rules explain historical considerations, the representation scale chosen, items displayed on a counter, sequences of play, a system to solve engagements and movements (notably, in function of units types and terrain variations). Rules usually include charts to help players to solve most of situations in the game. These charts are often offered in the shape of player handouts.
Finally, a set of scenarios proposes some situations to play the game and con-sider the historical vision of the game designers. A scenario includes army battle orders (i.e. The positions of units on the map at the beginning of the game), ob-jectives of each army, the duration of the game (or number of game turns), and a system (victory point calculation) to know who has won at the end.
4 From marketing warfare to board wargame representation
After some discussions with managers and others decision makers, we noticed that marketing warfare notions are too abstract for a lot of people. Even though, they approve some marketing warfare considerations, it is difficult for them to apply them easily to their business. In fact, we had a problem to visually repre-sent marketing warfare concepts. Another problem with marketing warfare appli-cation seemed to be the innovation solution development to support attack or defend strategy of a company. At this moment, we looked for innovation tools and we were interested in the buyer utility map (see chapter 4.1). But, with this tool to help to orientate an innovation strategy, we had no solution for the other marketing warfare concepts. Then, as marketing warfare is a war analogy for marketing, we looked for in the field of board wargames. Without a real solution, but with some idea of board representation, we have developed our own solu-tion.
First, in the order in which elements included in a wargame were presented, we began with the map. Remember, in marketing warfare; the prospect or
con-sumer mind is the battleground. In fact, we have proposed a very simple solu-tion that anybody can use, understand and modify according to the context or points of view. Then, with tactical board wargames, we have considered which elements permit to understand a battle in terms of maneuvers. Board wargames seemed to be the best for our problem (figure 3). Like in marketing warfare, we decided that battleground is the consumer mind, i.e. from his point of view, in-terpretation of a product or a service value\interest.
4.1 Tactical wargame considerations
We considered all components of a current tactical board wargame to trans-form it into a product or service board wargame presentation. First, we decided that tactical wargame maps (geomorphic maps) are good representations of ob-jectives. These maps (square grid maps or hexagon grid maps) are very practi-cal to define the positions of units and to practi-calculate their movement. But, with these maps it is a priori difficult to determine the front line. This is why, we thought that, like with Chinese chess, a river can be very practical for delimitate the front line (figure 3). Then, we had an idea of the shape of battle maps that we wanted.
Second, we tried to define counters. In a wargame, counters represent army unities. In marketing warfare, armies are companies. For our objective, counters should represent a company unit for a particular market from a consumer point of view. Thus, we opted to make counters with a colour and a representation relatively to its company.
But, what these counters can represent and how they can be put on and can move on the map? In wargames, this is developed in a scenario at units scale, along with the order of battle and the rules for movements. This implied that we have some equivalent consideration for marketing warfare representations. With classical market segmentation grid, parameters chosen are not ordered except for some of them like age categories. But, we wanted units to be able to move on the map. With a counter corresponding to a classical interseption in a market segmentation grid, it is very difficult to simulate few coherent movements with regard to time. However, if we consider a priori a counter movement and link it to consumer mind, we can have some idea of what is a counter movement. A
counter movement is a translation of a value variation of something in the consumer mind. Reduce to one dimension; we linked this to a consumer interest indicator. Then, we can use a dimension to move our counter and another one to help to put it on the map. If age categories can be ordered, they are not the only element. Another alternative was proposed by (Kim and Mauborgne 2000) with the buyer utility map. (Kim and Mauborgne 2000) proposed a solution to identify where and how to present a new product or service. Their idea is to consider an innovation according to consumer utility. This map is based on six stages of buyer experience cycle and six utility levers (a set of variables) from consumer point of view. The crossing of these two sets forms the buyer utility map (figure 2). “By locating a new product on one of the 36 spaces of the buyer utility map,
managers can clearly see how the new idea creates a different utility proposition from existing products” (Kim and Mauborgne 2000).
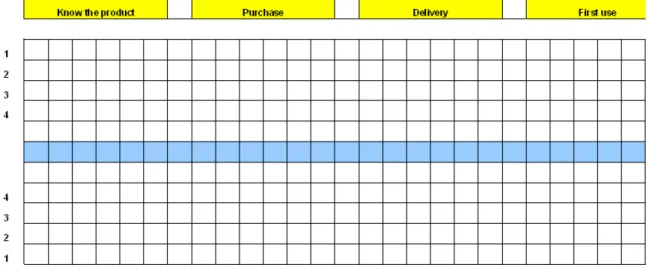
For this, we borrowed fundamental elements of the buyer utility map. For the six stages of buyer experience, we put them in connection with purchase process (Tyagi and Kumar 2004) and we added two stages: know and first use. At least, we have eight stages of consumer experience cycle: (1) know and found, (2) purchase, (3) delivery, (4) first use, (5) use, (6) renew and reload, (7) mainte-nance and stowage, (8) disposal.
The eight stages of the buyer experience cycle are the set of ordered parame-ters, and the consumer interest for something is the second set of ordered val-ues. Consequently, from the buyer utility map, we transformed the user utility levers in consumer interest indicators and associated these to army unities. Then, we suggested estimating the value of one product or service utility by a user/consumer on a Likert scale from 0 to 4. 0 represents non-existent lever of the user or consumer perception. 4 represents the best satisfaction from the point of view of the user. By a symmetry, we can make 8 columns (from the 8 stages of consumer experience cycle) in which each company unit can be put in relation with a competitor unit. To use a set of consumer interest indicators by column, we divide them in functions of situation studied in 5 to 8 sub-columns and, for more visibility; we insert 1 or 2 columns between 2 set of sub-columns. To separate armies, we use 1 line between them, line in the shape of river and we propose to board this line with 2 others, 1 for each camp. At the end we ob-tain a standard map on which army units can be put (see figure 4).
Then, we needed to define some rules for the placement of the units and their movements. To be simple, in the point of view of one camp, we put on a unit in a sub-column from left to right by beginning with the highest line, after we go to the second highest line, etc., with a displacement of some spaces to complete most of sub-columns with others lines. For the movement, we consider it as a result of a position phase and a combat resolution phase. Position phase is the phase in which a company puts its units on the map and proposes a rearrange-ment of them. Combat resolution phase is the phase in which we see the differ-ence, for each column, between the total value (i.e. its strength) of a group of units of one army (put them in the sub-columns of the column) with the group of units of the other army in the same column. According to the result, the best group advances from 1 to 4 squares and the lesser group retreats symmetrically from 1 to 4 squares along the column. If the difference between two army groups is null or very weak there is no attack and retreat movement in this column. We propose this engagement resolution table (for 6 to 11 potential counters by column):
• 4 squares displacement if one group of units has a strength 4.1 or more higher than the competitor's group;
• 3 squares displacement if one group of units has a strength 2.4 - 4 higher than the competitor's group;
• 2 squares displacement if one group of units has a strength 1.5 - 2.3 higher than the competitor's group;
• 1 square displacement if one group of units has a strength 1.2 - 1.4 higher than the competitor's group.
• no displacement if one group of units has a strength 1-1.1 higher than the competitor's group.
In function of peculiarities of the situation (ground variations) and the value gap between the two groups of units, the umpire adapts this rule and decides how many squares is the movement. As for free kriegspiel, we can play the role of umpire or we can resort to an expert to play this role. The umpire estimates from the positions of units and other informations like importance of this interest lever vis-à-vis the supposed result of the engagement. This result can have three forms:
• each group of units doesn’t move (equal fight);
• one group of units moves forward and the opposing group steps back; • one group of units moves forward without opposition.
For a product clash map elaboration, the same thing could be asked to the umpire about specificities of the battleground. The question can be asked for each column if movements on it are slower (a 1.6 superiority could be necessary to move from 1 square in place of 2, for example).
Finally, we need to do a hypothesis about the sequence of events. In fact, in classical board game, each gamer plays, moves his pieces and calculs potential effects. After what, the game turn is finished and a new one begins, repeatedly untill the end of the game. This is easy, but if we want to transpose some variables for a market with the aim of having a better understanding of competition for a type of product, this suppose an equivalent sequence of events. Thus, when we consider a battle for a product, we need to consider what
events are and if this seems logical that they form a sequence. Position and movement phases are realized with regard to the last position for each column. Then the product value scale is moved in function of movements previously realized.
Finally, we obtain a system which allows to confront estimations of two products or services equivalent from consumer points of view to a representation which results from a board wargames analogy. Even though, we only have linear movement by column, we can try to consider attack and defence warfare maneuver alternatives with this system.
4.2 Inspiration from attack and defence maneuvers
Marketing warfare analogy was made from war analogy and in some cases from battle analogies. To propose a wargame map of marketing situations, we have thought that we had to realize it in the same way. Then, we looked for some historical battles to base our consideration on a visual analogy system. In fact many known battles have begun with a river separating two armies. We have found eight of them which illustrated eight kind of marketing warfare attack or defence maneuvers presented higher. The battles selected are: Granicus River (334 BC), Trebbia (218 BC), The Sabis (57 BC), Mohi (1241), Yamazaki (1582), Leuthen (1757), Austerlitz (1805) and Shiloh (1862). Of course features of un-conventional attack or guerrilla warfare for maneuver considerations are such that we won’t treat them with our proposition. The same problem arises for iso-lation attack and pre-emptive strike. Thus, we have tried to consider a typical example for each one, attack or defence:
• Frontal attack: at the Battle of Granicus River (334 BC), in a narrow pas-sage where Persian army can’t deploy its numeric superiority; Alexander the Great army charges with a bigger quality of cavalry and heavy phalanx infantry and initially defeats the Persian center after what Persian army re-treat.
• Flank attack: at the Battle of Yamazaki (1582), with as front line the Enmei-ji River, Toyotomi Hideyoshi (the Japan's second great unifier) blocks his
enemy Akechi Mitsuhide, fights adverse right flank with a local superiority and after this maneuver surrounds him.
• Bypass attack: at the Battle of Mohi (1241), separated by Sajo river, the Mongol army attacks the Hungarian army at the bridge of Mohi meanwhile many others Mongol troops directed by Subutai cross the Sajo river in south of the bridge of Mohi where nobody waits them, after what they at-tacked the Hungarians’ rear flank.
• Encirclement attack: at the Battle of Trebbia (218 BC), after some provoca-tions and having hidden some of his cavalry in the upstream to the Trebbia river, Hannibal waits the assault of the roman army which crosses the river. Then, the Hannibal's cavalry which isn't hidden attacks the roman army flanks and his hidden cavalry charges the roman rears.
• Counter offensive: at the Battle of the Sabis (57 BC), Caesar strengthens its camp to stop the frontal assault of Belgium tribes, after what he counter attacks, defeats his enemies and takes their camp.
• Mobile defence: near Leuthen (1757), an important Austrian army crosses the Schneidnitz River to fight Prussian. Frederic the Great with a twice less important army, but with a better mobility, divides his army in two groups, north and south, to fight Austrians. After a withdraw feint, he brings quickly his north army to the south to have a local superiority and then, repels and defeats Austrian army.
• Flank positioning: at Austerlitz (1805), Napoleon army leaves the Pratzen plateau Heights to align back to the Goldbach Brook exposing apparently a weak right flank to his enemies. But, when Prussians and Russians leave the Pratzen heights for attacking, the right flank of their army is exposed to all French army. Then, the Great Army reinforces its right flank and engag-es a general assault and defeats the enemy.
• Tactical withdraw: at the Battle of Shiloh (1862), the Union army is sur-prised by the Confederate army and moves back to a second line to defend itself, leaning on two gunboats on its flank. The Confederates are stopped at this level and after a day of confrontations, General Grant reinforcing forces cross back the Tilman Creek and push away the enemy.
It seemed to us that the major part of this development could be represented with a simple map. First, frontal attack, counter offensive and tactical withdraw can be represented with no modification. Second, flank attack needs to establish the superiority for a group of units and an oblique or rotational movement di-rected to an enemy group of units adjacent to their column. For this, it seemed necessary that the aggressor's group of units has a big superiority on his oppo-nent's group of units in its column and that a link between its column and the adjacent column including the target group for flanking attack can be establish in the consumer mind. Third, bypass attack need a surprise effect on battleground. To make it possible, we have added another particular stage between two col-umns. From the consumer point of view, we estimated that a new column: divert and propose others functionalities, could be a solution to represent bypass at-tack. At the moment, we have chosen to put it between stages (6) renew and reload and (7) maintenance and stowage. This particular stage creates a space in the battleground of the shape of a lake. For our considerations, for a company developing a product from a standard, innovation by addition of new functionali-ties is an always accessible but risked way. If our complementary solution is not appreciated by customers, our army can’t cross the lake. The lake underlines this risk and shows explicitly where a bypass attack can be realized. Fourthly, encirclement attack and flank positioning defence are from our point of view some variations of combinations between attack and defence above.
We propose according to the case and the context to move units from 1 to 3 squares of movement. All of these movements are good. Later, if a relation can be established between two buyers experience stages where a group of units is in the opposite camp, then one has to be afraid of a flank movement of the in-vaded camp. Then some units can be turned to signal the flank movement.
5 Example of market battle by board wargame display
To illustrate our proposition, we show a possible interpretation of home video game console battle between Sony and Nintendo. This illustration can help us to
explain our methodology. This battle began in 1989 when Nintendo breaks his home console game development partnership with Sony. In December 1994 Sony answers back by Playstation 1 on Japanese market. From this moment, the battle between Sony and Nintendo implied 7 game consoles: Super NES (Ninten-do Entertainment System), Playstation1 (Sony), Ninten(Ninten-do 64 (Ninten(Ninten-do), Playstation2 (Sony), Game Cube (Nintendo), Playstation3 (Sony) and Wii (Nin-tendo). For this, we have questioned 4 French people who bought at least 4 of those consoles and know the others. In this specific case, only the battle for the French market could be interpreted.
5.1 Map and counter elaboration
We know what it is the situation of market which we have to represent: the French market of game consoles between 1994 and 2010. First, we adopt the consumer experience process to determine columns of the map. We add the umn: divert and propose other functionalities. We have at this moment 9 col-umns. We know which shape of representation we are going to obtain. Then, we begin to design counters. Second, we need to determine which consumer inter-est parameters are relevant for this product study. From the list of user interinter-est levers, we made a brainstorming and identified 9 consumer interest parameters: (1) simplicity and facility, (2) autonomy and adaptability (in the variations of context), (3) risk perception, (4) emotions and sensations, (5) well being, (6) cost, (7) trend or tradition, (8) quality and reliability, (9) variety of choice. With these 9 consumer interest parameters, we propose 6 sub-columns by column plus one other sub-column between each column to reduce visibility problems. Correspondingly to the value graduation and the symmetry between the two ar-mies, we separate them for the first turn by the front line river. Third, the ques-tion of the ground variaques-tions is posed. Has each column the same importance for the French game console consumer? After discussion, we decide that columns: (1) know the product, (2) purchase, (3) delivery, (8) maintenance and storage and (9) disposal are lesser relevant. We color them in grey and the others in green to mark the differences.
Now, we need to design counters. We know that there are two counter owners: Nintendo and Sony. We propose to use a square counters type. The first infor-mation on the counter is its owner, and the second one is the consumer interest
parameter linked to him. The owner will be represented by its name, a colour and a specific image. Nintendo's colour will be white and that of Sony, red. For the images, we can take the Playstation logo for Sony and the Nintendo most known personage for Nintendo, i.e. Mario (figure 5). The consumer interest pa-rameter will be represented by its abbreviation in capital letters (for instance: SF for simplicity and facility) follow-up of its complete expression with a smaller font size. About ground variations, we need to question us about the consumer inter-est parameters, some of them are more important than others. The response is yes for: (4) emotions and sensations and (9) variety of choice. We decide that these two parameters are twice as important as the others. Now, we have three choices to design these particular counters:
• write a strength indicator to show its double value (figure 6); • use a double size counter to indicate its double value (figure 6); • double the counter number for these parameters.
We make the third choice. Then, we can ask ourselves if some other information should be display on counters. One could be the value at a given moment of this parameter, but we decide that it is not necessary for the battle representation. Our choices of counter design are finished.
Figure 5 Information display on two counters linked to simplicity and facility pa-rameter
Figure 6 Two others possibilities to indicate the double value of a parameter (size * 1.5)
5.2 Information gathering
When we have determined counters and columns for the Game, we can develop some complementary rules and scenario or directly collect important information for the progress of the game. In our case study, we need to have, for each of 7 game consoles, an evaluation on a scale from 0 to 4 in function of 9 points of view (our column categories) and 9 parameters (counters categories). We have at the moment 7 charts to complete. We could develop others charts for the estimation of one concole at a moment vis à vis the competitors's consoles, but we think it's already implicitly present in our 7 charts and this reduces the number of questions to ask. Then each people complete their charts. An average estimation is calculated by rounding off.
5.3 Rules and scenario development
First, we must decide on the sequence of events. We make the decision that each battle event is linked to the introduction of a new game console on the market. We suppose that it is reasonable to consider that these type of events can form a sequence. These events will help us to determine the number of game turns. From an information retrieval, we identified on French market, 5 turns for this battle:
1. 1995, Sony presents Playsation1.
2. 1997, Nintendo responds with Nintendo64. 3. 2000, Sony proposes Playstation2.
4. 2001, Nintendo responds with GameCube. 5. 2006, Playsation3 and Wii are on the market.
Each turn includes a game sequence. For our development, we adopt a game sequence in 3 steps: (1) companies put their counters, (2) by column, unit’s strenghts are compared, (3) movement phase is realized in relation with strenght estimation.
Next, two questions can be ask, at the first turn who has the initiative and is one of the two competitors in defence postion? If the answer to last question is yes, must some special rules be introduced for this turn? In our example, we decide that there is no real initiative. But, concerning defence position, we think that
Nintendo occupied the ground some time before Sony and this is why Nintendo can have some advantage at the first turn. Then, for each group attack of his competitor, as a strenght estimation, we make the decision to add implicitly the equivalent of one level 4 counter.
At least one technical point must be solved. What can we do if the number of counters on the same line of a column is upper to 6 (number of sub-columns). First, we can use one subcolumn to separate columns. Second, since we have two counters in double number, we can pile them up in this situation. In this last case, a small interval between the counter in the background and the counter in the foreground will indicate two counters in this position.
Now we can run the Battle game representation.
5.4 Representation of the home video console battle
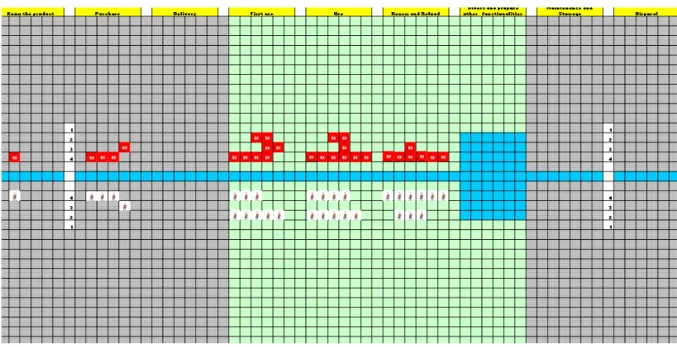
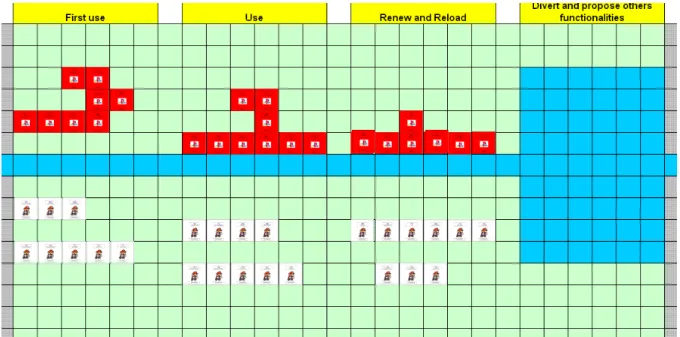
Turn after turn, we can display information on the shape of a tactical board wargame. Figure 7 presents global map with initial position of competitor in the mind of test group. To present others turns and game sequences, we just focus on 4 green central columns: (4) first use, (5) use, (6) renew and reload and (7) divert and propose others functionalities (figure 8).
Figure 7. First turn, first game sequence, Sony attack with Playstation 1 against Nintendo Super Famicom (before movement, map scale 1/5)
Figure 8. First turn, third game sequence, Sony attack with Playstation 1 against Nintendo Super NES (after movement, map scale 1/2)
Let's form ours charts; the other columns bring no modification in battle situa-tion. In addition, the size of the real map is too big to clearly display all infor-mation in this paper. So figure 8 represents counter positions after the move-ment resolution at the end of turn 1.
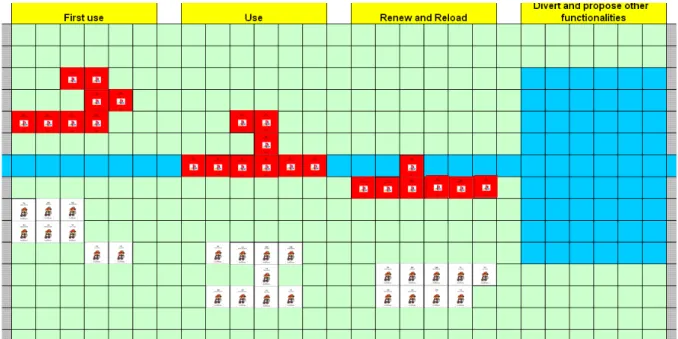
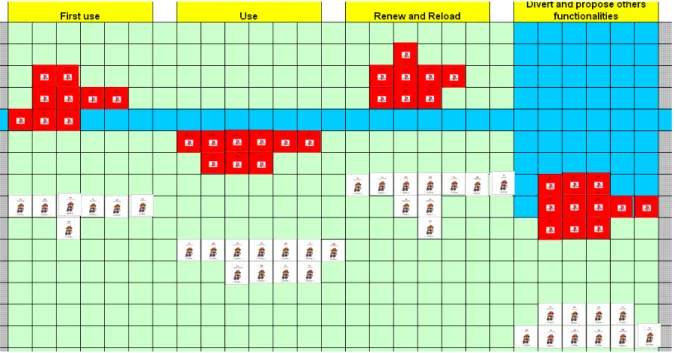
Figure 9 displays the arrival of Nintendo64 console versus Playstation1. In this figure, movement sequence is finished. We can see the failure of the counter at-tack and the retirement of Nintendo64 units. And, in figure 10, we note progres-sive losses of ground for Nintendo confronted with the Playstation2. We see the units of Sony crossing the lake to bypass attack, linked particularly to the possi-bility for this console to read DVD.
Figure 9. Second turn, third game sequence, Nintendo 64 response to Playstation (after movement)
Figure 10 Third turn, third game sequence, Playstation 2 against Nintendo 64 (after movement)
Figure 11 shows the Nintendo response to Playstation2 with GameCube. Again we can see the defeat of Nintendo's units against Sony's solution. This figure
al-so shows the Sony encirclement attack on the group of Nintendo units in column “renew and reload”.
Figure 11. Fourth turn, third game sequence, Game Cube against Playstation 2 (after movement)
Figure 12 Fith turn, third game sequence, Playstation 3 against Nintendo Wii (af-ter movement)
Finally, figure 12 represents the simultaneous arrivals on the market of Playstation3 and Wii consoles. We see the Nintendo counter offensive for each
column. The occupation of column seven by Nintendo is explained by the possi-bility to use notably Wii for fitness. For Sony, this column is a continuation of Playstation2 solution with the integration of a Blue-Ray/DVD reader in the Playstation3. We can now also see the potential risk for Sony to suffer a flank attack on the column: divert and propose other functionalities.
5.5 Possible interpretations of the home video game console battle
With some statistics of year 2001 on game consoles sales on French market3
and in function of marketing warfare maneuver link, we can propose some inter-pretations for this information visualization method.
First, we can see, with figures 8 and 9, the mutual frontal engagement be-tween Sony and Nintendo game consoles. With Playstation2, we can see a by-pass maneuver by Sony. Figure 10 illustrates it and the statistics of the year 2001 in France for market shares show: Playstation2, 19%, Nintendo64, 2%. The Nintendo response with GameCube doesn’t try to stop the Sony bypass at-tack. The statistics for these consoles on French market for the years 2003 are: Playstation2, 30% and GameCube, 8%. At least, the real counter attack by Nin-tendo is realized with Wii. As for Playstation in front of the NinNin-tendo64; for each central column implied by Sony assault, Nintendo is better. French market shares in 2009 for Playstation 3 are 20.8% and for Wii, 27%. It is a general counter attack. The reduction of Nintendo response delay with his last console can persuade that GameCube was introduced on the market as a tactical with-draw or a flank positioning. We can also notice that at this moment in a similar situation, after consecutive failures of Sega consoles (MegaDrive, SegaSaturn and Dreamcast) in front of the Playstation1 and 2, Sega choose a strategic with-draw. This company stopped game consoles development and proposes now vid-eo games for others consoles. Consequently, with this example, it seems that according to marketing warfare, flanking attack has a more important impact than frontal attack, even though the difference between the forces is big. Indeed for bypass threat (figure 10 and 11), differences between French market parts are respectively 17 and 22 % for Playstation2 vs Nintendo64 and Playstation2 vs
GameCube. By comparison, when the Nintendo Wii counter attack is realized, it is similar to a frontal attack and French Market parts difference is 6.2% for the year 2009.
6 Conclusions and perspectives
We have seen fundamental principles of marketing warfare to see specifically what kinds of maneuvers it propose to defend or conquest a market. In parallel, we have presented military wargames and their history. The reason is that tacti-cal wargames propose some solution to recreate a specific battle with army ma-neuvers. Since, we did not find a visual business wargame solution for our prob-lem in the literature, we have decided to develop one. For this, our approach is based on current tactical board wargames for civilians. We have presented all components of them to found an equivalent for each component in order to gen-erate a product clash map. Then, tokens of the game are some important varia-bles for the product potential consumer, and to define battle orders, we used an ordered set of process steps in correlation with an estimation scale of consumer interest for the product concerned. With these elements, we have reconsidered classical tactical maneuvers named by market warfare authors for our battle map system. We have concluded than most of tactical maneuvers could be interpret-ed with this system. Finally, we have shown how to interpret a market battle with this kind of information display. For this we built a wargame to represent the battle of home video game consoles on French market from 1994 to 2009. With it we showed that a parallel could be made between tactical maneuvers on the map and the statistics of sales for this market at a given time.
Henceforth, we continue ours experimentations to make board wargame in order to simulate few others market engagements. We hope to develop a soft-ware dedicated to this, with an additional possibility to transform a square grid map into a hexagon grid map to improve the connection with most of tactical wargame maps. In our opinion, this information visualization tool permits to per-form competitive intelligence practices with the possibility to add value to infor-mation by its representation. Another advantage of this methodology is to ex-tend the question about the company environment to identification of threats
and market opportunities linked to a service or a product. In the continuation of this idea, we think that this information display helps to make a decision about innovation strategy. For instance, decision-makers can identify where the major impact of a product could be. Then, in connection with a list of parameters (equivalent to a unit in our representation) considered as important on the map, they can define specifications for an innovation team dedicated to develop the new product. Thus, we hope to extend our work to contribute to innovation.
References
Andlinger G. R. (1958). Looking Around: What Can Business Games Do?, Havard
Business Review, 36(4): 147-152.
Besson B. et al. (2010). Méthodes d’analyse appliquées à l’Intelligence
Econo-mique, Livre Blanc II. Poitier : ICOMTEC.
Bose R. (2008). Competitive intelligence process and tools for intelligence analy-sis, Industrial Management & Data Systems, 108(4): 510-528.
Boutin M. and Parlebas P. (1999). La métromachie ou la bataille géométrique,
Board Game Studies, 2: 80-103.
Cares J. and Miskel J. (2007). Take your third move first, Harvard Business
Re-view, 85(3): 20-21.
Kim C. W and Mauborgne R. (2000). Knowing a Winning Business Idea When You See One, Havard Business Review, 78(5): 129-138.
Dunnigan J. F. (2000). Wargames Handbook: How to Play and Design
Commer-cial and Professional Wargames, San Jose: Writers Club Press.
Durö R. and Sandström, B. (1987). The basic principles of Marketing Warfare, Chichester: John Wiley & Sons.
Faria A. J. and Nulsen R. (1996). Business simulation Games: current usage lev-els: A ten year update, Developments In Business Simulation & Experiential
Exercises, 23: 22-28.
Fuld L. (2003). Be Prepared: The Future looks a lot less Uncertain with the right Early Warning System, Harvard Business Review, 81(11): 20-21.
Gilad B. (2009). Business War Games: How large, small, and new companies can
vastly improve their strategies and outmaneuver the competition, Franklin
Lakes: Career press.
Gilad B. (2003). Early Warning: Using Competitive Intelligence to Anticipate
Market Shifts, Control Risk, and Create Powerful Strategies, New York:
Ama-zon.
Herman M., Frost M. and Kurz R. (2009). Wargaming for leaders: Strategic
deci-sion making from the battlefield to the boardroom, New York: McGraw Hill.
James B. (1985). Business Wargames, West Chilington: Chanctonbury Press. Jenster P. V. and Søilen K. S. (2009). Market Intelligence: Building Strategic
In-sight, Copenhagen: Copenhagen Business School Press.
Kalman J. C. and Rhenman E. (1975). The Role of Management Games in Educa-tion and Research, In Greenblat, Cathy S. and Duke, Richard D. ed.,
Gaming-Simulation: Rationale, Design and Application, New York: Sage Publication,
pp. 233-269.
Kotler P. and Singh R. (2001). Marketing warfare in the 1980s, Marketing:
criti-cal perspectives on business and management, 3: 411-428.
Kurtz J. (2003). Business wargaming: simulations guide crucial strategy deci-sions, Strategy & Leadership, 31(6): 12 – 21.
Kurtz J. and Schuler D. K. (2008). Competitive intelligence at Procter & Gamble: A case study in trade secrets, Journal of Legal Studies Education, 21(1): 109-149.
Lundvall B.-A. (2010). National Systems of Innovation: Toward a Theory of
In-novation and Interactive Learning, London: Anthem Press.
Oriesek D. F. and Schwarz J. O. (2008). Business Wargaming: Securing
Corpo-rate Value, Hampshire: Gower House.
Patrick S. B. (1977). The history of wargaming, In Berg, Richard H., Ryer, Robert
J. and Simonsen Redmond A. ed, Wargame design: The History, Production and Use of Conflict Simulation Games, Strategy & Tactics staff study, 2,
Simu-lations Publications Incorporated. New York, pp. 1-40.
Pyzdek T. and Keller P. A. (2003). The Six Sigma handbook: a complete guide
for green belts, black belts, and managers at all levels, New York McGraw-Hill.
Ries A and Trout J. (2006). Marketing Warfare, New York: McGraw-Hill.
Schwartz R. G. and Teach R. D. (2002). The E-commerce game: as strategic business board game, Developments in Business and Experiential, 29: 195-207.
Simonsen R. A. (1977). Image and System: Graphics and Physical Systems De-sign, In Berg, Richard H., Ryer, Robert J. and Simonsen Redmond A. ed,
War-game design: The History, Production and Use of Conflict Simulation Games,
Strategy & Tactics staff study, 2, Simulations Publications Incorporated. New York, pp. 56-88.
Trot P. (2008). Innovation management and new product development, Edin-burgh: Prentice Hall.
Tyagi C.L. and Kumar A. (2004). Sales Management, New Delhi: Atlantic Pub-lishers and Distributors.
Weaver C. N. (1991). TQM: a step-by-step guide to implementation, Milwaukee: ASQC Quality Press.