SYNTHESIS, CHARACTERIZATION OF NEW HYBRID MATERIAL BASED ON POLYPYRROLE-TETRATHIAFULVALENE AND ZINC OXIDE
SihamTiaouinine1*, Lakhemici Kaboub1,2, Djamel-Eddine Hamza2, Fatima Setifi2, Amor Azizi2 and AK. Gouasmia1
1
Laboratoire des matériaux organiques et Hétérochimie, Université de Tébessa
2
Laboratoire de Chimie, Ingénierie Moléculaire et Nanostructure, Université de Sétif-1
ABSTRACT
Her we report a preliminary study of material witch an organic material is combined with an inorganic material to yield a solar cell. ZnO was deposited electrochemically onto glass/ITO form aqueous solutions containing KNO3 and Zn (NO3)2. New molecule TTF donor
(TTF: tetrathiafulvalene) containing pyrrole has been synthesized and its electron-donating ability determined by cyclic voltammetry. Then, Polypyrrole -TTF films have been grown on ZnO substrates from an acetonitrile solution of TBAPF6- by the electropolymerisation
technique. The chemical composition of the ZnO/Polypyroole-TTF films was determined by UV and IR spectroscopy. The morphology of the prepared film layers were detrmined using the AFM technique. Lastly, the band gap of the heterojunction, between the HOMO of the donor material Polypyrrole-TTF and the LUMO of the of the acceptor layer (ZnO) were estimated by UV-vis absorption spectra. This study shows a decrease in the gap energy value from 3.88 to 3.55 eV proved the interaction between the hybridbilayer.
Keywords: Polypyrrole -TTF films, hybrid material, photovolyaique .
Author Correspondence, e-mail: sihamtiaouinine@yahoo.fr 1. INTRODUCTION
Photovoltaics (PV) is a solar power technology that uses solar cells to convert incident sunlight directly into electricity. By now, PV technology has established itself as one of the best solutions to bring forth flexible and long-term solutions for rural electrification in the
poorest areas of the world. Hybrid solar cell (HSC) is the combination of both organic and inorganic semiconductors. The HSC is also known as dye- sensitized solar cell which has an interesting low cost alternatives to conventional solar cell [1]. HSC combine advantages of both organic and inorganic semiconductors. Hybrid photovoltaics have organic materials that consist of conjugated polymers that absorb light as the donor and transport holes [2]. Organic semiconductor is used to describe organic materials (conjugated oligomers or polymers) that possess the ability of transporting charge carriers and have been studied since the 1950s [3]. Holes and electrons in πorbitals are the typical charge carriers in organic semiconductors. Charge transport typically depends on the ability of the charge carriers to move from one molecule to another, which depends on the energy gap between highest occupied molecular orbital (HOMO) and lowest unoccupied molecular orbital (LUMO) levels. These materials are either based on oligomers or on polymers such as polypyrrole. The hybrid photovoltaic devices have a potential for not only low-cost by roll-to-roll processing but also for scalable solar power conversion. In hybrid solar cells, an organic material is mixed with a high electron transport material to form the photoactive layer [4].
The two materials are assembled together in a heterojunction-type photoactive layer, which can have greater power conversion efficiency than a single material [5]. In this preliminary study, we report the elaboration of material for photovoltaic applications based on p-n junctions with ZnO as the n-type material and polypyrrole-tetrathiafulvalene as p-type material.
Our idea was based on the improvement of the character (p) of the polypyrrole. Such a result can be attained by introducing, on the pyrrole ring, a donor molecule tetrathiafulvalene (TTF)[6]. Able to enhance the power electrodonor and the transport properties of the system. In this study, zinc oxide (ZnO) layers deposited at different times (50,100 and 150 s) were developed in potentiostatic mode by imposing an applied potential (-1.3V) between the working electrode (ITO) and the electrode reference (ECS). The temperature of the electrolyte was maintained at 75 °C. The choice of the deposition potential obtained by cyclic 2. EXPERIMENTAL SECTION
voltammetry experiments.Fifure1 shows the chronoamperometric curves recorded during the electroplating of the ZnO layers. This figure indicates that the transients obtained have an identical appearance. It also exhibits a typical transient current response of a three-dimensional electrochemical growth process [7-8-9].
At first, in the first moments of deposition, the current decreasessuddenly. This current corresponds to that of the charge of the double layer at the interface ITO /electrolyte and at the time necessary for the formation of the first germs on the sitesof the surface. Then the current increases to reach a maximum imax for a timeequal to tmax. This part corresponds to the
growth of the seeds of ZnO[10]. Then, thecurrent decreases to a limit that is imposed by the diffusion of ions through thesolution to the surface of the electrode.
0 10 20 30 40 50 60 70 80 90 100 110 120 130 140 150 160 -4.0 -3.8 -3.6 -3.4 -3.2 -3.0 -2.8 -2.6 -2.4 -2.2 -2.0 -1.8 -1.6 -1.4 -1.2 -1.0 -0.8 i(mA/ cm 2) t(s) t=50 s t=100 s t=150 s
Fig.1. Chronoamperograms during deposition of ZnO on the surface ITO at different times
2.2 Morphological characterization by AFM:
This measurement technique also makes it possible to visualize the surface of the ZnO layers, but quantitatively. That is, it is possible to obtain the average value rms (Root Mean Square) of the surface roughness of these layers. This value (R.M.S) is in fact the geometric mean of the heights of all the points of the surface scanned by the microscope.
In order to compare the topography of ZnO layers electrodeposited at different times, we measured their roughnesses. The values of the quadratic mean roughness of a surface known by the English abbreviation "Root Mean Square" (RMS). From this figure, it is clear that the surface roughness of the deposits is affected by time. It is low for the sample of ZnO
deposited at 50 s with an RMS equal to 10.2 nm. Thus, it is observed that the increase in the deposition time also increases the value of the roughness up to 10.9 nm for 100 s and 13.2 nm for 150 s.
a) b) c)
RMS = 10.2 nm RMS = 10.9nm RMS = 13.2 nm
Fig.2. 2D and 3D AFM images of ZnO layers deposited at different times:
a) 50s, b) 100s, c) 150s. The deposition potential and temperature are set at -1.3 V and 75 ° C, respectively.
2.3 UV-Vis optical characterization:
In this section we study by optical spectroscopy the effect of deposition time on the optical properties of the ZnO layers. The optical characterization was carried out with a UV-1800 spectrophotometer (SHIMADZU). The use of the different spectra allows us to calculate the optical gap. Fgure 3 shows the transmission spectra, in the range 200 to 800 nm, for ZnO depositions prepared at different times in a [KNO3] = 1M, [Zn (NO3) 2] = 0.1M solution.
50s 100
s
150 s
300 400 500 600 700 800 0 10 20 30 40 50 60 70 80 90 100 50 s 100 s 150 s T ra ns m it ta nc e (% ) Wavenumber (cm-1) ZnO E=-1.3V
Fig.3. Optical transmission spectrum of ZnO deposited at different times
Although the general pattern of the spectra is identical, the optical transmission of the deposits increases with the decrease in time. A sharp fall in transmission is observed at ~ 300 nm. This indicates that the ZnO layers absorb light at wavelengths below this value [11]. The value of the transmission is of the order of 35 to 65%.
The gap energy of the ZnO layers was determined by extrapolation from the plot of (αhν)2 as a function of hν[14]. The gap energies of the ZnO deposited at different times are shown in fig. 4. 2 3 4 0 100 200 300 ( hv ) 2 (a rb ,u ni ts ) hv (eV) ZnO t=50 s ZnO t=100 s ZnO t=150 s 3.46 eV 3.70 eV 3.88 eV
Figure 4 shows the variation of the energy of the optical gap (Eg) as a function of the time for producing the ZnO layer. This figure shows a noticeable decrease in the energy of the optical gap which increases from 3.88 to 3.46 eV when the electrodeposition time increases from 50 to 150s. Transmissions and ZnO gap energies deposited at different times are shown in Table I.
Table I: Evolution of the optical parameters of zinc oxide electrodeposited on ITO at different times
Time (s) Transmission (%) Energy gap (eV)
50 65 3.88
100 60 3.70
150 40 3.46
2.4 Electrodeposition of the p-type organic donor layer Tetrathiafulvalene-Pyrrole
2.4.1 Synthesis of the precursor TTF containing a pyrrole group 2
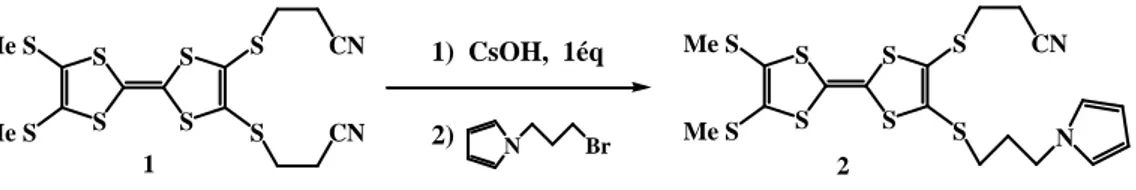
The bis-cyanoethylthio-TTF 1 compound previously synthesized is converted, by the action of one equivalent of CsOH and an excess of pyrrolicbromopropane, into product 2[12] .
S S S S S S Me S Me S CN CN 1) CsOH, 1éq 2) N Br S S S S S S Me S Me S CN N 1 2
Scheme 1: Synthesis of precursor TTF containing a pyrrole group 2
2.4.2. Characterization by infrared (IR) spectroscopy:
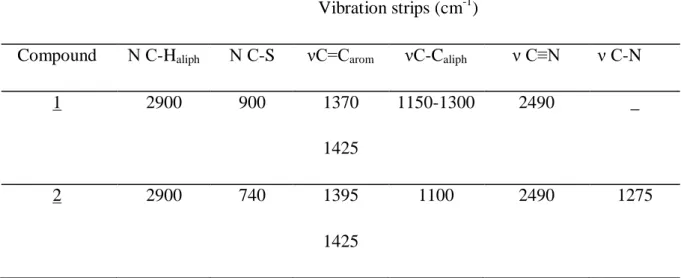
The infrared spectrum of compound 1 has a strong-medium band at 1370 cm-1 and a medium-low band at 1425 cm-1 due to the elongation vibration of the aromatic ring (C = C) of the ring,
a band of valence vibration (CH) located at 2900 cm-1, a medium-strong band located at 2490 cm-1 attributed to the valence vibration of (C≡N) is found and finally an average band at 900 cm-1 coming (C-S) band. The infrared spectrum of product 2: illustrates an average band located at 1275 cm-1 due to the elongation vibration of the bond (CN) characteristic of the pyrrole group grafted onto the TTF derivative, two elongation vibration band of the bond (C-S) at 740 cm -1, finally a weak band at 1100 cm-1 of the (C-C) band.
Table II: The main vibrations for the two synthesized compounds.
2.5 Elaboration of mixed heterojunction bilayers ZnO/ TTF-Pyr
We wanted to develop a mixed bilayer (ZnO /TTF-Pyr) material with heterojunction. It appeared very interesting to deposit our organic part (TTF-Pyr) on the previously prepared ZnO layers as a function of time. Indeed, the poly-TTF-Pyr films were electrode posited on ZnO by successive sweeping between -1.6 and + 1.6V / SCE in acetonitrile containing 10-1M TBAPF6- and 10-3M of the TTF-Pyr monomer. This successive scan (40 cycles) shows the
growth of the polypyrrole films on the ZnO layer.
S S S S S S Me S Me S CN N 2 S S S S S S Me S Me S CN N Electropolymerization n
Scheme 2: Electropolymerization of Pyr-TTF Vibration strips (cm-1)
Compound Ν C-Haliph Ν C-S νC=Carom νC-Caliph ν C≡N ν C-N
1 2900 900 1370 1425 1150-1300 2490 _ 2 2900 740 1395 1425 1100 2490 1275
Fig 5. Electropolymerization of the monomer TTF-Pyr on ZnO obtained after 40 cycles in a solution of acetonitrile CH3CN, TBAPF6-10-1M,
TTF-Pyr 10-3 M at a rate of 100 mV / s.
2.6 Characterization by Infrared Spectroscopy (IR)
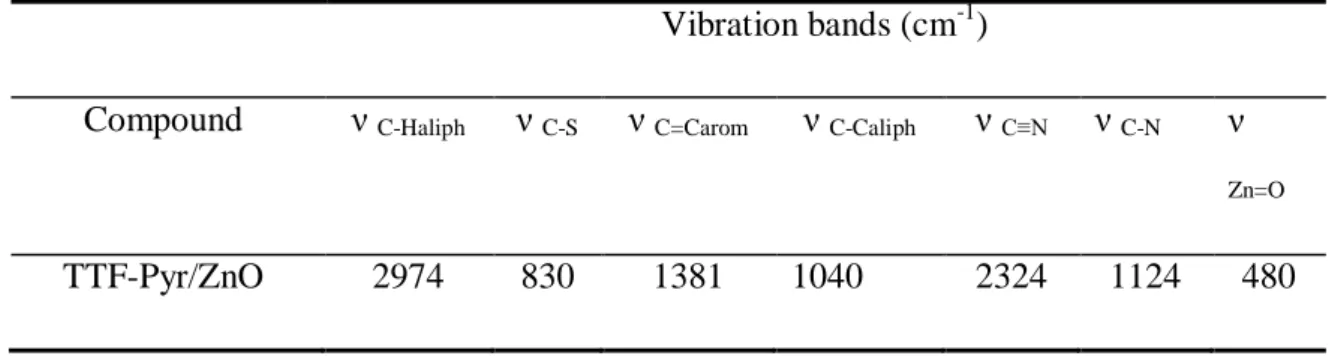
We characterized the TTF-Pyr / ZnO bilayer by infrared spectroscopy. The IR spectrum shows a band marked at 2324 cm-1 due to the vibration of (C≡N) and a fine, intense band at 480 cm-1 attributed to (Zn=O) [13]. These absorptions corroborate the presence of the compounds constituting the organic / inorganic bilayer. All the vibration bands of this material are grouped in Table III.
Table III: The main vibrations of the electro-deposited material
Vibration bands (cm-1)
Compound ν C-Haliph ν C-S ν C=Carom ν C-Caliph ν C≡N ν C-N ν Zn=O
TTF-Pyr/ZnO 2974 830 1381 1040 2324 1124 480
2.7 Morphological characterization by AFM:
Topographic characteristics (roughness, morphology) were carried out by atomic force microscopy (AFM). Roughness can be characterized by the average height of the irregularities. A roughness criterion commonly used is a statistical criterion called rms
representing the mean square deviation of the profile. The 2D and 3D AFM images of the TTF-pyr / ZnO / ITO bilayers reveal a marked increase in roughness due to the formation of new polymer layers which have masked the ZnO layer. Figure 6 shows the different AFM images.
RMS=24.2 nm RMS=20.2 nm RMS=15.6nm
Fig 6. 2D and 3D AFM images of TTF-pyr layer deposited on a ZnO layer: (ZnO = 50s,100s, 150s
2.8 Evaluation of the energy gap by UV-Vis
The optical characterization was obtained with a UV-1800 spectrophotometer (SHIMADZU). The use of the different spectra allows us to calculate the optical gap. Figure 7 shows
50s
transmission spectra in a range of 200 to 800 nm for PolyPyr-TTF/ ZnO deposits. 300 400 500 600 700 800 0 10 20 30 40 50 60 ZnO=50 s ZnO=100 s ZnO=150 s Tr an sm ittan ce (% ) Wavenumber (cm-1 ) TTF-pyr/ZnO
Fig.7. Transmission spectra of the PolyPyr-TTF/ ZnO layers.
In this figure 7 we have been interested in the variations of the transmittance as a function of the wavelength. The recording of the curves at different electrodeposition times shows a clear difference in the values of the transmittances as compared to the pure ZnO layers (Fig. 3), this makes it possible to suggest the modification of the surface areas by a news organic layers. The gap energy of the TTF-pyr / ZnO layers was determined by extrapolation from the plot of (αhν) 2 as a function of hν[14]. The gap energies are shown in figure 8.
1.5 2.0 2.5 3.0 3.5 4.0 4.5 5.0 TTF-pyr/ZnO Eg = 3,55 eV Eg = 3,78 eV ( hv ) 2 (a rb ,u ni ts ) hv (eV) ZnO=50s ZnO=100s ZnO=150s Eg = 3,9 eV
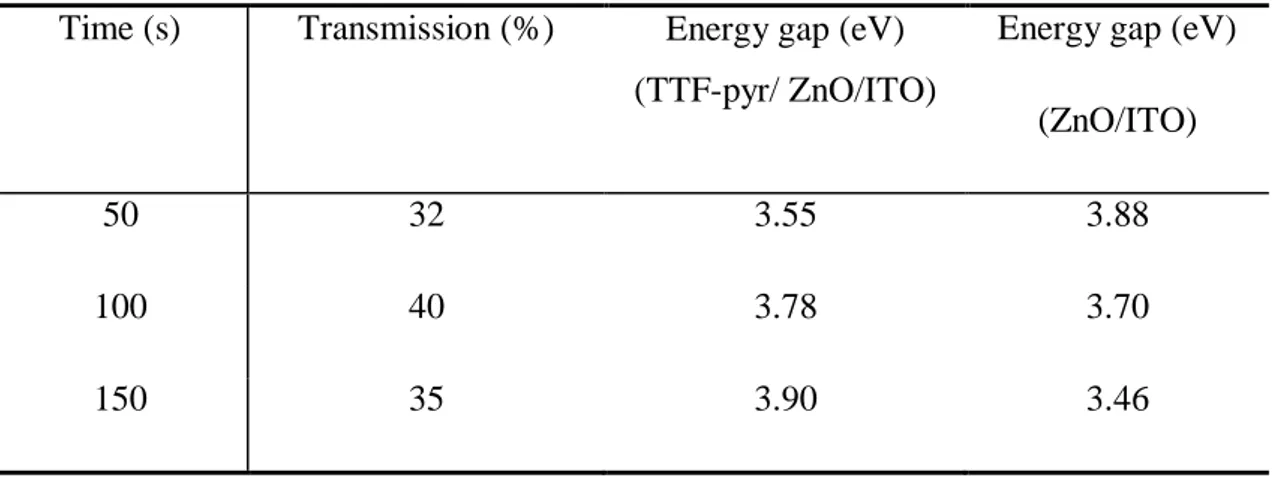
The analysis of these results (TableIV) revealed that the organic/ inorganic hybrid materials have gap energies ranging from 3.55 to 3.90 eV. There is also an increase in gap energies with respect to the inorganic layers ZnO except for the compound resulting from the nucleation of the ZnO at 50 s which shows a decrease in the gap energy value from 3.88 to 3.55 eV. This is most probably explained by the strong adsorption of the donor layer (TTF-Pyr) on the surface of the acceptor layer ZnO on the one hand and by the interconnection of the two layers on the other hand. So it seems interesting to us to exploit the inorganic compounds (ZnO) from the electroplating at 50s.
Table IV. The transmission and gap energies values of the TTF-pyr / ZnO bilayer
Time (s) Transmission (%) Energy gap (eV) (TTF-pyr/ ZnO/ITO)
Energy gap (eV) (ZnO/ITO)
50 32 3.55 3.88
100 40 3.78 3.70
150 35 3.90 3.46
3. Conclusions
In conclusion, we have elaborated a hybrid inorganic/organic semiconductor integrating new polymer:polypyrroleTTF as the electron donor and ZnO as the acceptor. The thin layers were successfully prepared by electrochemical deposition. Furthermore, this material may provide a very promising candidate for hybrid photovoltaic systems. The spectroscopic and morphological methods (IR, UV and AFM) are exploited to characterize the different materials obtained.The analysis of the gap energy results, estimated by UV methods, revealed the decrease in the gap energy (3.55 eV) for the hybrid organic/inorganic material as compared to the pure device ZnO (3.88eV).This interesting value indicates that there is astrong interaction between the bilayer of the hybrid organic / inorganic.
4. References
[1] L. S. Mende, U. Bach, R. H. Baker, T. Horiuchi, H. Miura, S. Ito, and S.Uchida, “Organic dye for highly efficient solid-state dye-sensitizedsolar cells,” Advanced Materials, vol. 17, no. 7, pp. 813-815, 2005.
[2] D. J. Milliron, I. Gur, and A. Alivisatos, “Hybrid organic–nanocrystal solar cells,” MRS
Bulletin, vol. 30, pp. 41–44, 2005.
[3] M. Pope and C. E. Swenberg, Electronic Processes in Organic Crystals and Polymers, 2nd ed., New York: Oxford University Press,1999.
[4] S. E. Shaheen, D. S. Ginley, and G. E. Jabbour, “Organic–based photovoltaics,” MRS
Bulletin, vol. 30, 2005, pp. 10.
[5] B. R. Saunders and M. L. Turner, “Nanoparticle-polymer photovoltaic cells,” Advances in
Colloid and Interface Science, vol. 138, no. 1, pp. 1–23, 2008.
[6]Marta Riba-Moliner, Andrés Gómez-Rodríguez, David B. Amabilino, JosepPuigmartí-Luis, Arántzazu González-Campo
Functional supramolecular tetrathiafulvalene-based films with mixed valences states
Polymer(2016), doi:10.1016/j.polymer.2016.09.039[7]B. Trémillon, Electrochimie
Analytique et Réaction en Solution, Tome 2, edition Masson, Paris (1993)[8] R. Greef, R. Peat, L.M. Peter, et al.,"Electrocrystallisation in Instrumental Methods
[9] B. Scharifker, G. Hills, Electrochim. Acta., 28 (1983) 879. [10] T. Pauporte, D. Lincot, Electrochim. Acta., 45 (2000) 3345.[11] C. Lévy-Clément, R. Tena-Zaera, M.A. Ryan, A. Katty, G. Hodes, Adv. Mater., 17 (2005) 1512
[12]L. Kaboub, A.-K.Gouasmia, J.-P.Legrosb, E. Harted, C. Coulond, J.M. Fabre Copper(II) complexes containing tetrathiafulvalene substituted by a bipyridineligand: Synthesis, X-ray diffraction and EPR characterizations Synthetic Metals 159 (2009) 2075–2080
[13] Alan K. T. Lau, Effect of Polymers (PEG and PVP) on Sol-Gel Synthesis of Microsized ZincOxide, Journal of Nanomaterials Article ID 362175, 7(2013).
[14] SvenR hle,* Assaf Y. Anderson, Hannah-NoaBarad, Benjamin Kupfer, Yaniv Bouhadana, Eli Rosh-Hodesh, and ArieZaban All-Oxide Photovoltaics J. Phys. Chem. Lett. 2012, 3, 3755−3764