HAL Id: hal-01087291
https://hal-mines-paristech.archives-ouvertes.fr/hal-01087291
Submitted on 25 Nov 2014
HAL is a multi-disciplinary open access
archive for the deposit and dissemination of
sci-entific research documents, whether they are
pub-lished or not. The documents may come from
teaching and research institutions in France or
abroad, or from public or private research centers.
L’archive ouverte pluridisciplinaire HAL, est
destinée au dépôt et à la diffusion de documents
scientifiques de niveau recherche, publiés ou non,
émanant des établissements d’enseignement et de
recherche français ou étrangers, des laboratoires
publics ou privés.
Distributed under a Creative Commons Attribution| 4.0 International License
Improving HelioClim-3 estimates of surface solar
irradiance using the McClear clear-sky model and recent
advances in atmosphere composition
Zhipeng Qu, Benoît Gschwind, Mireille Lefèvre, Lucien Wald
To cite this version:
Zhipeng Qu, Benoît Gschwind, Mireille Lefèvre, Lucien Wald. Improving HelioClim-3 estimates of
surface solar irradiance using the McClear clear-sky model and recent advances in atmosphere
compo-sition. Atmospheric Measurement Techniques, European Geosciences Union, 2014, 7, pp.3927 - 3933.
�10.5194/amt-7-3927-2014�. �hal-01087291�
www.atmos-meas-tech.net/7/3927/2014/ doi:10.5194/amt-7-3927-2014
© Author(s) 2014. CC Attribution 3.0 License.
Improving HelioClim-3 estimates of surface solar irradiance using
the McClear clear-sky model and recent advances
in atmosphere composition
Z. Qu, B. Gschwind, M. Lefevre, and L. WaldMINES ParisTech, PSL Research University, O.I.E. Centre for Observation, Impacts, Energy, CS 10207, rue Claude Daunesse, 06904 Sophia Antipolis CEDEX, France
Correspondence to: L. Wald ([email protected])
Received: 8 June 2014 – Published in Atmos. Meas. Tech. Discuss.: 29 July 2014 Revised: 7 October 2014 – Accepted: 23 October 2014 – Published: 25 November 2014
Abstract. The HelioClim-3 database (HC3v3) provides
records of surface solar irradiation every 15 min, estimated by processing images from the geostationary meteorologi-cal Meteosat satellites using climatologimeteorologi-cal data sets of the atmospheric Linke turbidity factor. This technical note pro-poses a method to improve a posteriori HC3v3 by combining it with data records of the irradiation under clear skies from the new McClear clear-sky model, whose inputs are the ad-vanced global aerosol property forecasts and physically con-sistent total column content in water vapour and ozone pro-duced by the MACC (Monitoring Atmosphere Composition and Climate) projects. The method is validated by compar-ison with a series of ground measurements for 15 min and 1 h for 6 stations and for daily irradiation for 23 stations. The correlation coefficient is large, greater than respectively 0.92, 0.94, and 0.97, for 15 min, 1 h and daily irradiation. The bias ranges from −4 to 4 % of the mean observed irradiation for most sites. The relative root mean square difference (RMSD) varies between 14 and 38 % for 15 min, 12 and 33 % for 1 h irradiation, and 6 and 20 % for daily irradiation. As a rule of thumb, the farther from the nadir of the Meteosat satellite located at latitude 0◦ and longitude 0◦, and the greater the occurrence of fragmented cloud cover, the greater the rela-tive RMSD. The method improves HC3v3 in most cases, and with no degradation in the others. A systematic correction of HC3v3 with McClear is recommended.
1 Introduction
The downwelling solar irradiance observed at ground level on horizontal surfaces and integrated over the whole spec-trum (total irradiance) is called surface solar irradiance (SSI). It is the sum of the direct irradiance from the direction of the sun and the diffuse from the rest of the sky vault, and is also called the global irradiance. The SSI is an essential climate variable (ECV) as established by the Global Climate Observ-ing System in August 2010 (GCOS, 2013). Knowledge of the SSI and its geographical distribution is of prime importance for numerous domains where SSI plays a major role, as e.g. in weather, climate, biomass, and energy.
The HelioClim project is an ambitious initiative of MINES ParisTech launched in 1997 to increase knowledge about the SSI and to offer SSI values for any site, any instant over a large geographical area, and a long period of time, to a wide audience (Blanc et al., 2011). The project comprises several databases that cover Europe, Africa and the Atlantic Ocean. The HelioClim-1 (HC1) database offers daily means of the global SSI for the period 1985–2005. The HelioClim-3 (HC3) database contains 15 min values of the global SSI. It was created in 2004, and is updated daily from images taken by the Meteosat Second Generation satellites. Its recent im-provements have taken place in the framework of the Euro-pean MACC and MACC-II (Monitoring Atmosphere position and Climate) projects funded by the European Com-mission. The HelioClim-4 database is under creation in these MACC projects. It will contain 15 min values of the global, direct and diffuse components of the SSI with a daily update.
3928 Z. Qu et al.: Improving HelioClim-3 estimates of surface solar irradiance
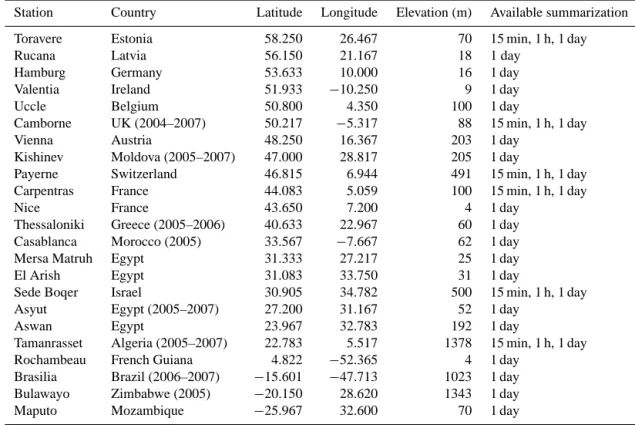
Table 1. List of stations, ordered from north to south. Data from 2005 to 2009, except if stated otherwise.
Station Country Latitude Longitude Elevation (m) Available summarization
Toravere Estonia 58.250 26.467 70 15 min, 1 h, 1 day
Rucana Latvia 56.150 21.167 18 1 day
Hamburg Germany 53.633 10.000 16 1 day
Valentia Ireland 51.933 −10.250 9 1 day
Uccle Belgium 50.800 4.350 100 1 day
Camborne UK (2004–2007) 50.217 −5.317 88 15 min, 1 h, 1 day
Vienna Austria 48.250 16.367 203 1 day
Kishinev Moldova (2005–2007) 47.000 28.817 205 1 day
Payerne Switzerland 46.815 6.944 491 15 min, 1 h, 1 day
Carpentras France 44.083 5.059 100 15 min, 1 h, 1 day
Nice France 43.650 7.200 4 1 day
Thessaloniki Greece (2005–2006) 40.633 22.967 60 1 day
Casablanca Morocco (2005) 33.567 −7.667 62 1 day
Mersa Matruh Egypt 31.333 27.217 25 1 day
El Arish Egypt 31.083 33.750 31 1 day
Sede Boqer Israel 30.905 34.782 500 15 min, 1 h, 1 day
Asyut Egypt (2005–2007) 27.200 31.167 52 1 day
Aswan Egypt 23.967 32.783 192 1 day
Tamanrasset Algeria (2005–2007) 22.783 5.517 1378 15 min, 1 h, 1 day
Rochambeau French Guiana 4.822 −52.365 4 1 day
Brasilia Brazil (2006–2007) −15.601 −47.713 1023 1 day
Bulawayo Zimbabwe (2005) −20.150 28.620 1343 1 day
Maputo Mozambique −25.967 32.600 70 1 day
Table 2. Comparison of correlation coefficients for 15 min irradia-tion and clearness index. Best values are in bold.
Station IHC3v3 IHC3McClear KTHC3v3 KTMcClear Toravere 0.921 0.924 0.765 0.773 Camborne 0.950 0.952 0.829 0.830 Payerne 0.958 0.959 0.846 0.853 Carpentras 0.970 0.972 0.842 0.845 Sede Boqer 0.973 0.975 0.829 0.846 Tamanrasset 0.965 0.970 0.824 0.830
The HelioClim databases are available on the Internet through the SoDa website (http://www.soda-pro.com), and support research and business by providing data of known quality on surface solar irradiance. More than 100 000 re-quests were made in 2012 to HC1 by users and more than 2 million to HC3, demonstrating the large use of HelioClim databases. Lefevre et al. (2014) performed a review of the scientific literature citing HelioClim, and found many exam-ples of usages in various domains: oceanography, climate, energy production, life cycle analysis, agriculture, ecology, human health, and air quality.
The HC1 and HC3 databases are derived from images of the Meteosat series of satellites using the Heliosat-2 method (Rigollier et al., 2004). The Heliosat-2 method needs a so-called clear-sky model to predict the SSI that should be ob-served under a clear sky. The European Solar Radiation Atlas
(ESRA) clear-sky model (Rigollier et al., 2000) modified by Geiger et al. (2002) was selected, with the climatology of the Linke turbidity factor from Remund et al. (2003) as in-put. The Linke turbidity factor is a convenient approximation for modelling the atmospheric absorption and scattering of the solar radiation under clear skies. The climatology of Re-mund et al. (2003) comprises 12 maps, one per month, cov-ering the world with cells of 5′of arc angle in size. The use
of this climatology is one of the drawbacks of the HC1 and HC3, and especially HC3, whose high temporal resolution (15 min) is in principle well suited for monitoring and repro-ducing rapid changes in SSI. Aerosols have different scat-tering and absorbing properties according to their type and the spatial and temporal heterogeneity of their number, size, chemical composition, and shape (Elias and Roujean, 2008; Xu et al., 2011). These properties as well as total column con-tent in water vapour and ozone may vary rapidly within a day or from day to day, thus influencing the SSI under clear skies. Climatology cannot account for such changes, and HC3 es-timates are often underestimated in the case of clear skies (Lefèvre et al., 2013). In addition, the Linke turbidity factor has a drawback inherent to its definition. It is a single value that summarises the effects of many variables. Simultaneous changes in these variables induce changes in irradiation un-der clear-sky conditions that may not be reflected in the Linke turbidity factor and therefore not in the irradiation estimated by the ESRA model.
The MACC and MACC-II projects are preparing the operational provision of global aerosol property analyses and forecasts together with physically consistent total col-umn content in water vapour and ozone available every 3 h (Benedetti et al., 2011; Kaiser et al., 2012; Peuch et al., 2009). Up to now, a multi-annual reanalysis data set has been provided, and is used here (Inness et al., 2013). Such infor-mation has not been available so far from any operational numerical weather prediction (NWP) centre. A new clear-sky model called McClear has been developed to exploit this new input data source for estimating the direct and global SSI (Lefèvre et al., 2013). Validation of McClear outputs against beam and global irradiances measured at 1 min by BSRN sta-tions in the world reveals satisfactory results. Good correla-tion is attained; bias, standard deviacorrela-tion and root mean square error (RMSE) are small (Lefèvre et al., 2013).
How can such advanced data sets on aerosol properties, water vapour and ozone be exploited to bring a significant improvement to the widely used HC3 without re-factoring the Heliosat-2 method and re-processing all Meteosat images since 2004? If this is possible, the dynamics of the aerosol properties, water vapour and ozone would be taken into ac-count in the enhanced HC3, thus possibly yielding better esti-mates under clear-sky conditions. This technical note investi-gates the changes brought to HC3 in an a posteriori manner, i.e. by applying post-processing to the HC3 estimates, and assesses the benefit compared to the original HC3.
2 Data sets and method
The method is the following. A standard request to HC3v3 (version 3 of HC3) for a given site integrated over a given period, called summarization, e.g. 1 h or 1 day, yields several data, including the global SSI IHC3v3, that under clear-sky condition IESRA, and I0the irradiance received on a horizon-tal surface at the top of atmosphere. The clear-sky index Kc is computed:
Kc = IHC3v3/ IESRA. (1)
The McClear model may be invoked through the SoDa website. It yields the clear-sky value IMcClear for the re-quested summarization and site, and the new version of the SSI IHC3McClearis obtained:
IHC3McClear=KcIMcClear. (2)
A series of ground measurements of surface solar irradi-ation Igroundwas assembled and serves as a reference in the comparison of IHC3v3and IHC3McClear. Comparison was per-formed for the period 2005–2009. Measurements were col-lected from 23 stations located in the field of view of the Meteosat satellite.
Measurements of 15 min, hourly, and daily irradiation were collected at six stations of the BSRN (Baseline Surface
Radiation Network). BSRN stations record global irradiation Igroundas well as its direct B and diffuse D components ev-ery minute. Roesch et al. (2011) recommend keeping only Igroundmeasurements that obey the following constraints:
if θS≤75◦,1.08 ≥ (D + B)/Iground≥0.92 (3) if θS>75◦,1.15 ≥ (D + B)/Iground≥0.85, (4) where θSis the solar zenith angle. Roesch et al. (2011) note a percentage of missing data of 4 % for global irradiance and 13 % for direct irradiance for all studied BSRN data. The original measurements passing Eq. (3) are summed up to yield 15 min, hourly and daily irradiation, provided a sum is made with at least 90 % valid measurements, e.g. 54 valid 1 min data to yield 1 h irradiation.
Measurements of daily irradiation were collected for an-other set of 17 stations of the meteorological networks archived in the WRDC (World Radiation Data Center) and available through the WRDC website. Table 1 lists the 23 stations that have been selected in order to represent various climates in Europe, Africa and tropical South America.
The clearness index KT, also called the global transmis-sivity of the atmosphere, or atmospheric transmittance, or at-mospheric transmission, is defined as
KT = Iground/ I0. (5)
For clear skies, KT is close to 0.8, and is close to 0 for overcast skies. This index has the advantages of removing most of the effects due to sun position and indicating the type of sky. While irradiation for clear-sky conditions but a large solar zenith angle may be similar to that under cloudy condi-tions but with a low solar zenith angle, the clearness indices will be different. The clearness index is useful for analysing causes of discrepancies between the data sets. The clearness indices KTHC3v3and KTMcClearare computed:
KTHC3v3=IHC3v3/ I0 (6)
KTMcClear=IHC3McClear/ I0. (7)
The irradiation IHC3McClear, and hence the clearness index KTMcClear, are computed for each summarization: 15 min, 1 h, and 1 day:
(IHC3McClear)hour=
[(IHC3v3)hour(IHC3McClear)hour]/ (IESRA)hour (8) (IHC3McClear)day=
[(IHC3v3)day(IHC3McClear)day]/ (IESRA)day, (9)
where the quantities (IHC3McClear)hour, (IHC3v3)hour, (IHC3McClear)hour, (IESRA)hour, (IHC3McClear)day, (IHC3v3)day, (IHC3McClear)day, and (IESRA)day are directly retrieved from the SoDa website. Another approach could be to compute IHC3McClear every 15 min, and then to perform the summa-rization for 1 h or 1 day, though this is less practical for the many users of the SoDa website.
3930 Z. Qu et al.: Improving HelioClim-3 estimates of surface solar irradiance
Table 3. Comparison of differences for 15 min irradiation, in J cm−2. The mean value is obtained from the measurements. The first value is IHC3v3and the second is IHC3McClear, with the best value in bold. Bias and RMSD of IHC3McClearrelative to the mean irradiation are given in brackets.
Station Mean 15 min irradiation
Bias Standard deviation RMSD
Toravere 20.5 0.3 / −0.1 (0 %) 7.9 / 7.8 7.9 / 7.8 (38 %) Camborne 23.2 0.4 / 0.5 (2 %) 6.8 / 6.8 6.8 / 6.8 (29 %) Payerne 25.5 −1.6 / −0.3 (−1 %) 6.8 / 6.8 7.0 / 6.8 (27 %) Carpentras 31.9 0.6 / 0.6 (2 %) 6.3 / 6.1 6.4 / 6.2 (19 %) Sede Boqer 47.6 −3.0 / −1.8 (−4 %) 6.5 / 6.4 7.1 / 6.6 (14 %) Tamanrasset 47.6 1.3 / 1.7 (4 %) 8.2 / 7.7 8.3 / 7.8 (16 %)
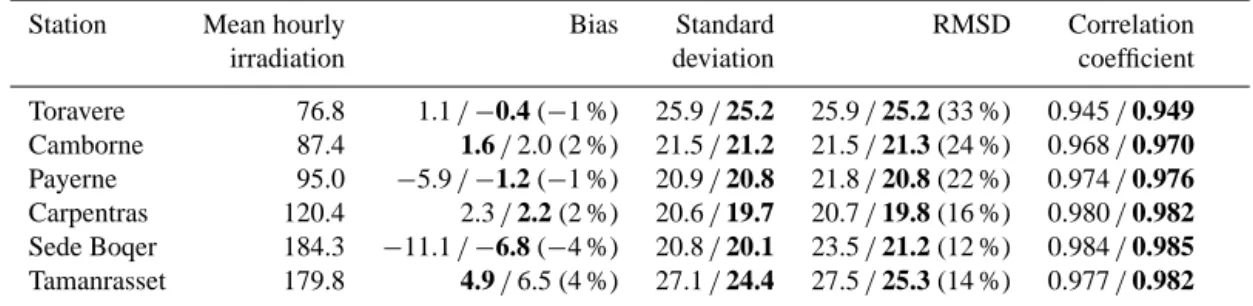
Table 4. Comparison of differences for hourly irradiation, in J cm−2. The mean value is obtained from the measurements. The first value is IHC3v3and the second is IHC3McClear, with the best value in bold. Bias and RMSD of IHC3McClearrelative to the mean irradiation are given in brackets.
Station Mean hourly Bias Standard RMSD Correlation
irradiation deviation coefficient
Toravere 76.8 1.1 / −0.4 (−1 %) 25.9 / 25.2 25.9 / 25.2 (33 %) 0.945 / 0.949 Camborne 87.4 1.6 / 2.0 (2 %) 21.5 / 21.2 21.5 / 21.3 (24 %) 0.968 / 0.970 Payerne 95.0 −5.9 / −1.2 (−1 %) 20.9 / 20.8 21.8 / 20.8 (22 %) 0.974 / 0.976 Carpentras 120.4 2.3 / 2.2 (2 %) 20.6 / 19.7 20.7 / 19.8 (16 %) 0.980 / 0.982 Sede Boqer 184.3 −11.1 / −6.8 (−4 %) 20.8 / 20.1 23.5 / 21.2 (12 %) 0.984 / 0.985 Tamanrasset 179.8 4.9 / 6.5 (4 %) 27.1 / 24.4 27.5 / 25.3 (14 %) 0.977 / 0.982
For each summarization, the deviations (IHC3v3−Iground), (IHC3McClear−Iground), (KTHC3v3−KTground) and (KTHC3McClear−KTground) are computed and synthe-sised by the bias, the standard deviation, the root mean square difference (RMSD), and the correlation coefficient. Tables 2 to 5 report the results of the comparison for 15 min, hourly and daily irradiation respectively.
3 Results and discussion
The correlation coefficient for 15 min irradiation is reported in Table 2. For both IHC3v3 and IHC3McClear, the correla-tion coefficient is very large, greater than 0.95, except for Toravere (0.91), indicating that the 15 min irradiation is well reproduced by both estimates. The correlation is slightly greater for IHC3McClearthan for IHC3v3, showing that the com-bination of IHC3v3with McClear brings a better reproduction of the observed changes in irradiation. This observation is supported by the fact that the correlation coefficient for the clearness index KTMcClear is greater than that for KTHC3v3 (Table 2).
The bias for IHC3v3 ranges from −3.0 to 1.3 J cm−2 (Ta-ble 3). The bias for IHC3McClearis similar to or smaller than that for IHC3v3for all cases. An exception to the overall de-crease in bias is Tamanrasset, where the bias is 1.3 J cm−2 (3 % of the mean irradiation) for IHC3v3and 1.7 J cm−2(4 %) for IHC3McClear. A closer examination of the data sets of
irradiation and the clearness index for Tamanrasset reveals that IHC3v3exhibits a negative bias for clear-sky conditions and a positive bias for cloudy situations. The balance be-tween these negative and positive biases yields an overall bias of 1.3 J cm−2. The combination of IHC3v3with McClear yields more accurate results for clear-sky conditions, as ex-pected. The bias in these conditions is now strongly reduced and close to 0. On the contrary, there is almost no change in the results for cloudy situations, which exhibit a positive bias. Contrary to IHC3v3, this positive bias is not counterbal-anced in IHC3McClear by an equivalent but negative bias for clear skies. The result is that the bias in IHC3McClearis slightly greater than that of IHC3v3.
The standard deviation is fairly similar for IHC3v3 and IHC3McClearfor all stations. It ranges from 6.3 to 8.2 J cm−2 for IHC3v3. It is smaller for IHC3McClear, and ranges from 6.1 to 7.8 J cm−2. The smaller standard deviation may be linked to the better correlation coefficient observed for IHC3McClear. Similarly, the RMSD is slightly less for IHC3McClearthan for IHC3v3. Tables 2 and 3 show that the combination of HC3 and McClear brings a benefit for 15 min irradiation for the six studied stations.
Table 4 reports results for hourly irradiation. The cor-relation coefficient for IHC3McClear is large, greater than 0.97, except for Toravere (0.95), and is greater than that for IHC3v3. The bias ranges from −11.1 to 4.9 J cm−2for IHC3v3, and from −6.8 to 6.5 J cm−2 for I
HC3McClear. The bias for
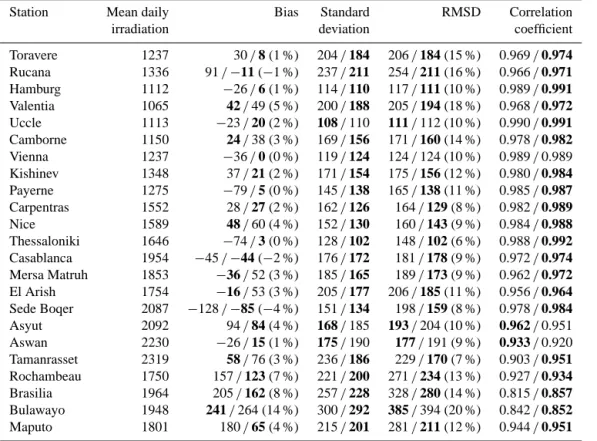
Table 5. Comparison of differences for daily irradiation, in J cm−2. The mean value is obtained from the measurements. The first value is IHC3v3and the second is IHC3McClear, with the best value in bold. Bias and RMSD of IHC3McClearrelative to the mean irradiation are given in brackets.
Station Mean daily Bias Standard RMSD Correlation
irradiation deviation coefficient
Toravere 1237 30 / 8 (1 %) 204 / 184 206 / 184 (15 %) 0.969 / 0.974 Rucana 1336 91 / −11 (−1 %) 237 / 211 254 / 211 (16 %) 0.966 / 0.971 Hamburg 1112 −26 / 6 (1 %) 114 / 110 117 / 111 (10 %) 0.989 / 0.991 Valentia 1065 42 / 49 (5 %) 200 / 188 205 / 194 (18 %) 0.968 / 0.972 Uccle 1113 −23 / 20 (2 %) 108 / 110 111 / 112 (10 %) 0.990 / 0.991 Camborne 1150 24 / 38 (3 %) 169 / 156 171 / 160 (14 %) 0.978 / 0.982 Vienna 1237 −36 / 0 (0 %) 119 / 124 124 / 124 (10 %) 0.989 / 0.989 Kishinev 1348 37 / 21 (2 %) 171 / 154 175 / 156 (12 %) 0.980 / 0.984 Payerne 1275 −79 / 5 (0 %) 145 / 138 165 / 138 (11 %) 0.985 / 0.987 Carpentras 1552 28 / 27 (2 %) 162 / 126 164 / 129 (8 %) 0.982 / 0.989 Nice 1589 48 / 60 (4 %) 152 / 130 160 / 143 (9 %) 0.984 / 0.988 Thessaloniki 1646 −74 / 3 (0 %) 128 / 102 148 / 102 (6 %) 0.988 / 0.992 Casablanca 1954 −45 / −44 (−2 %) 176 / 172 181 / 178 (9 %) 0.972 / 0.974 Mersa Matruh 1853 −36 / 52 (3 %) 185 / 165 189 / 173 (9 %) 0.962 / 0.972 El Arish 1754 −16 / 53 (3 %) 205 / 177 206 / 185 (11 %) 0.956 / 0.964 Sede Boqer 2087 −128 / −85 (−4 %) 151 / 134 198 / 159 (8 %) 0.978 / 0.984 Asyut 2092 94 / 84 (4 %) 168 / 185 193 / 204 (10 %) 0.962 / 0.951 Aswan 2230 −26 / 15 (1 %) 175 / 190 177 / 191 (9 %) 0.933 / 0.920 Tamanrasset 2319 58 / 76 (3 %) 236 / 186 229 / 170 (7 %) 0.903 / 0.951 Rochambeau 1750 157 / 123 (7 %) 221 / 200 271 / 234 (13 %) 0.927 / 0.934 Brasilia 1964 205 / 162 (8 %) 257 / 228 328 / 280 (14 %) 0.815 / 0.857 Bulawayo 1948 241 / 264 (14 %) 300 / 292 385 / 394 (20 %) 0.842 / 0.852 Maputo 1801 180 / 65 (4 %) 215 / 201 281 / 211 (12 %) 0.944 / 0.951
IHC3McClear is similar to or smaller than that for IHC3v3for all cases.
The standard deviation ranges from 20.6 to 27.1 J cm−2 for IHC3v3. In all cases, the standard deviation is smaller for IHC3McClear than that for IHC3v3, and ranges from 19.7 to 25.2 J cm−2. Like previously, the smaller standard deviation may be linked to the better correlation coefficient observed for IHC3McClear. The RMSD is less for IHC3McClear than for IHC3v3. It ranges from 19.8 to 25.3 J cm−2. Like for 15 min irradiation, Table 4 shows that the combination of HC3 and McClear brings a benefit for 1 h irradiation for the six studied stations.
Table 5 reports the results of the comparison for daily ir-radiation. The correlation coefficient for IHC3McClearis large, greater than 0.93, except for Aswan (0.92), Brasilia (0.86) and Bulawayo (0.85). For all stations except Asyut and Aswan, the correlation is greater for IHC3McClear than for IHC3v3. The day-to-day changes in daily irradiation are well reproduced by IHC3v3, and slightly better by IHC3McClear.
The bias ranges from −128 to 241 J cm−2for I
HC3v3. The bias for IHC3McClearis similar or smaller for 16 stations out of 23, and ranges from −85 to 264 J cm−2. Several stations ex-hibit spectacular decreases, such as Rucana (from 91 down to −11 J cm−2), Thessaloniki (from −74 down to 3 J cm−2), or Maputo (from 180 down to 65 J cm−2). Seven stations exhibit
greater bias for IHC3McClearthan for IHC3v3: Valentia, Cam-borne, Nice, Mersa Matruh, El Arish, Tamanrasset, and Bul-awayo.
The standard deviation for IHC3McClear ranges from 102 (Uccle) to 292 J cm−2(Bulawayo). It is similar to or less than that for IHC3v3, except for Asyut and Aswan. The RMSD for IHC3McClearranges from 102 to 394 J cm−2, that is, from 6 % to 20 % of the mean observed value. It is similar to or less than that for IHC3v3, with the exception of Asyut, Aswan and Bulawayo. Actually, the difference in standard devia-tion or RMSD is small for these three sites, and is less than 15 J cm−2. This is less than the 66 % uncertainty required by the World Meteorological Organization for the measurement of the daily irradiation (WMO, 2008), which is 40 J cm−2for Iground<800 J cm−2and 5 % for Iground>800 J cm−2. Tak-ing this into account, it is found that IHC3McClearexhibits sim-ilar or better accuracy than IHC3v3for daily irradiation.
One may observe that the relative RMSD for IHC3McClearis less than 12 % in most cases. Exceptions are Toravere (15 %), Rucana (16 %), Camborne (14 %), Valentia (18 %), Rocham-beau (13 %), Brasilia (14 %), and Bulawayo (20 %). These stations are seen with a large viewing angle by the Meteosat satellite. Schutgens and Roebeling (2009) or Marie-Joseph et al. (2013) argue that such angles induce a shift in the actual locations of clouds. The sensor aboard the Meteosat satellite
3932 Z. Qu et al.: Improving HelioClim-3 estimates of surface solar irradiance
does not see exactly what is happening in the atmospheric column right above a measuring station. This contributes to the deviation between HC3 and ground measurements. The effects of the parallax are enhanced in the case of fragmented cloud cover, especially when the pixel size is large, which happens for large viewing angles. Marie-Joseph et al. (2013) mention that cloud fragmentation may contribute to a larger bias for intermediate skies because of the limited spatial res-olution of the Meteosat sensor that prevents one from detect-ing small broken clouds such as cumulus. This patchwork of small clouds may be interpreted by the sensor and further-more by the Heliosat-2 method as a large thin cloud. This mistake contributes to the deviation. As a rule of thumb, the farther from the nadir of the Meteosat satellite located at lat-itude 0◦and longitude 0◦, and the greater the occurrence of fragmented cloud cover, the greater the bias, relative standard deviation and RMSD.
4 Conclusions
This technical note proposes a very simple method to im-prove HC3v3 records by combining them with data records of the irradiation under clear skies from the new McClear clear-sky model. Inputs to McClear are the advanced global aerosol property forecasts and physically consistent total col-umn content in water vapour and ozone produced by the MACC projects. All irradiation data sets may be retrieved on the SoDa website (http://www.soda-pro.com), and therefore the method is easily applicable. The method can be applied at any scale; it is not necessary to correct HC3v3 at 15 min resolution and then to sum up to obtain hourly or daily irra-diation. Hourly and daily irradiation can be corrected using the corresponding irradiation from McClear.
The method has been validated against ground measure-ments made at several summarizations: 15 min, 1 h, and 1 day. The correlation coefficient is large, greater than re-spectively 0.92, 0.94, and 0.97, for 15 min, 1 h and daily irradiation. The bias ranges from −4 to 4 % of the mean observed irradiation for most sites. The relative root mean square difference (RMSD) varies between 14 and 38 % for 15 min, 12 % and 33 % for 1 h irradiation, and 6 and 20 % for daily irradiation.
For all studied scales, 15 min, 1 h and 1 day, and almost all stations, the corrected irradiations IHC3McClearare closer to the ground-based measurements than those of IHC3v3 ob-tained with a climatology of the Linke turbidity factor. There are few stations for which IHC3McCleardoes not show better performances than IHC3v3, and in these cases, the difference is not large, and is less than the 66 % uncertainty required for daily irradiation by the World Meteorological Organiza-tion (WMO, 2008). It is believed that the main cause of the benefit of this combination of HC3 and McClear is due to the fact that the inputs to McClear, aerosol properties and to-tal column content in water vapour and ozone, are estimated
every 3 h. The main advantage of combining HC3v3 and Mc-Clear is that the large irradiations are reproduced better. The method brings an improvement in most cases and no degra-dation in the others, and a systematic correction of HC3v3 with McClear is recommended.
Acknowledgements. The research leading to these results has received funding from the European Union’s Seventh Framework Programme (FP7/2007-2013) under grant agreement no. 283576 (MACC-II project) and no. 262892 (ENDORSE project). The authors thank all ground station operators of the BSRN network for their valuable measurements and the Alfred Wegener Institute for hosting the BSRN website, and acknowledge the help of the Baseline Surface Radiation Network (BSRN), the World Radiation Data Center (WRDC) and the meteorological networks supplying measurements of irradiation to the WRDC.
Edited by: R. Engelen
References
Benedetti, A., Kaiser, J. W., and Morcrette, J.-J.: Global Climate, Aerosols in: State of the Climate in 2010, Bull. Am. Meteorol. Soc., 92, S65–S67, 2011.
Blanc, P., Gschwind, B., Lefevre, M., and Wald, L.: The HelioClim project: Surface solar irradiance data for climate applications, Remote Sens., 3, 343–361, doi:10.3390/rs3020343, 2011. Elias, T. and Roujean, J.-L.: Estimation of the aerosol radiative
forcing at ground level, over land, and in cloudless atmosphere, from METEOSAT-7 observation: method and case study, Atmos. Chem. Phys., 8, 625–636, doi:10.5194/acp-8-625-2008, 2008. GCOS: Global Climate Observing System Essential Climate
Vari-ables, available at: www.wmo.int/pages/prog/gcos/index.php? name=EssentialClimateVariables, last access: 20 September 2013.
Geiger, M., Diabate, L., Menard, L., and Wald, L.: A web ser-vice for controlling the quality of measurements of global so-lar irradiation, Sol. Energy, 73, 475–480, doi:10.1016/S0038-092X(02)00121-4, 2002.
Inness, A., Baier, F., Benedetti, A., Bouarar, I., Chabrillat, S., Clark, H., Clerbaux, C., Coheur, P., Engelen, R. J., Errera, Q., Flem-ming, J., George, M., Granier, C., Hadji-Lazaro, J., Huijnen, V., Hurtmans, D., Jones, L., Kaiser, J. W., Kapsomenakis, J., Lefever, K., Leitão, J., Razinger, M., Richter, A., Schultz, M. G., Simmons, A. J., Suttie, M., Stein, O., Thépaut, J.-N., Thouret, V., Vrekoussis, M., Zerefos, C., and the MACC team: The MACC reanalysis: an 8 yr data set of atmospheric composition, Atmos. Chem. Phys., 13, 4073–4109, doi:10.5194/acp-13-4073-2013, 2013.
Kaiser, J. W., Peuch, V.-H., Benedetti, A., Boucher, O., Enge-len, R. J., Holzer-Popp, T., Morcrette, J.-J., Wooster, M. J., and the MACC-II Management Board: The pre-operational GMES Atmospheric Service in MACC-II and its potential us-age of Sentinel-3 observations, ESA Special Publication SP-708, Proceedings of the 3rd MERIS/(A)ATSR and OCLI-SLSTR (Sentinel-3) Preparatory Workshop, held in ESA-ESRIN, Fras-cati, Italy, 15–19 October 2012, 2012.
Lefèvre, M., Oumbe, A., Blanc, P., Espinar, B., Gschwind, B., Qu, Z., Wald, L., Schroedter-Homscheidt, M., Hoyer-Klick, C., Arola, A., Benedetti, A., Kaiser, J. W., and Morcrette, J.-J.: Mc-Clear: a new model estimating downwelling solar radiation at ground level in clear-sky conditions, Atmos. Meas. Tech., 6, 2403–2418, doi:10.5194/amt-6-2403-2013, 2013.
Lefevre, M., Blanc, P., Espinar, B., Gschwind, B., Menard, L., Ranchin, T., Wald, L., Saboret, L., Thomas, C., and Wey, E.: The HelioClim-1 database of daily solar radiation at Earth sur-face: an example of the benefits of GEOSS Data-CORE, IEEE J. Sel. Topics Appl. Earth Obs. Remote Sens., 7, 1745–1753, doi:10.1109/JSTARS.2013.2283791, 2014.
Marie-Joseph, I., Linguet, L., Gobindass, M.-L., and Wald, L.: On the applicability of the Heliosat-2 method to as-sess surface solar irradiance in the Intertropical Convergence Zone, French Guiana, Int. J. Remote Sens., 34, 3012–3027, doi:10.1080/01431161.2012.756598, 2013.
Peuch, V.-H., Rouil, L., Tarrason, L., and Elbern, H.: Towards European-scale Air Quality operational services for GMES At-mosphere, 9th EMS Annual Meeting, EMS2009-511, 9th Euro-pean Conference on Applications of Meteorology (ECAM) Ab-stracts, held 28 September–2 October 2009, Toulouse, France, EMS2009-511, 2009.
Remund, J., Wald, L., Lefevre, M., Ranchin, T., and Page, J.: World-wide Linke turbidity information, In Proceedings of ISES Solar World Congress, 16–19 June 2003, Göteborg, Sweden, CD-ROM published by International Solar Energy Society, 2003.
Rigollier, C., Bauer, O., and Wald, L.: On the clear sky model of the 4th European Solar Radiation Atlas with respect to the Heliosat method, Sol. Energy, 68, 33–48, doi:10.1016/S0038-092X(99)00055-9, 2000.
Rigollier, C., Lefevre, M., and Wald, L.: The method Heliosat-2 for deriving shortwave solar radiation from satellite images, Sol. Energy, 77, 159-169, doi:10.1016/j.solener.2004.04.017, 2004. Roesch, A., Wild, M., Ohmura, A., Dutton, E. G., Long, C. N., and
Zhang, T.: Assessment of BSRN radiation records for the com-putation of monthly means, Atmos. Meas. Tech., 4, 339–354, doi:10.5194/amt-4-339-2011, 2011.
Schutgens, N. A. J. and Roebeling, R. A.: Validating the validation: The influence of liquid water distribution in clouds on the intercomparison of satellite and surface observations, J. Atmos. Ocean. Technol., 26, 1457–1474, doi:10.1175/2009JTECHA1226.1, 2009.
WMO: Guide to Meteorological Instruments and Methods of Ob-servation, World Meteorological Organization, WMO-No 8, 7th Edn., Geneva, Switzerland, 2008.
Xu, J., Li, C., Shi, H., He, Q., and Pan, L.: Analysis on the im-pact of aerosol optical depth on surface solar radiation in the Shanghai megacity, China, Atmos. Chem. Phys., 11, 3281–3289, doi:10.5194/acp-11-3281-2011, 2011.