HAL Id: hal-03105476
https://hal.archives-ouvertes.fr/hal-03105476
Submitted on 28 Jan 2021
HAL is a multi-disciplinary open access archive for the deposit and dissemination of sci-entific research documents, whether they are pub-lished or not. The documents may come from teaching and research institutions in France or abroad, or from public or private research centers.
L’archive ouverte pluridisciplinaire HAL, est destinée au dépôt et à la diffusion de documents scientifiques de niveau recherche, publiés ou non, émanant des établissements d’enseignement et de recherche français ou étrangers, des laboratoires publics ou privés.
Distributed under a Creative Commons Attribution| 4.0 International License
The Concept of Effective Porosity in the Discharge Rate
Performance of High-Density Positive Electrodes for
Automotive Application
S. Tambio, F. Cadiou, E. Maire, N. Besnard, M. Deschamps, B. Lestriez
To cite this version:
S. Tambio, F. Cadiou, E. Maire, N. Besnard, M. Deschamps, et al.. The Concept of Effective Poros-ity in the Discharge Rate Performance of High-DensPoros-ity Positive Electrodes for Automotive Applica-tion. Journal of The Electrochemical Society, Electrochemical Society, 2020, 167 (16), pp.160509. �10.1149/1945-7111/abcb42�. �hal-03105476�
The concept of effective porosity in the discharge rate performance of high-density positive electrodes for automotive application
S. J. Tambioa,b, F. Cadiouc, E. Mairec, N. Besnardd, M. Deschampsb, B. Lestrieza,z
a Institut des Matériaux Jean Rouxel (IMN) Nantes, CNRS UMR 6502, Université de Nantes, 44322, Nantes Cedex 3, France
b UPR 3079 CNRS CEMHTI, Orléans University, Orléans, France &
Réseau sur le Stockage Electrochimique de l’Energie (RS2E), FR CNRS 3459 Hub de l’Energie, Amiens, France
c Univ Lyon, INSA Lyon, CNRS, MATEIS, UMR 5510, F-69621 Villeurbanne, France d Renault Technocentre, Research Division, 78084 Guyancourt, France
Abstract
The discharge rate performance of NMC532-based electrodes designed for EV application were measured between 0 and 40°C and were compared to the predictions of the electrolyte limited penetration depth model [Gallagher et al., J. Electrochem. Soc. 163, A138 (2016)], also called diffusion limited current density model [Heubner et al., J. Power Sources 419, 119 (2019)]. To support this analysis, we took into account the actual microstructure of the electrodes, previously characterized by FIB/SEM tomography, and their measured and/or simulated transport properties. We show that the performance of NMC532 electrodes, even with a low carbon content below the percolation threshold, are not limited by electrons transport through the electrode due to the high intrinsic conductivity of this active material. At 40°C, the swelling
of the PVdF by the electrolyte solvents penalizes performance, especially as the binder content is high. Above all, the current density at which a brutal decrease in capacity occurs is well predicted by the model, although by reducing the porosity to its percolated micrometer sized fraction. This is in good agreement with the numerical simulations of the ionic transport properties.
Introduction
Electric vehicles (EVs) are slowly being introduced to the market today to replace internal combustion engines with the aim of reducing global greenhouse gas emissions. The main component holding back the spread of electric vehicles is their energy source [1,2]. Batteries are one of the most widely regarded sources of power and current research is primarily focused on Li-ion technology due to its proven track record in powering a majority of devices today. The energy density and the power density of the batteries are two key points. Energy dictates vehicle mileage/range while power dictates both charge times and torque. At the electrode scale, energy density can be improved by increasing the amount of active material present in the electrode. This can be achieved by increasing the density and thickness of the electrodes, but the downside is that the power density can be degraded [3,4].
In the case of electrodes designed for EVs, which are quite thick and dense, it is well established that the power performance is limited by the transport of the electrolyte salt in the porosity of the electrode [5,6]. At a high charge or discharge rate, the depletion of the salt concentration in the electrode where the lithium insertion reaction takes place stops this reaction. The electrolyte salt transport depends on the bulk (intrinsic) transport properties of the electrolyte, which varies with temperature, and also on the amount of porosity in the electrode, on the geometric tortuosity of the pore volume, on the interactions between the species of the electrolyte and the
constituents of the electrode, and finally the thickness of the electrode. Apart from the properties of the electrolyte, all the other parameters depend on the formulation of the electrode, that is to say the choice of its constituents, and on the manufacturing process of the electrode.
Achieving the optimum electrode design can be done both experimentally and by modeling. The second approach uses numerical simulation and seeks to take into account all the phenomena and properties [7]. It has the great advantage of being able to study a multiplicity of electrode designs, because it has now become possible to create virtual electrodes of realistic microstructure [8] and even integrating the influence of the elaboration process [9]. The first approach is more tedious, time consuming, and risky. However, there are simple analytical models that are based on the understanding of the most significant physical or chemical phenomena which govern the properties or performances. These models make it possible to rationalize the results of the measurements, and to pose a rapid diagnosis on the electrode formulation and manufacture quality [10-14]. Such models are much appreciated tools by experimentalists and engineers for optimizing electrode design and understanding what can limit their electrochemical performance. Needless to remind, another advantage of the experimental approach is to feed simulations with references to be compared to.
In this work, we studied the power performance at different temperatures (from 0 to 40°C) of EV-designed LiNi0.5Mn0.3Co0.2O2 (NMC532) based electrodes differing in their densities and
carbon black/binder additives contents. Their discharge rate performance were confronted to a recently proposed analytical model, named limited penetration depth model (PDM) or diffusion-limited current density model [13,14]. This one predicts the limiting current for which the phenomenon of salt depletion in the electrolyte occurs, taking into account the transport properties of the electrolyte and the parameters of the electrode. However, this model neglects all other limitations including those associated with electronic transport in the electrode. Furthermore, in the previous works the classical Bruggeman correlation was used to
calculate the tortuosity of the porosity. Here, the microstructure and the transport properties of the electrodes were carefully characterized and analyzed using FIB/SEM characterizations and numerical simulations, details of which are given elsewhere [15,16], to assess as rigorously as possible the reliability of the PDM and its ability to take into account the real microstructure of the electrode and its transport properties.
The paper is organized as follows. First of all, we expose the analytical model. Then the microstructure and the transport properties of the electrodes are discussed, before studying the electrochemical performance, first qualitatively, then quantitatively using the PDM. Our results show the great interest of this model. However, the relevance of its predictions depends on the understanding that one has of the microstructure of the electrodes and its influence on its transport properties. More precisely, it is here underlined the preponderant role of the network of micrometric pores on the power performance. From the perspective of the model, it is like the electrode porosity is restricted to its network of micrometric pores at high current.
Penetration depth model (PDM) or diffusion limited current density model
The concept of limited penetration depth accounts for the formation of a lithium salt concentration gradient across the cell to balance the migration of the anions that are not involved in the electrochemical reaction [17,18]. For example, during the cell discharge, the concentration is higher at the negative side and lower at the positive side. Enhancing the current density decreases the penetration depth. The magnitude of the concentration gradient may increase up to a point where the concentration of the lithium salt in the area of the positive electrode close to the current collector is decreased to zero. Once this happens, the positive active material in this region can no longer participate to the electrochemical reaction as there are no lithium ions in the electrolyte to insert. This define a maximum current density I* (or
discharging rate C*) for utilizing the whole positive electrode. At higher current densities (or discharging rate) the electrode area where the electrolyte concentration is dropped to zero is wider (closer to the separator), thus preventing a larger fraction of the active material participation. At current densities lower than I* (or at discharging rate lower than C*) a limiting current is never reached as the penetration depth is larger than the designed electrode thickness. The occurrence of this diffusion-limited current density or critical C-rate is well observed experimentally [11,12,19-21].
Building on pioneer works by Newman and co-workers [17,18], Johns et al. [10] and then Gallagher et al. [13] derived a simple analytical equation for the penetration depth for electrolyte transport in the electrode, Ld:
𝐿𝐿
𝑑𝑑=
𝑇𝑇𝜖𝜖 𝐷𝐷0𝐶𝐶0𝐹𝐹(1−𝑡𝑡+)𝐼𝐼 (1)
where ε is the porosity of the electrode, T is the tortuosity factor of the pore matrix, D0 is the
diffusion coefficient of the lithium salt species in the electrolyte, t+ is the transference number
of Li+, I is the applied current density and F the Faraday constant. A similar equation was derived by Heubner et al. [14], but rather to express the limiting current I* as
𝐼𝐼
∗= 2
𝜖𝜖 𝑇𝑇𝐷𝐷0𝐶𝐶0𝐹𝐹
𝐿𝐿 (1’)
In equation (1’), the term in parentheses in equation (1) is replaced by a numerical term equal to 1/2. However, as the lithium transport number is close to 0.5 for the electrolyte considered here, both equations are very close. The tortuosity factor accounts for all aspects that are
hindering the diffusive transport in the electrolyte when it is confined within the electrode porosity [22]. It is defined by
𝜅𝜅
𝑒𝑒𝑒𝑒𝑒𝑒= 𝜅𝜅
0𝜖𝜖𝑇𝑇and
𝐷𝐷
𝑒𝑒𝑒𝑒𝑒𝑒= 𝐷𝐷
0𝑇𝑇𝜖𝜖(2)
with κeff and Deff the effective ionic conductivity and diffusivity, κ0 and D0 the bulk electrolyte
conductivity and diffusivity. One contribution to the tortuosity factor is geometric tortuosity of the pores τ. For a porous medium with Lpore as the effective actual path length through pores
from one point to another one, and Lstraight as the straight (Euclidian) distance, the definition of
the geometrical tortuosity is
𝜏𝜏 =
𝐿𝐿𝑝𝑝𝑝𝑝𝑝𝑝𝑝𝑝𝐿𝐿𝑠𝑠𝑠𝑠𝑝𝑝𝑠𝑠𝑠𝑠𝑠𝑠ℎ𝑠𝑠 (3)
If only the geometric tortuosity influences the transport of the ions, the tortuosity factor can be written [23,24]
𝑇𝑇 = 𝜏𝜏
2 (4)Noteworthy, this equation was mathematically derived for a bundle of sinuous but parallel pores [23]. If neither the solid state diffusion in the active material nor the electronic conductivity of the electrode are limiting, it is possible from equation (1) to express the accessible capacity, QI,
at an applied current density higher than I*, through the ratio between the penetration depth for electrolyte transport in the electrode, Ld, and the designed electrode thickness L:
𝑄𝑄𝐼𝐼 𝑄𝑄0
=
𝐿𝐿𝑑𝑑
𝐿𝐿 (5)
Which gives with Eq. (1)
𝑄𝑄
𝐼𝐼= 𝑄𝑄
0𝑇𝑇𝐿𝐿𝜖𝜖 (1−𝑡𝑡+)𝐼𝐼𝐷𝐷0𝐶𝐶0𝐹𝐹 (6)with Q0 the nominal specific capacity of the electrode. Previous works of Gallagher et al. [13]
and Heubner et al. [14] showed this approach allows to correctly predict the rate capability of NMC622/graphite and NMC622/lithium cells at room temperature. The classical Bruggeman approximation was used to express the tortuosity as T = ε0.5. However, the predictions given by
the Bruggeman correlation are not always consistent with experimental results [25-29]. Here, the influence of the real electrode microstructure was carefully considered by using the results of FIB/SEM characterizations and numerical simulations done on the same electrodes to feed equation (6) [15,16]. Moreover, the influence of the temperature was also studied by considering measurements done at 0, 22 and 40°C.
Table 1. Electrode specifications: weight and volume fractions of the AM, CB and PVdF, NMC loading, surface
capacity, density, thickness, porosity.
Sample Name NMC wt% (v%) PVdF wt% (v%) CB wt% (v%) NMC Loading (mg/cm2) Surface capacity (mAh/cm²) Density (g/cm3) Thickness (µm) Porosity NA3 96 (64.8) 1.8 (3.0) 2.2 (3.6) 14.9 2.5 3.2 48.5 28 NA2 96 (64.8) 1.8 (3.0) 2.2 (3.6) 24.4 4.1 3.2 79.4 28 NA8 96 (68.9) 1.8 (3.2) 2.2 (3.8) 24.7 4.1 3.4 75.7 23.5 NA7 96 (70.9) 1.8 (3.3) 2.2 (3.9) 25.0 4.2 3.5 74.4 21.2 NA3b 94.2 (69.6) 2.6 (5.6) 3.2 (5.7) 14.6 2.45 3.5 44.3 19.1 NA2b 94.2 (63.6) 2.6 (5.1) 3.2 (5.2) 25.3 4.25 3.2 83.9 26 NA7b 94.2 (69.6) 2.6 (5.6) 3.2 (5.7) 25.35 4.26 3.5 76.9 19.1 NA4b 94.2 (69.6) 2.6 (5.6) 3.2 (5.7) 40.7 6.84 3.5 123.4 19.1
Figure 1. Typical FIB/SEM images of NA3 electrode cross-section at various magnifications: (a) x 2 500, b) x
3 000, (c) x 7 500, (d) x 10 000.
Electrodes compositions and microstructures
NMC532 based electrodes were made on an industrial pilot-scale manufacturing line. Their specifications are given in Table I. They differ by their CB and PVdF contents (respectively 2.2 and 1.8% by weight for the NAx series, and 3.2 and 2.6% by weight for the NAxb one), NMC loading (around 15, 25 and 40 mg/cm²), density and porosities (NA3, NA2, and NA2b have lower densities (higher porosities) than NA7, NA3b, NA4b, NA7b; NA8 has slightly lower density than the last four electrodes). Typical cross-section FIB/SEM images of one of the electrodes are shown in Figure 1. The microstructures of NA3, NA2, NA7, NA2b, and NA7b
were also characterized at their different scales by different techniques (X-Ray (XR) tomography, and FIB/SEM nanotomography) [15]. Some quantitative morphological parameters determined by image analysis on the FIB/SEM volumes are reported in Table 2 and discussed hereafter.
Before all, one must note that the compositions in the FIB/SEM volumes deviates more or less from the electrode ones. Two points shall be underlined. For all FIB/SEM volumes, the CB/PVdF volume fraction is 20 to 50% lower than in the entire electrode, which is due to the existence of few ultra-large CB/PVdF agglomerates randomly dispersed, as shown in Figure
1a. Care was taken to acquire the FIB/SEM volumes far from these heterogeneities. Moreover,
for NA2 and NA2b the volume fraction in NMC is higher while the porosity is lower in the FIB/SEM volume than in the entire electrode. An opposite trend is shown by NA3. For NA7, local and mean NMC volume fractions are close, so the lack in CB/PVdF is locally compensated by a higher porosity at the local scale. For NA7b the local NMC volume fraction and porosity are higher than in the entire electrode, which is the consequence of the large CB/PVdF depletion. Such deviations between the compositions at a small scale and the overall compositions is common and due to statistical variations and representativeness issues [30,31].
Figure 1. It can be concluded that the FIB/SEM volumes which have been analysed are not
large enough for the values of the morphological parameters calculated from them to be directly transposed to the corresponding whole electrodes. But, they give trends that are representative of the morphological characteristics of the electrodes studied here in relationships with their specifications as we will see later. More details can be found in [15,16].
As it can be seen in Figure 1, the NMC, which appears as a light grey phase, consists of large polycrystalline aggregates (or clusters of grains), some of them being hollow and/or fractured. The grain size within the NMC clusters has a mean diameter of 0.26µm (d10-d90 interval equal to 0.15 to 1.0µm). The NMC cluster mean diameter in the pristine powder is 5µm (d10-d90
interval equal to 3.2 to 14.5µm). In the electrodes, about half of the NMC clusters are fractured due to the calendering step. The denser the electrode the more fractured the clusters are (~55+/-2% for NA7 and NA7b vs. 45+/-(~55+/-2% for NA2 and NA3 for example). The CB is intimately mixed with the PVdF binder. This mixture is the darker grey phase in Figure 1. It occupies a fraction of the volume left vacant by the NMC clusters and grains packing. It comes in the shape of more or less percolated aggregates from a few tenth of nanometers to around a micron thick. The percolation state of the CB/PVdF mixture was evaluated through its intraconnectivity in the FIB/SEM volumes. This morphological parameter is defined as the volume of the biggest connected subvolume over the volume of the whole phase. Intraconnectivity values are thus indicators of how well a phase is connected. The values close to 100% for NA2b and NA7b indicates that the CB/PVdF mixture is well percolated in the NAxb electrodes. Contrarily, the lower values for NA3, NA2, and NA7 indicates that in the NAx electrodes the CB/PVdF mixture is not percolated. The last phase is the porosity, which displays a wide range of size. We separated the micrometric porosity, made of pores larger than 60 nm in size typically consisting of cavities within the packing of NMC clusters, from the nanometric porosity, made of pores smaller than 60 nm, typically consisting of nanopores within the PVdF/CB mixture and of the cracked grain boundaries within fragmented NMC clusters. The micrometric porosity represents the major part of the porosity and is always percolated (intraconnectivity above 90%). The participation of the percolated micrometric porosity to the total porosity decreases from 95% for NA3 to 72% for NA7b, i.e. when the density and the CB/PVdF content increases. Moreover, the distribution of the geometrical tortuosity values was determined. Most representative values range between 1.05 and 1.15 for the micrometric porosity and between 1.4 and 2.0 for the nanometric porosity [15]. All in all, this suggests that for long range and fast diffusion of electrolyte species at high discharge rate the effective electrode porosity may reduce to only the low tortuosity percolated micrometric porosity. Finally, interconnectivity
values between NMC and the other phases is important for the charge transfer reaction. Firstly, the fraction of the NMC surface covered by the PVdF/CB mixture varies between 9 and 16% and is rather independent of the PVdF/CB content. The fraction of the NMC surface exposed to the micrometric porosity, which is where the electrolyte species (and in particular Li+ ions)
will be the more available to insertion or deinsertion, varies from 77% to 36%. It naturally has its lower values for the more calendered (more fragmented) and richer in CB/PVdF electrodes (NA7 and NA7b). It was also shown previously that, for NMC333-based electrodes, an interconnectivity critical value between the NMC phase and the CB/PVdF mixture exists, below which the electrochemical performance is limited by an insufficient supply of electrons to the active material. This critical value was determined to be between 3 and 8% [21]. For the electrodes studied here, this interconnectivity is always above 9%, which means their electrochemical performance should not be limited by this aspect.
Table 2. quantitative morphological parameters determined by image analysis on the FIB/SEM volumes [15] and
effective electrical properties calculated by numerical simulations on the FIB/SEM volumes [16].
FIB/SEM volume NA3 NA2 NA7 NA2b NA7b
Volume fraction (%) NMC 61+/-1 70+/-0.4 68.8+/-0.3 68.4+/-0.2 72.4+/-0.1 CB+PVdF 4.1+/-0.6 4.6+/-0.2 4.6+/-0.3 8+/-0.4 7.6+/-0.3 Porosity 35+/-0.6 24.9+/-0.3 26.5+/-0.7 23.7+/-0.5 20.1+/-0.4 Percolated microporosity 32.8 22.3 20.5 18.8 14.2 Density 3.0 3.4 3.4 3.4 3.6 CB+PVdF mixture intraconnectivity 30.7 71.4 62.7 97.3 95.1 NMC inter-connectivity (% of surface area) with
CB+PVdF 9 16 9 12 12 Microporosity 77 56 42 50 36 Geometric tortuosity τ Microporosity 1.10 +/- 0.05 Nanoporosity 1.70 +/- 0.30
Effective electronic conductivity (S.m-1) 0.0028 0.043 0.171 1.01 1.10
Effective ionic conductivity (S.m-1) 0.110 0.061 0.076 0.056 0.032
Tortuosity factor (equation 2) 3.4 3.1 4.0 4.1 6.2
Effective electronic and ionic conductivities
Effective electronic and ionic conductivities were calculated by numerical simulations done on the FIB/SEM volumes using Fast Fourier Transform (FFT) method [16]. Such simulations are directly computed on the grid represented by the voxels in the FIB/SEM volumes. Previous work showed a good agreement between the experimentally measured effective electronic conductivity values and calculated ones with this FFT method for electrodes based on NMC333/LiFePO4 blends [32]. For the electrodes studied here a good agreement was also
conductivities of NAx electrodes is one or two order of magnitude lower than NAxb ones, which confirms the better percolation of the CB/PVdF mixture in the latter, due to its higher content.
The simulated effective ionic conductivity decreases regularly with the decrease of the porosity in the FIB/SEM volumes. No comparison with experimental measurement is available, but the corresponding tortuosity factors (determined with Eq. 2) are in good agreement with previous measurements on LiFePO4, LiCoO2 and NMC333-based electrodes [26,28]. In addition, the
analysis of the spatial distribution and the intensity distribution of the ionic current densities revealed the predominant role of the percolated micrometric porosity (See Figure 7e in Ref 16). Together with the analysis of the geometrical tortuosity distribution here above, these simulations underline that ionic transport is dominated by low tortuosity micrometric channels through the electrode, which was also well evidenced experimentally for LiCoO2- and LiFePO4
-based electrodes [33-35].
Electrochemical measurements
Experimental. – Samples of 7 mm diameter were punched out from the positive electrode
laminates. They were dried in a 90°C vacuum oven for 16 h before assembly. Coin cells were assembled in half-cell configuration in an argon atmosphere controlled glove box. The metallic parts of the coin cells were cleaned in acetone in an ultrasonic bath for 2 h and dried at 90°C under vacuum before being introduced in the glove box. Lithium disc (Sigma Aldrich, 0.75mm thickness) of 12 mm diameter was used as the reference and negative electrode, Whatman™ GF/D glass fiber was used as separator (dried at 120°C under vacuum before being introduced in the glove box) and LP30 (LiPF6 1 molar in 1:1 v:v ethylene carbonate : dimethylcarbonate,
from Solvionic) was used as electrolyte. Coin cells were sealed using a MSK 160D Crimper and were rested overnight before testing. Cell cycling was performed in temperature-controlled condition (at 0, 22, and 40°C inside a Binder MK56 temperature chamber), monitored by a VMP™ system (Biologic) in a CCCV (constant current constant voltage) mode. Charge – discharge tests were carried out between 2.1 – 4.3V versus Li+/Li, beginning by 3 slow charge– discharge cycles at 0.68mA/cm² (C/6 rate) as formation cycles and followed by successive discharges from 0.34 to 68mA/cm² (C/12.5 to 16.6C rate), separated by charge done in all cases at 0.68mA/cm² (C/6 rate) and ending by a floating at 4.3V. Below, specific capacities are given per gram of active material. Three coin cells at least were assembled for each electrode and temperature condition. Measurements were also done at 10 and 30°C (not shown here for the sake of clarity) and these extra measurements, although not as complete as those shown in the paper, were in line with the observed trends.
Qualitative interpretation of the electrochemical performance. – The influences of the C-rate,
electrode parameters such as additives content, porosity, mass loading, and the temperature, are illustrated in Figure2a-c with discharge capacity vs. areal current density plots for selected electrodes. Voltage vs. capacity plots are shown in the Supporting Information for NA2 and NA2b (Figure S1) and for NA7 and NA7b (Figure S2).
Figure 2. Specific discharge capacity vs. areal current density for the NA2, NA2b, NA7 and NA7b cells at (a) 0,
(b) 22, and (c) 40°C. (d) Specific discharge capacity delivered at 1.66C for the different cells at the three temperatures.
As generally observed, the discharge capacity decreases with increasing the current density. The decrease is moderate up to a critical current (I*) for which there is a sudden drop in capacity. I* marks the transition between two different limitation regimes. For currents lower than I*, the discharge capacity decrease is mostly due to the cell polarization that grows with increasing current [21,36-38]. The resulting shift in potential leads to a shorter discharge. For currents larger than I*, the discharge capacity is limited by the lithium salt diffusion kinetics within the electrolyte in the electrode porosity [10-14,19-21,39] as for the reasons given in the PDM section. This is well illustrated on the voltage vs. capacity plots in Figure S1 and S2. The comparison of the C/12 and C/1.7 curves clearly show that the lower capacity at C/1.7 is the result of a brutal voltage drop ending the discharge before its completion. As also generally
observed, a decrease in temperature tends to a decrease in capacity and I* occurs for a weaker current. This is mostly because the electrolyte salt diffusivity is slower at lower temperature, which impedes the replenishment of salt species in the electrode pores. Moreover, the electronic transport within the electrode is also likely decreased at lower temperature, which may also contribute to the decrease in capacity.
The power performance of the different electrodes can be more easily compared in Figure 2d where the capacity discharged at 6.8mA/cm² (1.7C rate) is reported at the three temperatures. It can be observed that the NAx electrodes (NA2, NA8 and NA7), in which the CB/PVdF mixture is not percolated, show roughly equal (at 0°C) or higher (at 22 and 40°C) practical capacities than NAxb ones (NA2b and NA7b) in which the CB/PVdF phase is well percolated. This trend is opposite to previous experimental works on others active materials such as LiCoO2
[40,41], Li1.1V3O8 [42], LiMn2O4 [43], LiFePO4 [44], LiNi0.8Co0.15Al0.05O2 [45], or reviews
[46]. These studies indicate that the percolation of the electron-conducting network, here the CB/PVdF mixture, is a must to achieve both high nominal capacity and good power performance. The present result thus indicates that the intrinsic electronic conductivity of the NMC532 is sufficiently high that it is not necessary to create an extrinsic percolating electronic conductive network around this active material. The amount of CB/PVdF contained in the electrodes of the NAxb series is then excessive and probably penalizes the diffusion of the electrolyte species through the electrode by increasing the tortuosity of the porosity [25,47-49]. Dense electrodes generally have better electronic wiring but poorer ionic wiring of the active mass. Generally, an optimal porosity exists for which the best compromise is realized between the electronic and the ionic wirings [11,50-52]. Here, decreased capacities are seen at 0 and 22°C when the porosity is decreased from 28% for NA2 to 21% for NA7, and from 26% for NA2b to 19.1% for NA7b. This result confirms that the main limitations of the rate performance is the lithium salt depletion phenomenon at currents higher than I*. At 40°C, the difference in
capacity between NA2 and NA7 is minimized, likely due to improved electrolyte diffusivity at higher temperature. An unexpected result is observable for the NAxb series electrodes. Indeed, the performances at 40°C appear barely equal (case of NA7b), or even lower (case of NA2b) than those at 20°C. Noteworthy, Figure S1 and S2 show that the polarization (the iR drop), which manifests by a potential difference of the initial operating voltage at high current (or C-rate) versus the operating voltage at low current (or low C-C-rate), is nearly independent of the electrode CB/PVdF content. The unexpected poor performance at high temperature could be due to the more significant absorption of the electrolyte solvent by the PVdF binder at higher temperature in the CB/PVdF rich electrodes [53-57], accentuating the diffusion limitations, as further discussed below.
The nominal capacities, hereafter named Q0, that were obtained at the lowest measured current,
0.34mA/cm² (C/12.5) are plotted in Figure 3. At low current, the capacity is generally much less dependent of the electrode parameters such as thickness and porosity, and of the electrode formulation, than at higher current. Except for the cases where the electrode has fairly inhomogeneous distribution of its components [58], and/or is loosely and insufficiently calendered [11], and/or has not well-balanced formulation (excess of binder or lack of conductive additive) [59], the nominal capacity mostly reflects the intrinsic kinetic limitations of the active material. Here, Q0 values globally tend to increase at increasing temperature,
meaning it is easier for the reaction to proceed in the bulk of the active material hence maximizing higher utilization. According to Kasnatscheew et al. [60], the kinetic hindrance to the lithiation process at high lithiation state likely explains that higher Q0 values are obtained
at higher temperature due to improved active material intrinsic kinetics. On the whole, NAxb electrodes have higher nominal capacities at lower temperatures than NAx ones, and in the latter series NA2 has higher Q0 than NA8 and NA7. At higher temperature, however, the
for NAx may reflect the better electronic wiring in the former electrodes due to the better percolation of the CB/PVdF mixture. This way, the higher Q0 for NA2 than for the more
calendered NA8 and NA7 might indicate a detrimental influence of the fragmentation of the NMC clusters into primary grains on the electronic wiring of the active mass. The inversion of the hierarchy at high temperature between NAxb and NAx electrodes suggests a detrimental influence of an excess in CB/PVdF mixture on the accessibility of the active material for these temperatures. This could be attributable to the swelling of the PVdF consecutive to an electrolyte solvent absorption [53-57], leading to a closure of certain pores.
Figure 3. Average nominal discharge capacities (taken at 0.34mA/cm², C/12.5 rate), Q0, at the different
temperature for NA2, NA8, NA7, NA2b and NA7b.
Quantitative analysis of the electrochemical performance with the penetration depth model
– Three approaches were performed in the fitting of experimental results with equation (6): adjusting D0, adjusting T, or adjusting ε. D0 was first used as the fitting parameter and is
hereafter written D0,fit. This corresponds to case 1 in Table 3, which reports the values
considered for the different parameters in equation (6) for performing the fits.
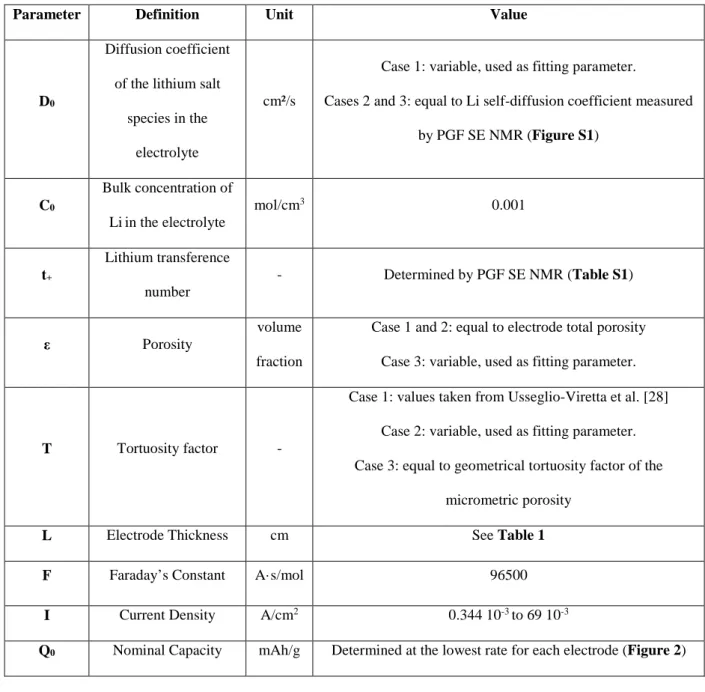
Table 3. Definition, unit and value of the PDM equation.
Parameter Definition Unit Value
D0
Diffusion coefficient of the lithium salt
species in the electrolyte
cm²/s
Case 1: variable, used as fitting parameter.
Cases 2 and 3: equal to Li self-diffusion coefficient measured by PGF SE NMR (Figure S1) C0 Bulk concentration of Liin the electrolyte mol/cm3 0.001 t+ Lithium transference number - Determined by PGF SE NMR (Table S1) ε Porosity volume fraction
Case 1 and 2: equal to electrode total porosity Case 3: variable, used as fitting parameter.
T Tortuosity factor -
Case 1: values taken from Usseglio-Viretta et al. [28] Case 2: variable, used as fitting parameter. Case 3: equal to geometrical tortuosity factor of the
micrometric porosity
L Electrode Thickness cm See Table 1
F Faraday’s Constant A·s/mol 96500
I Current Density A/cm2 0.344 10-3 to 69 10-3
Q0 Nominal Capacity mAh/g Determined at the lowest rate for each electrode (Figure 2)
For this first case, we considered the total porosity of the electrodes and a tortuosity factor from a well-established literature [28]. We used the lower bound of the modified Bruggeman-type function established by Usseglio-Viretta et al. for a NMC532–based electrode (See Figure 4 in reference Erreur ! Signet non défini.)
This trend was determined through numerical simulation by solving the Laplace steady-state diffusion equation within the pore network of the 3D electrode geometries reconstructed from X-ray computed tomography data for the NMC phase and mathematically generated carbon/binder domains in the empty spaces of the NMC phase [28]. The trend of equation (7) corresponds to a film-like morphology where the carbon/binder phase is preferentially layered at the NMC cluster surface. Another trend giving higher tortuosity values was found for a finger-like morphology where the carbon/binder domains are more protruding into the porosity. Noteworthy, these trends were obtained for electrodes with porosities in the 33 – 52 % range [28].
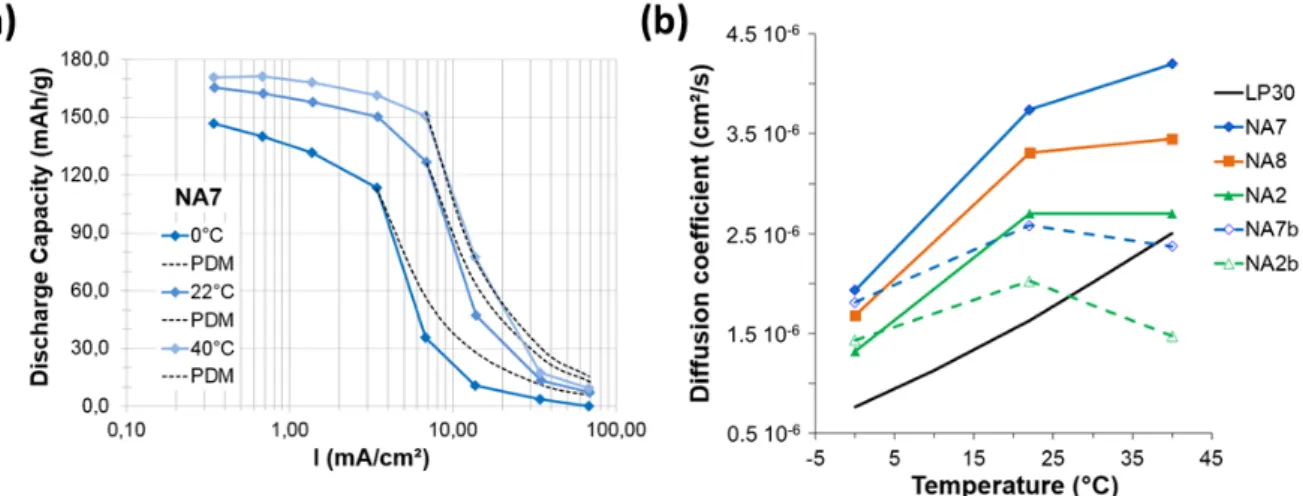
The matching between the experimental and calculated capacities with the PDM equation are shown for NA7 as examples at the different temperatures in Figure 4a. The fit of the experimental curves with equation (6) was carried out only for the currents equal or higher to I* since by definition this model only considers the limitation of capacity induced by the diffusion of lithium salt. As we can see, the model pretty well predicts the drop in capacity at I*. A modest deviation between the model and the experimental curve is observed for the highest currents which can result from additional limitations brought by the strong polarization of the cell. The effective diffusion coefficients, D0,fit, extracted from this fitting procedure are
gathered for all electrodes as a function of the temperature in Figure 4b and compared to the Li self-diffusion coefficient in the bulk electrolyte D0, which were measured by PFG-SE NMR
(Supporting Information). The order of magnitude as well as the temperature dependence of the effective diffusion coefficients are close to that of the diffusion coefficient determined by NMR on the bulk electrolyte (i.e. not confined in the porosity of the electrode), except for singular cases (vide infra). These observations are encouraging because they support the validity of the approach intended here since all the parameters used in the PDM equation are justified from
the point of view of the properties of the electrolyte (C0, D0 and t+) and the microstructure of
the electrode (L, T and ε). This confirms that the sudden drop in discharge capacity with the increase of the current beyond the I* is due to the diffusional limitations in the electrode. Strikingly, the effective diffusion coefficients D0,fit are higher than D0. This may indicate that
the tortuosity factor values considered to perform the modeling are too high for the electrodes studied here. This difference between D0,fit and D0 could be due to the decrease in the viscosity
of the electrolyte following the decrease in the concentration of lithium salt in the electrolyte with the establishment of the concentration gradient in the porosity of the electrode at high currents. In this hypothesis, the difference between D0,fit and D0, which is approximately by a
factor 2, would correspond to a reduction in the salt concentration by a factor of approximately 10 [61,62], which is difficult to conceptualize. Furthermore, the difference between D0,fit and
D0 appears to depend on the formulation of the electrode or its porosity, which invites to study
the question differently. Before that, we can notice that the effective diffusion coefficients tend to increase less rapidly than the bulk diffusion coefficient with increasing temperature between 22 and 40°C (case of NA7 and NA8), or even tend towards a plateau value (case of NA2 and NA7b), or even decrease (case of NA2b). We attribute it to the swelling of the PVdF by the electrolyte solvent (vide infra).
Figure 4. (a) Specific discharge capacities as a function of the areal current density for NA7 and the corresponding
PDM fits (dotted line) at different temperatures: 0°C, 22°C and 40°C. (b) Determined values for Deff from equation
(6) with tortuosity values determined with equation (7) according to Usseglio-Vireta et al. [28] and electrode total porosity.
In a second step, we then sought to determine an effective tortuosity factor for each electrode, which was therefore the variable parameter in equation (6), taking as the diffusion coefficient that of the bulk electrolyte and considering the electrode total porosity (Case 2 in Table 3). The matching between the experimental and calculated capacities with the PDM equation are shown for NA7b as examples at the different temperatures in Figure 5a. The effective tortuosity factors, Tfit, extracted from this fitting procedure are gathered for all electrodes as a function of
the temperature in Figure 5b. The horizontal lines correspond to the micrometric and nanometric porosity geometrical tortuosity factors, which were calculated with equation (4) and the geometrical tortuosity values determined on the FIB/SEM electrode volumes (mean values in Table 2). Micrometric pores are formed by the large cavities (more than 60nm) in the stacking of NMC clusters and nanometric pores (less than 60nm) are confined within the CB/PVdF mixture and at the grain boundary cracks of fragmented NMC clusters.
The majority of the results lie in between these two realistic bounds, indicating that the Tfit
micrometric and nanometric porosity. At 0 and 22°C, Tfit values are, however, more typical of
the micrometric porosity. Tfit also appear to increase at increasing temperature, especially for
NAxb electrodes that contain more CB/PVdF. This trend could be due to some swelling of the CB/PVdF mixture by the electrolyte. Indeed, Saunier et al. [53] found that dense PVdF films could absorb increasing liquid electrolyte amounts with increasing temperature. For example, at 40°C, the swelling ratio of PVdF by DMC/EC is ~125%. However, only a small amount of salt permeates through the polymer and the salt concentration in the electrolyte trapped in the gel is much lower than the salt concentration in the bulk electrolyte, 0.2 vs. 1.0 M respectively. In the case of porous electrodes with PVdF binder, this differential trapping of electrolyte species in the PVdF may be at the origin of a decrease of the ionic diffusivity, due to the increase of the salt concentration in the electrolyte within the porous phase, a modification of the salt dissociation, and of the increase of the swollen CB/PVdF phase volume. The latter phenomenon may lead to the more drastic effect if some pores are clogged by the swollen CB/PVdF phase in which diffusion is ultra-slow. For example, Kataoka et al. [54] found that the conduction mechanism of a PVdF porous membrane infiltrated by a liquid electrolyte is essentially dominated not by the solution-rich region, which are trapped in the cavities of the membrane, but by the polymer-rich region of the swollen polymer, which are forming the walls of the cavities.
Figure 5. (a) Specific discharge capacities as a function of the areal current density for NA7b and the
corresponding PDM fits (dotted lines) at different temperatures: 0°C, 22°C and 40°C. (b) Determined values for Tfit from equation 6 with electrolyte bulk diffusion coefficient and electrode total porosity. The horizontal dotted
lines correspond to the mean geometrical tortuosity factors of the nanometric and micrometric porosity.
All these observations led us the third approach to perform the fit (Case 3 in Table 3). We sought to determine an effective porosity for each electrode, which was therefore the variable parameter in equation (6), taking as the diffusion coefficient that of the Li+ in the bulk electrolyte (Figure S1) and considering as the tortuosity factor that of micrometric porosity (taken equal to 1.2 for all samples). In this third approach, we are making the hypothesis that the homogenization of the concentration of the electrolyte species in the electrode is made possible mainly via the channels formed by the micrometric pores at high rate (high current density). These are large and of low tortuosity, which allows a greater number of species to diffuse more rapidly, than in the smaller and more tortuous channels formed by confined nanometric pores. This hypothesis is supported by the fact that the values of Tfit are quite
representative of the micrometric porosity in Figure 5b. The critical influence of the percolated micrometric porosity on ionic conductivity of CB/PVdF/alumina porous composite materials was also experimentally evidenced previously [63]. The result of the fit will be a value of effective porosity. The matching between the experimental and calculated capacities with the PDM equation are shown for NA2 as examples at the different temperatures in Figure 6a. The
effective porosity, εfit, extracted from this fitting procedure are gathered for all electrodes as a
function of the temperature in Figure 6b-e. The horizontal lines correspond to the total porosity and to the percolated micrometric porosity extrapolated from the FIB/SEM volumes. Precisely, the values reported are not those calculated on the FIBSEM volumes, because the compositions of the latter are not representative of those of the corresponding electrodes as underlined in section Electrodes Compositions and Microstructures. However, a very clear relationship has been established between the total porosity of the FIB/SEM volumes and the percolated micrometric porosity inside these FIB/SEM volumes (for this see Figure 4 in reference [15] and Figure 7g in reference [16]), which is given by equation (8), and which was used to estimate the micrometric porosity percolated, εmicro, in the electrodes from their total porosity.
𝜖𝜖𝑚𝑚𝑚𝑚𝑚𝑚𝑚𝑚𝑚𝑚 = 1.25𝜖𝜖 − 10.3 (19 < ε < 28%) (8)
All εfit values are lower than the total porosity (Figure 6b-e), suggesting that the entire porosity
of the electrode may not participate effectively in the homogenization of the salt concentration.
Figure 6. (a) Specific discharge capacities as a function of the areal current density for NA2 and the corresponding
PDM fits (dotted lines) at different temperatures: 0°C, 22°C and 40°C. (b-f) Determined values for εfit from
equation (6) with electrolyte bulk diffusion coefficient and tortuosity factor equal to 1.2 for NA2 (b), NA8 (c), NA7 (d), NA2b (e), and NA7b (f).
The εfit values are closer to the percolated micrometric porosity, in particular for NA8 and NA7
electrodes, for which a fairly good match is observed at all temperatures except at 40°C. For the other electrodes, εfit is equal or close to the percolated micrometric porosity at low
temperature, then drops, and all the more severely as the electrodes contain CB/PVdF, which can be attributed as we have seen previously to the swelling of CB/PVdF mixture by the solvent of the electrolyte [53,54], which would result in a closure of certain pores. For NA7b and NA2b the phenomenon would be so critical that the effective percolated micrometric porosity would be decreased at a very low volume fraction at 40°C, of the order of 6-7% of the volume of the electrode. This certainly does not mean that the micrometric porosity decreases that much with temperature, but rather illustrates how effective or useful porosity decreases with temperature. The swelling of the CB/PVdF domains may create zones of congestions that would harm the proper functioning of the micrometric porosity network with respect to the diffusion of the electrolyte species, for example by breaking its percolation. This gives the picture that these are “defect points” that might be the cause of premature brutal capacity drop with the increase of the current beyond a critical current. Observation of the cross-section of the electrodes shows that there is an alternation of non-fractured and fractured NMC cluster (Figure 1a and c). There is therefore in the porous network an alternation of micrometric porosity type zone and more confined porosity type zone. The latter are bottlenecks between distinct microporous regions, which may only block the massive and rapid diffusion of electrolyte species.
Finally, Figure 7 shows the influence of the active mass loading with the three electrodes NA3b, NA7b and NA4b that all have same composition and porosity but different active mass loadings, respectively 15, 25 and 40 mg.cm-2. The cells performance at 22°C are plotted as areal
capacities to better illustrate the differences in active mass loadings. The fitting was performed as in the third approach above. One can see that equation (6) again well captures the capacity
decrease at and above I*. Moreover, NA3b, NA7b and NA4b tend to have the same εfit,
respectively 12, 11 and 10%. As they have same composition and density, their microporosity is expected to be similar, about 13.6% according to equation (8). This trend of slightly decreasing εfit values with increased thickness (active mass loading) is somehow expected.
Indeed, the increased thickness could increase the probability of the “defect points” aforementioned above.
Figure 7. Areal discharge capacities as a function of the areal current density for NA3b, NA7b and NA4b and
the corresponding PDM fits (dotted lines) at temperature 22°C.
Discussion and conclusion
We have confirmed here that the limited penetration depth model, also called the diffusion limited current density model, of Gallagher et al. [13] and Heubner et al. [14] is very useful tool for assessing the power performance of porous composite electrodes and for predicting the sudden drop in the accessible capacity when the current reaches the critical value, I*, for which the diffusional limits of the electrolyte occur. The reliability of this tool lies in the choice of its parameters, and in particular of the tortuosity factor and the effective porosity of the electrode. We sought to confront these with a fine analysis of the microstructure of the electrodes by FIB/SEM nanotomography [15] and their transport properties using numerical simulations [16].
As there are pores of clearly distinct sizes and tortuosity, it is not easy to discern a priori the values of these two parameters which are representative of the electrodes. The results obtained in this work quite clearly suggest the preponderant role of the (percolated) network of micrometric pores (considered here having a size greater than 60nm) on the homogenization of the salt concentration in the porosity of the electrode. Indeed, the experimental data are fairly well fitted, at 0 and 22°C, by restricting the effective porosity to the percolated micrometric porosity and by taking as the value of the tortuosity coefficient a value representative of the geometric tortuosity coefficient of this micrometric porosity (Figure 6).
This does not hold, however, beyond the temperature of 40°C for which the transport properties of the electrolyte salt in the porosity of the electrode appear to be degraded. What we attribute to the swelling of PVdF by the electrolyte’s solvent, a phenomenon shown elsewhere [53-57], and which is expected to be particularly detrimental for electrodes containing a high amount of PVdF. This swelling, which can physically lead to a blockage of certain pores by the formation of gelled zones of high viscosities, would result in an increase in the tortuosity factor of the electrode and/or a decrease of percolated micrometric porosity. As can be seen in Figure 2, the power performance does not really drop at 40°C, but it increases less than expected because the microstructure of the electrode is less efficient from the point of view of its ionic transport properties. The swelling of the PVdF binder at 40°C and above may be reduced by favoring its crystallinity, which could be achieved by playing on the electrode fabrication conditions (solvent and drying rate) [64] and/or the PVdF grade [56]. Selecting another binder system less swollen by the liquid electrolyte, such as the sodium salt of carboxymethyl cellulose (CMC) or poly(acrylic acid) (PAA) [57], might be an attractive option. However, a recent study showed that at low temperature a CMC-based graphite negative electrode exhibited lower cycle performance than a PVdF-based one [65].
porosity of the electrode is not different from that in the bulk electrolyte. Our hypothesis appears reasonable with regard to the electrolyte in the micrometric porosity where the role of interactions at the solid/liquid interfaces is minimized [49].
We used global parameters like effective tortuosity and effective porosity to characterize the electrodes. It should be noted however that the electrodes are heterogeneous materials, and that it would be possible to consider different zones within the electrode characterized by different values for these effective parameters [30]. The performance of the entire electrode is certainly influenced by this heterogeneous character.
In the process of adjusting the experimental results with the PDM, we have chosen to vary only one parameter at a time to develop a scientific approach. None of the three approaches presented is, however, perfectly satisfactory. Reality, if it is identifiable, must be found at a midpoint. However, we did not identify a criterion allowing to play simultaneously on the three variables of the model and to converge towards a justified solution.
Finally, it can be noted that the power performance of the electrodes studied here does not seem to be limited by electronic transport. The absence of percolation of the CB/PVdF is not detrimental to their good electrochemical operation, which is certainly attributable to the high intrinsic conductivity of NMC532 compared to NMC333 [66]. We can even recommend reducing the amount of CB/PVdF below the minimum levels used here in the NAx series electrodes (2.2/1.8wt%) because it has been observed that a fraction of CB/PVdF (between 20 and 50%) is unnecessary because it is disseminated in the form of large and massive agglomerates.
In perspective, it would be very interesting to compare this work with the results of spatially resolved electrochemical modeling, that is to say capable, in addition to predicting the discharge curves, of describing the current distribution in the electrode at different temperatures. It is known that the lower the temperature, the slower the charge transfer reaction (interface kinetics)
and, therefore, the current distribution is forced to be more uniform across the electrode. At higher temperatures, the interface being much faster, the current distribution behaves more like a rolling wave in the depth of the electrode. It would then be very interesting to study by electrochemical modeling the influence of the formation of bottlenecks by the swollen PVdF at high temperature.
It should be noted that it is generally accepted that the calculation of the tortuosity factor from the geometric tortuosity leads to greatly underestimating the diffusional limitations within the electrode porosity. Moreover, equation (4) was established mathematically by Epstein for a bundle of sinuous but parallel pores [23], which is very different from the microstructure of electrodes constructed from more or less spherical particles. A possible significance of our results is that at high current, the effective microstructure of the electrode is reduced to its micrometric pores most parallel to the main direction of the current (perpendicular to the electrode) and that the lateral connections between these main pores participate little in the homogenization of the salt concentration gradient of the electrolyte.
Acknowledgements
We are grateful to the ANR for the funding of the Pepite project (ANR-15-CE05-0001) and for Zeon’s support during the project.
References
1 D. Bresser, K. Hosoi, D. Howell, H. Li, H. Zeisel, K. Amine, S. Passerini, “Perspectives of
automotive battery R&D in China, Germany, Japan, and the USA”, J. Power Sources, 382, 176 (2018)
2 X. Zeng, M. Li, D. Abd El-Hady, W. Alshitari, A. S. Al-Bogami, J. Lu, K. Amine,
“Commercialization of Lithium Battery Technologies for Electric Vehicles”, Adv. Energy
3 Y. Kuang, C. Chen, D. Kirsch, L. Hu, “Thick Electrode Batteries: Principles, Opportunities,
and Challenges”, Adv. Energy Mater., 9, 1901457 (2019)
4 M. Singh, J. Kaiser, H. Hahn, “Thick Electrodes for High Energy Lithium Ion Batteries”, J. Electrochem. Soc., 162, A1196 (2015).
5 B-S. Lee, Z. Wu, V. Petrova, X. Xing, H-D. Lim, H. Liu, P. Liu, "Analysis of Rate-Limiting
Factors in Thick Electrodes for Electric Vehicle Applications", J. Electrochem. Soc., 165, A525 (2018).
6 C. Heubner, M. Schneider, A. Michaelis, “Diffusion-Limited C-Rate: A Fundamental
Principle Quantifying the Intrinsic Limits of Li-Ion Batteries”, Adv. Energy Mater. 10, 1902523 (2020)
7 K. Higa, S.-L. Wu, D. Y. Parkinson, Y. Fu, S. Ferreira, V. Battaglia, V. Srinivasan,
“Comparing macroscale and microscale simulations of porous battery electrodes,” J.
Electrochem. Soc., 164, E3473, (2017).
8 M. E. Ferraro, B. L. Trembacki, V. E. Brunini, D. R. Noble, and S. A. Roberts, “Electrode
mesoscale as a collection of particles: Coupled electrochemical and mechanical analysis of NMC cathodes,” J. Electrochem. Soc., 167, 013543 (2020).
9 A. Rucci, A. C. Ngandjong, E. N. Primoa, M. Maiza, A. A. Franco, “Tracking variabilities in
the simulation of Lithium Ion Battery electrode fabrication and its impact on electrochemical performance”, Electrochimica Acta, 312, 168 (2019).
10 Johns, P. A., Roberts, M. R., Wakizaka, Y., Sanders, J. H. & Owen, J. R. How the electrolyte
limits fast discharge in nanostructured batteries and supercapacitors. Electrochem. commun. 11, 2089 (2009).
11 C. Fongy, A.C. Gaillot, S. Jouanneau, D. Guyomard, B. Lestriez, “Ionic vs Electronic Power
Limitations and Analysis of the Fraction of Wired Grains in LiFePO4 Composite Electrodes”,
J. Electrochem. Soc., 157, A885 (2010).
12 R. Cornut, D. Lepage, S.B. Schougaard, “Interpreting lithium batteries discharge curves for
easy identification of the origin of performance limitations”. Electrochim. Acta 162, 271 (2015).
13 K.G. Gallagher, S.E. Trask, C. Bauer, T. Woehrle, S.F. Lux, M. Thscech, P. Lamp, B.J.
Polzin, S. Ha, B. Long, Q. Wu, W. Lu, D.W. Dees, A.N. Jansen, “Optimizing Areal Capacities through Understanding the Limitations of Lithium-Ion Electrodes”. J. Electrochem. Soc. 163, A138 (2015).
14 C. Heubner, A. Nickol, J. Seeba, S. Reuber, N. Junker, M. Wolter, M. Schneider, A.
Michaelis, “Understanding thickness and porosity effects on the electrochemical performance of LiNi0.6Co0.2Mn0.2O2-based cathodes for high energy Li-ion batteries”. J. Power Sources 419,
119 (2019).
15 F. Cadiou, T. Douillard, N. Besnard, B. Lestriez, E. Maire, “Multi-scale characterization of
the microstructure of composite electrodes for high energy density lithium ion batteries guided by the specificities of their electronic and ion transport mechanisms”, J. Electrochem. Soc., 167, 100521 (2020).
16 F. Cadiou, T. Douillard, F. Willot, J.-C. Badot, B. Lestriez, E. Maire, “Effective electronic
and ionic conductivities of dense EV-designed NMC-based positive electrodes by FFT numerical simulations on FIB/SEM volumes”, submitted to J. Electrochem. Soc.
17 M. Doyle, T. Fuller, J. Newman, “Modeling of galvanostatic charge and discharge of the
18 M. Doyle, T. Fuller, J. Newman, “Simulation and Optimization of the Dual Lithium Ion
Insertion Cell”. J. Electrochem. Soc. 141, 1 (1994).
19 D. Y. W. Yu, K. Donoue, T. Inoue, M. Fujimoto, S. Fujitani, " Effect of Electrode Parameters
on LiFePO4 Cathodes”, J. Electrochem. Soc., 53, A835 (2006)
20 H. Zheng, J. Li, X. Song, G. Liu, V.S. Battaglia, “A comprehensive understanding of
electrode thickness effects on the electrochemical performances of Li-ion battery cathodes”.
Electrochim. Acta 71, 258–265 (2012).
21 N. Besnard, A. Etiemble, T. Douillard, O. Dubrunfaut, P. Tran-Van, L. Gautier, S. Franger,
J.-C. Badot, E. Maire, B. Lestriez, “Multiscale morphological and electrical characterization of charge transport limitations to the power performance of positive electrode blends for lithium-ion batteries”, Adv. Energy Mater. 7, 1602239 (2017).
22 B. Tjaden, D. J. L. Brett, and P. R. Shearing, “Tortuosity in electrochemical devices: a review
of calculation approaches,” International Materials Reviews, 63, 47 (2018).
23 N. Epstein, “On tortuosity and the tortuosity factor in flow and diffusion through porous
media,” Chem. Eng. Sci. 44, 777 (1989).
24 M. Ebner and V. Wood, “Tool for Tortuosity Estimation in Lithium Ion Battery Porous
Electrodes”, J. Electrochem. Soc., 162, A3064 (2015).
25 N. A. Zacharias, D. R. Nevers, C. Skelton, K. Knackstedt, D. E. Stephenson, D. R. Wheeler,
“Direct Measurements of Effective Ionic Transport in Porous Li-Ion Electrodes”, J. Electrochem. Soc., 160, A306 (2013).
26 T. DuBeshter, P. K. Sinha, A. Sakars, G. W. Fly, J. Jorne. “Measurement of tortuosity and
porosity of porous battery electrodes”, J. Electrochem. Soc. 161, A599 (2014).
27 J. Landesfeind, J. Hattendorff, A. Ehrl, W. A. Wall, H. A. Gasteiger, “Tortuosity
Determination of Battery Electrodes and Separators by Impedance Spectroscopy”, J. Electrochem. Soc. 163, A1373 (2016)
28 F. L. E. Usseglio-Viretta, A. Colclasure, A. N. Mistry, K. P. Y. Claver, F. Pouraghajan, D. P.
Finegan, T. M. M. Heenan, D. Abraham, P. Mukherjee, D. Wheeler, P. Shearing, S. J. Cooper, and K. Smith, “Resolving the Discrepancy in Tortuosity Factor Estimation for Li-Ion Battery Electrodes through Micro-Macro Modeling and Experiment,” J. Electrochem. Soc., 165, A3403 (2018).
29 B. Tjaden, S. J. Cooper, D. J. L. Brett, D. Kramer, P. R Shearing, “On the origin and
application of the Bruggeman correlation for analysing transport phenomena in electrochemical systems”, Current Opinion in Chemical Engineering, 12, 44 (2016).
30 D. Kehrwald, P. R. Shearing, N. P. Brandon, P. K. Sinha, and S. J. Harris, “Local tortuosity
inhomogeneities in a lithium battery composite electrode,” J. Electrochem. Soc., 158, A1393 (2011).
31 S. J. Harris and P. Lu, “Effects of inhomogeneities—nanoscale to mesoscale—on the
durability of Li-ion batteries,” J. Phys. Chem. C, 117, 6481 (2013).
32 F. Cadiou, F. Willot, B. Lestriez, T. Douillard, A. Etiemble, J-C. Badot, O. Valentin, E. Maire,
"Numerical simulation of effective electrical conductivity of Lithium-ion battery positive electrodes”, J. Electrochem. Soc., 166, A1692 (2019).
33 C.-J. Bae, C. K. Erdonmez, J. W. Halloran, Y.-M. Chiang, “Design of Battery Electrodes with
Dual-Scale Porosity to Minimize Tortuosity and Maximize Performance”, Adv. Mater., 25, 1254 (2013).
34 D. Robert, T. Douillard, A. Boulineau, G. Brunetti, P. Nowakowski, D. Venet, P.
Bayle-Guillemaud, and C. Cayron, “Multiscale Phase Mapping of LiFePO4-Based Electrodes by
Transmission Electron Microscopy and Electron Forward Scattering Diffraction,” ACS Nano,
7, 10887 (2013).
35 D.P. Singh, F.M. Mulder, A.M. Abdelkader, M. Wagemaker, “Facile Micro Templating
LiFePO4 Electrodes for High Performance Li-Ion Batteries” Adv. Energy Mater., 3, 572 (2013). 36 M. Gaberscek, “Towards optimized preparation of cathode materials: How can modeling and
concepts be used in practice” J. Power Sources, 189, 22 (2009).
37 N. Ogihara, Y. Itou, T. Sasaki, Y. Takeuchi, “Impedance Spectroscopy Characterization of
Porous Electrodes under Different Electrode Thickness Using a Symmetric Cell for High-Performance Lithium-Ion Batteries”, J. Phys. Chem. C, 119, 4612 (2015).
38 C. Fongy, S. Jouanneau, D. Guyomard, J-C. Badot, B. Lestriez, “Electronic and Ionic Wirings
Versus the Insertion Reaction Contributions to the Polarization in LiFePO4 Composite
Electrodes” J. Electrochem. Soc., 157, A1347 (2010).
39 Y. Orikasa, Y. Gogyo, H. Yamashige, M. Katayama, K. Chen, T. Mori, K. Yamamoto, T.
Masese, Y. Inada, T. Ohta, Z. Siroma, S. Kato, H. Kinoshita, H. Arai, Z. Ogumi, Y. Uchimoto, “Ionic Conduction in Lithium Ion Battery Composite Electrode Governs Cross-sectional Reaction Distribution”, Sci. Rep., 6, 26382 (2016).
40 S. Kuroda, N. Tobori, M. Sakuraba, Y. Sato, “Charge-discharge properties of a cathode
prepared with ketjen black as the electro-conductive additive in lithium ion batteries”, J. Power
Sources 119–121, 924 (2003).
41 K. Kuratani, K. Ishibashi, Y. Komoda, R. Hidema, H. Suzuki, H. Kobayashi, “Controlling of
dispersion state of particles in slurry and electrochemical properties of electrodes”, J.
Electrochem. Soc. 166, A501 (2019).
42 E. Ligneel, B. Lestriez, A. Hudhomme, D. Guyomard, “On the origin of the pre-plasticizer
effect of the composite electrode for lithium batteries”, Electrochem. Solid-State Lett., 154, A235 (2007).
43 M. G. Lazarraga, S. Mandal, J. Ibañez, J.,Manuel Amarilla, J. M. Rojo, “LiMn
2O4-based
composites processed by a chemical-route: Microstructural, electrical, electrochemical, and mechanical characterization” J. Power Sources 115, 315 (2003).
44 G. Guzmán, J. Vazquez-Arenas, G. Ramos-Sánchez, M. Bautista-Ramírez, I. González,
“Improved performance of LiFePO4 cathode for Li-ion batteries through percolation studies”, Electrochim. Acta 247, 451 (2017).
45 H.Y. Tran, G. Greco, C. Täubert, M. Wohlfahrt-Mehrens, W. Haselrieder, A. Kwade,
“Influence of electrode preparation on the electrochemical performance of LiNi0.8Co0.15Al0.05O2
composite electrodes for lithium-ion batteries”, J. Power Sources 210, 276 (2012).
46 Y. Wang, X. Fu, M. Zheng, W. H. Zhong, G Cao, “Strategies for Building Robust Traffic
Networks in Advanced Energy Storage Devices: A Focus on Composite Electrodes”, Adv.
Mater. 31, 1 (2019).
47 H. Zheng, R. Yang, G. Liu, X. Song, V. S. Battaglia, “Cooperation between Active Material,
Polymeric Binder and Conductive Carbon Additive in Lithium Ion Battery Cathode”, J. Phys.
Chem. C, 116, 4875 (2012).
48 J. Landesfeind, A. Eldiven,, H. A. Gasteiger, “Influence of the Binder on Lithium Ion Battery
49 S. J. Tambio, M. Deschamps, V. Sarou-Kanian, A. Etiemble, T. Douillard, E. Maire, B.
Lestriez, “Self-Diffusion of Electrolyte Species in Model Battery Electrodes Using Magic Angle Spinning and Pulsed Field Gradient Nuclear Magnetic Resonance”, J. Power Sources,
362, 315 (2017).
50 H. Zheng, G. Liu, X. Song, P. Ridgway, S. Xun, V. S. Battaglia, “Cathode Performance as a
Function of Inactive Material and Void Fractions”, J. Electrochem. Soc., 157, A1060 (2010).
51 C. Lim, B. Yan, H. Kang, Z. Song, W. Chao Lee, V. De Andrade, F. De Carlo, L. Yin, Y.
Kim, L. Zhu, “Analysis of geometric and electrochemical characteristics of lithium cobalt oxide electrode with different packing densities”, J. Power Sources, 328, 46 (2016).
52 K. Kitada, H. Murayama, K. Fukuda, H. Arai, Y. Uchimoto, Z. Ogumi, E. Matsubara,
“Factors determining the packing-limitation of active materials in the composite electrode of lithium-ion batteries”, J. Power Sources, 301, 11 (2016).
53 J. Saunier, F. Alloin, J. Y.,Sanchez, B. Barrière, “Plasticized Microporous Poly(vinylidene
fluoride) Separators for Lithium-Ion Batteries. I. Swelling Behavior of Dense Membranes with Respect to a Liquid Electrolyte - Characterization of the Swelling Equilibrium”, J. Polym. Sci.
Part B Polym. Phys. 42, 532 (2004).
54 H. Kataoka, Y. Saito, T. Sakai, E. Quartarone, P. Mustarelli, “Conduction mechanisms of
PVDF-type gel polymer electrolytes of lithium prepared by a phase inversion process”. J. Phys.
Chem. B, 104, 11460 (2000).
55 W-R. Liu, M-H. Yang, H-C. Wu, S. M. Chiao, N-L. Wu, “Enhanced Cycle Life of Si Anode
for Li-Ion Batteries by Using Modified Elastomeric Binder, Electrochem. Solid-State Lett., 8, A100 (2005).
56 C-C. Chang, L-J. Her, T-K. Chen, L-C. Chen, J-L. Hong, “The Influence of Different
Electrode Fabrication Methods and Poly(Vinylidene Fluoride) Binders on The Anode Electrode Dimension Stability and Cyclability in Lithium-Ion Batteries”, J. New Materials for
Electrochemical Systems, 11, 43 (2008)
57 A. Magasinski, B. Zdyrko, I. Kovalenko, B. Hertzberg, R. Burtovyy, C. F. Huebner, T. F.
Fuller, I. Luzinov, and G. Yushin, “Toward Efficient Binders for Li-Ion Battery Si-Based Anodes: Polyacrylic Acid”, Applied Materials & Interfaces, 2, 3004 (2010).
58 E. Ligneel, B. Lestriez, A. Hudhomme, D. Guyomard, “Effects of the solvent concentration
(solid loading) on the processing and properties of the composite electrode”. J. Electrochem.
Soc. 154, 235 (2007).
59 D. Guy, B. Lestriez, R. Bouchet, D. Guyomard, “Critical role of polymeric binders on the
electronic transport properties of composites electrode”, J. Electrochem. Soc., 153, A679 (2006).
60 J. Kasnatscheew, M. Evertz, B. Streipert, R. Wagner, R. Klöpsch, B. Vortmann, H. Hahn, S.
Nowak, M. Amereller, A.-C. Gentschev, P. Lamp, M. Winter, “The truth about the 1st cycle
Coulombic efficiency of LiNi1/3Co1/3Mn1/3O2 (NCM) cathodes” Phys. Chem. Chem. Phys. 18,
3956 (2016).
61 S. A. Krachkovskiy, A. D. Pauric, I. C. Halalay, G. R. Goward, “Slice-selective NMR
diffusion measurements: A robust and reliable tool for in situ characterization of ion-transport properties in Lithium-ion battery electrolytes”, J. Phys. Chem. Lett. 4, 3940 (2013).
62 J. Landesfeind and H. A. Gasteiger, “Temperature and Concentration Dependence of the
Ionic Transport Properties of Lithium-Ion Battery Electrolytes”, J. Electrochem. Soc., 166, A3079 (2019).
63 E. Panabière, J.-C. Badot, O. Dubrunfaut, A. Etiemble, B. Lestriez, “Electronic and ionic
dynamics coupled at solid-liquid electrolyte interfaces in carbon black-polyvinylidene fluoride-γ alumina porous composites”, J. Phys. Chem. C, 121, 8364 (2017).
64 M. Yoo, C. W. Frank, S. Mori, S. Yamaguchi, “Effect of poly(vinylidene fluoride) binder
crystallinity and graphite structure on the mechanical strength of the composite anode in a lithium ion battery”, Polymer, 44, 4197 (2003).
65 E. Ji-Yong, C. Lei, “Effect of anode binders on low-temperature performance of automotive
lithium-ion batteries”, J. Power Sources, 441, 227178 (2019).
66 R. Amin, Y-M. Chiang, “Characterization of Electronic and Ionic Transport in Li 1-xNi0.33Mn0.33Co0.33O2 (NMC333) and Li1-xNi0.50Mn0.20Co0.30O2 (NMC523) as a Function of Li


![Table 2. quantitative morphological parameters determined by image analysis on the FIB/SEM volumes [15] and effective electrical properties calculated by numerical simulations on the FIB/SEM volumes [16]](https://thumb-eu.123doks.com/thumbv2/123doknet/11552392.296558/14.892.102.800.170.707/quantitative-morphological-parameters-determined-electrical-properties-calculated-simulations.webp)