HAL Id: tel-02425999
https://tel.archives-ouvertes.fr/tel-02425999
Submitted on 1 Jan 2020HAL is a multi-disciplinary open access archive for the deposit and dissemination of sci-entific research documents, whether they are pub-lished or not. The documents may come from teaching and research institutions in France or abroad, or from public or private research centers.
L’archive ouverte pluridisciplinaire HAL, est destinée au dépôt et à la diffusion de documents scientifiques de niveau recherche, publiés ou non, émanant des établissements d’enseignement et de recherche français ou étrangers, des laboratoires publics ou privés.
for the treatment of indoor air in medical environments
Henrietta Essie Whyte
To cite this version:
Henrietta Essie Whyte. Evaluation of the performance of photocatalytic systems for the treatment of indoor air in medical environments. Chemical and Process Engineering. Ecole nationale supérieure Mines-Télécom Atlantique, 2018. English. �NNT : 2018IMTA0112�. �tel-02425999�
T
HESE DE DOCTORAT DE
L
’É
COLEN
ATIONALES
UPERIEUREM
INES-T
ELECOMA
TLANTIQUEB
RETAGNEP
AYS DE LAL
OIRE-
IMT
A
TLANTIQUECOMUE UNIVERSITE BRETAGNE LOIRE
ECOLE DOCTORALE N°602
Sciences pour l'Ingénieur
Spécialité : « Génie des procédés et bioprocédés»
Par
« Henrietta Essie WHYTE»
« Evaluation of the performance of photocatalytic systems for the
treatment of indoor air in medical environments »
Thèse présentée et soutenue à « IMT Atlantique», le « 7 Décembre 2018 » Unité de recherche : GEPEA UMR CNRS 6144
Thèse N° : 2018IMTA0112
Rapporteurs avant soutenance :
Caroline ANDRIANTSIFERANA Maitre de conférences, HDR, Université Paul Sabatier Thierry PIGOT Professeur, Université de Pau
Composition du Jury :
Président : Evelyne GONZE Professeur, Université de Savoie
Examinateurs : Caroline ANDRIANTSIFERANA Maitre de conférences, HDR, Université Paul Sabatier
Thierry PIGOT Professeur, Université de Pau
Dir. de thèse : Valérie HEQUET Professeur, IMT Atlantique
Co-dir. de thèse : Albert SUBRENAT Enseignant chercheur, HDR, IMT Atlantique
Co-encadrant : Cécile RAILLARD Maitre de conférences, Université de Nantes
Invité(s)
This work is dedicated to my parents Henry and Essie, my brother Henry Jnr and to Christine Cinier
My greatest appreciation goes to God who endowed me with enough wisdom and grace to complete this PhD.
I would like to thank IMT Atlantique and ATA Medical for the financial support provided during the course of this PhD.
My special and profound thanks go to my supervisors Pr. Valérie HEQUET, Dr. Cécile RAILLARD and Dr. Albert SUBRENAT for their guidance, support, advice and help without which this work would not have been completed. Most importantly I would like to thank them for their immense patience, I appreciate this greatly.
I would also like to thank Pr. Yves ANDRES the head of the department and Pr. Laurence LE COQ the head of research for their hospitality and for allowing me to work in excellent conditions throughout these three years. Thank you Yves for also agreeing to present my poster at IAQ conference 2018.
I thank Mr. Pascal MISMAQUE the president of ATA medical for his help in diverse ways during the course of this work.
I would also like to thank Dr. Caroline ANDRIANTSIFERANA and Pr. Thierry PIGOT for accepting to review my work and to Pr. Evelyn GONZE for agreeing to be a member of the jury.
All the experimental work could not have been done without the invaluable help of the technical team for this I am very grateful to Eric CHEVREL, Patrick BRION, Francois-Xavier BLANCHET, Yvan GOURIOU and Katell CHAILLOU. I would also like to thank Eric DUMONT for his help with the modelisation.
These 3 years were particularly pleasant, interesting and eventful thanks to the other PhD and post doctoral students and friends. So I thank Jenny, Ana-Maria, Chantal, Victor, Agustina, Guillaume, Mouna, Hend, Marwaa, Manel, Ronke, Zipporah, Thibault, Kevin, Rachid, Sylvester , Mexi, Manuel, Getnet and Walid.
I would also like to thank my parents and my brother whose love, care, support and advice saw me through these three years.
Lastly, my heartfelt thanks go to Mathieu Cinier who provided me with immense support and encouragement whenever I had doubts.
ACKNOWLEDGEMENTS ... iii
CONTENTS ... iv
LIST OF FIGURES ... vii
LIST OF TABLES ... xi
NOMENCLATURE ... xiii
ABBREVIATIONS ... xv
SCIENTIFIC PRODUCTION ... xvii
RESUME EN FRANCAIS ... xix
GENERAL INTRODUCTION ... 1
CHAPTER I: MANAGEMENT OF INDOOR AIR QUALITY IN MEDICAL ENVIRONMENTS ... 7
I.1 Introduction ... 8
I.2 Indoor air quality in hospitals ... 8
I.2.1 Sources of chemical pollutants in hospitals ... 10
I.2.2 Indoor air quality in operating rooms ... 14
I.3 Photocatalytic Oxidation (PCO) ... 24
I.3.1 Principles of PCO ... 24
I.3.2 Photocatalytic reactors used for the study of gas phase PCO ... 27
I.3.3 Parameters influencing PCO efficiency ... 29
I.3.4 Performance evaluation of PCO ... 36
I.4 Choice of performance indicators ... 38
I.5 Choice of target compounds ... 38
I.6 Conclusion on the literature review and objectives of this work ... 39
I.7 References ... 41
CHAPTER II: EXPERIMENTAL MATERIALS AND METHODS ... 52
II.1 Introduction ... 53
II.2 Experimental devices ... 53
II.2.1 Pollutant generation system ... 53
II.2.2 Multi-pass photocatalytic reactor ... 56
II.2.3 Sampling and analytical methods ... 68
II.2.4 Protocol for a photocatalytic degradation in the multi-pass reactor ... 76
II.2.5 Validation of the multi-pass rector ... 77
II.3 Loading of media surface with particles ... 79
II.4 Experimental Method ... 80
II.4.1 Experimental strategy ... 80
II.4.2 Model used for the calculation of the performance indicator ... 81
FROM MEDICAL ENVIRONMENTS ... 87
III.1 Introduction ... 88
III.2 Degradation profiles of target compounds ... 89
III.2.1 Acrylonitrile degradation profile ... 89
III.2.2 Isoflurane degradation profile ... 90
III.2.3 Conclusions on degradation behavior of target compounds ... 92
III.3 Determination of indicators for the evaluation of the influence of the operating parameters ... 93
III.3.1 Acrylonitrile single-pass removal calculation ... 94
III.3.2 Determination of isoflurane indicators ... 96
III.4 Influence of the operating parameters ... 98
III.4.1 Influence of air velocity (v) ... 98
III.4.2 Influence of light intensity (I) ... 104
III.4.3 Influence of initial concentration (C0) ... 107
III.4.4 Influence of Relative Humidity (RH) ... 109
III.4.5 Presence of co-pollutants ... 112
III.4.6 Presence of particles (bio-aerosols) ... 117
III.5 Formation of gas phase intermediates during the degradation of the target compounds ... 119
III.5.1 Acrylonitrile gas phase intermediate compounds ... 119
III.5.2 Isoflurane gas phase intermediate compounds ... 119
III.6 Mineralization rates obtained during the degradation of the target compounds .. 121
III.6.1 Isoflurane mineralization rates ... 121
III.6.2 Acrylonitrile mineralization rates ... 122
III.7 Effect of the change of media geometry on the degradation of target compounds 126 III.8 Conclusions on the photocatalytic degradation of acrylonitrile and isoflurane ... 131
III.9 References ... 135
CHAPTER IV:CFD AS A TOOL TO UNDERSTAND THE PERFORMANCE OF PHOTOCATALYTIC REACTORS ... 141
IV.1 Introduction ... 142
IV.2 CFD Methodology ... 145
IV.2.1 Geometry definition ... 145
IV.2.2 Meshing ... 147
IV.2.3 Model development ... 149
IV.2.4 Convergence criteria ... 155
degradation efficiency ... 177 IV.5 Conclusions on the use of CFD as a tool to understand the performance of the photocatalytic reactor ... 184 IV.6 References ... 187 GENERAL CONCLUSIONS ... 190
Figure 1 : Non-unidirectional-flow distribution in an operating room [65] ... 20
Figure 2 : Unidirectional-flow distribution in an operating room [65] ... 21
Figure 3: Schematic representation of heterogeneous catalytic reaction steps [95] ... 25
Figure 4 : Schematic representation of the photocatalytic mechanism induced by the photo-excitation of the catalyst [95] ... 26
Figure 5 : Schematic representation of (a) plate, (b) annular, (c) fluidized bed and (d) monolith reactors [99] ... 28
Figure 6 : Photocatalytic reaction rate and order regimes related to light intensity [119] ... 31
Figure 7 : Collection efficiency of QUARTZEL® PCO media as a function of particle diameter and loading rate [140] ... 34
Figure 8 : Schematic representation of humid air zero generation system ... 54
Figure 9 : Schematic representation of the system used for the generation of pollutants in certified gas cylinders ... 55
Figure 10 : Schematic representation of the closed-loop photocatalytic reactor ... 57
Figure 11 : Photometric data of lamps provided by Philips ... 58
Figure 12 : Grid showing points for the measurement of irradiance... 58
Figure 13 : Photograph of the photocatalytic media ... 59
Figure 14 : Scanning electron micrographs of (a) arrangement of fibers (b) arrangement of fibers (c) fiber coated with TiO2 (d) different sized fibers ... 60
Figure 15 : Experimental mercury porosimetry points fitted to Le Coq Model ... 63
Figure 16 : A schematic representation of laboratory experimental bench used for pressure drop versus velocity measurements ... 63
Figure 17 : Dependence of pressure drop on the velocity for the photocatalytic media ... 64
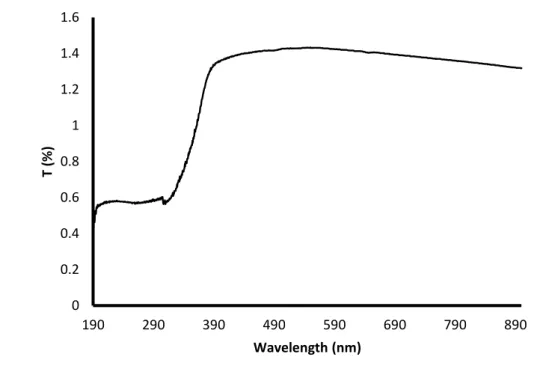
Figure 18 : Transmittance of the photocatalytic media with respect to wavelength ... 67
Figure 19 : Representation of the photocatalytic module showing position and arrangement of lamps and plane (left) and pleated (right) media configuration ... 68
Figure 20 : ACROSS System for sampling ... 69
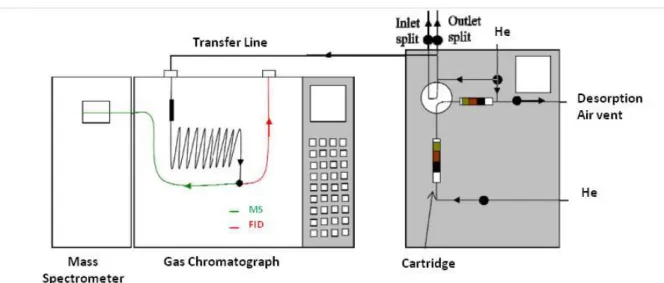
Figure 21 : Schematic representation of the TD/GC/FID-MS system ... 71
Figure 22 : Pollutant generation system for calibration ... 73
Figure 23 : Schematic representation of HPLC analytical process [14] ... 74
Figure 24 : Estimation of the quantity of CO2 entering the reactor with time ... 75
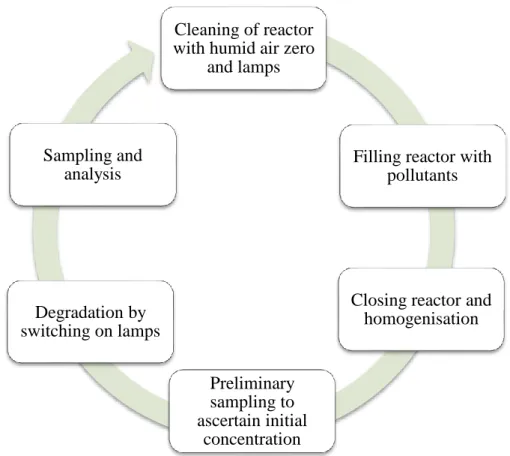
Figure 25 : Protocol used during photocatalytic degradation experiments ... 76
Figure 26 : Leak rate measured at different velocities ... 77
Figure 27 : Photolysis of target compounds (C0 = 10 ppm; v = 1 m.s-1; I = 4.5 mW.cm-2) ... 78
Figure 28 : Adsorption of target compounds (C0 = 10 ppm; v = 1 m.s-1)... 78
Figure 29 : Schematic representation of test bed used to load photocatalytic media with micronized rice ... 79
Figure 30 : Degradation profile of acrylonitrile under the reference experimental conditions of C0 = 2 ppm; v = 1 m.s-1; I = 4.5 mW.cm-2; RH = 50 % ... 90
Figure 31 : Degradation profile of isoflurane under the reference experimental conditions of C0 = 0.5 ppm; v = 1 m.s-1; I = 4.5 mW.cm-2; RH = 50 % ... 91
Figure 32 : Experimental degradation curve of acrylonitrile fitted to Dumont and Héquet model (C0 = 2 ppm; v = 1 m.s-1; I = 4.5 mW.cm-2; RH = 50 %) ... 94
Figure 34 : Degradation curves of acrylonitrile velocity experiments fitted to model to obtain α (C0 = 2 ppm; I = 4.5 mW.cm-2; RH = 50 %) ... 100 Figure 35 : Degradation curves of isoflurane velocity experiments fitted to model to obtain τi
and α (C0 = 0.5 ppm; I = 4.5 mW.cm-2; RH = 50 %) ... 100 Figure 36 : Influence of air velocity on the single-pass photocatalytic removal efficiency of acrylonitrile at experimental conditions of C0 = 2 ppm; I = 4.5 mW.cm-2; RH = 50 % ... 101 Figure 37 : Effect of air velocity on (a) the length of the induction time (b) the single-pass removal efficiency determined during isoflurane degradation at experimental conditions of C0 = 0.5 ppm; I = 4.5 mW.cm-2; RH = 50 % ... 102 Figure 38 : Single-pass removal efficiency vs 1/v for (a) acrylonitrile (b) isoflurane ... 103 Figure 39: Effect of light intensity the single pass removal efficiency determined during acrylonitrile degradation (C0 = 2 ppm; v = 1 m.s-1; RH = 50 %) ... 105 Figure 40: Effect of light intensity on (a) the length of the induction time (b) the single pass removal efficiency determined during isoflurane degradation (C0 = 0.5 ppm; v = 0.5 m.s-1; RH = 50 %) ... 106 Figure 41: Effect of initial concentration on the single pass removal efficiency determined during acrylonitrile degradation (v = 1 m.s-1; I = 4.5 mW.cm-2; RH = 50 %) ... 107 Figure 42: Effect of initial concentration on (a) the length of the induction time (b) the single pass removal efficiency determined during isoflurane degradation (v = 1 m.s-1; I = 4.5 mW.cm-2; RH = 50 %). ... 108
Figure 43 : Influence of relative humidity on the single-pass removal efficiency determined during acrylonitrile degradation. (C0 = 2 ppm; v = 1 m.s-1; I = 4.5 mW.cm-2) ... 110 Figure 44 : Influence of relative humidity on (a) the length of the induction time (b) the single pass removal efficiency determined during isoflurane degradation. (C0 = 0.5 ppm; v = 1 m.s
-1; I = 4.5 mW.cm-2) ... 110
Figure 45 : Influence of presence of co-pollutants on the single pass removal efficiency determined during acrylonitrile degradation (C0 = 2 ppm; v = 1 m.s-1; I = 4.5 mW.cm-2; RH = 50 %) ... 114 Figure 46 : Influence of presence of co-pollutants on (a) the length of the induction time (b) the single pass removal efficiency determined during isoflurane degradation (C0 = 0.5 ppm; v = 1 m.s-1; I = 4.5 mW.cm-2; RH = 50%) ... 115
Figure 47 : Influence of the presence of particles on the single pass removal efficiency determined during acrylonitrile degradation (C0 = 2ppm; v = 1 m.s-1; I = 4.5 mW.cm-2; RH = 50 %) ... 117 Figure 48 : Influence of the presence of particles on (a) the length of the induction time (b) the single pass removal efficiency determined during isoflurane degradation (C0 = 0.5 ppm; v = 1 m.s-1; I = 4.5 mW.cm-2; RH = 50 %) ... 118 Figure 49 : Evolution of pollutant conversion and CO2 mineralization rate during the
photocatalytic oxidation of acrylonitrile (C0 = 0.5 ppm; v = 1 m.s-1; I = 4.5 mW.cm-2; RH = 50%) ... 122 Figure 50 : Evolution of conversion and CO2 mineralization rate during the photocatalytic
arrow indicates first step of mineralization whilst blue arrow indicates the second step of mineralization ... 124 Figure 52 : Evolution of mineralization rates as a function of conversion rates during the photocatalytic oxidation of acrylonitrile at initial concentrations of (a) C0 = 0.5 ppm (b) C0 = 2 ppm and (c) C0 = 10 ppm (v = 1 m.s-1; I = 4.5 mW.cm-2; RH = 50 %) ... 125 Figure 53 : Possible different path lengths between the plane and pleated media geometries according to Batault [65] ... 128 Figure 54 : Representation of plane and pleated media configurations installed in the multi-pass reactor ... 129 Figure 55 : Influence of the media geometry on the single pass removal efficiency determined during acrylonitrile degradation (C0 = 2ppm; v = 1 m.s-1; I = 4.5 mW.cm-2; RH = 50 %) .... 129 Figure 56 : Influence of the media geometry on (a) the length of the induction time (b) the single pass removal efficiency determined during isoflurane degradation (C0 = 0.5 ppm; v = 1 m.s-1; I = 4.5 mW.cm-2; RH = 50 %) ... 130 Figure 57 : Geometry definition of plane configuration using ANSYS Design modeler ... 146 Figure 58 : Geometry definition of pleated configuration using ANSYS Design modeler ... 146 Figure 59 : (a) Plane geometry meshing (b) pleated geometry meshing ... 148 Figure 60 : Path of a light ray in a medium [15] ... 151 Figure 61 : (a) Ray effect seen when angular discretization is 3x3; Ray effect disappears when angular discretization is increased to (b) 10x10 and (c) 15x15 [17] ... 152 Figure 62 : Schematic representation of lamp emission models (a) line source model (b) surface source model (c) volume source model [15] ... 154 Figure 63 : Velocity contour showing flow behavior through the reactor in the plane configuration ... 156 Figure 64 : Velocity contour showing flow behavior on the surface of the photocatalytic media for the plane configuration ... 157 Figure 65 : Velocity contour showing flow behavior 8mm distance in media for the plane configuration ... 157 Figure 66 : Velocity contour showing flow behavior on the outlet of the media for the plane configuration ... 158 Figure 67 : Streamlines through the photocatalytic module in plane media configuration ... 158 Figure 68 : Comparison between simulated and experimental velocity values along the height of reactor at a distance of 6 cm before media... 159 Figure 69 : Velocity contour showing flow behavior through the reactor in the pleated configuration ... 160 Figure 70 : Velocity contour showing flow behavior on the surface of the photocatalytic media for the pleated configuration... 161 Figure 71 : Velocity contour showing flow behavior 8 mm distance in media for the pleated configuration ... 161 Figure 72 : Velocity contour showing flow behavior on the outlet of the media for the pleated configuration ... 162 Figure 73 : Streamlines through the photocatalytic module and media in pleated media configuration ... 163
Figure 75 : Irradiance distribution on the plane media surface for the simulation measurements ... 166 Figure 76 : Irradiance distribution on the plane media surface for the experimental measurements ... 166 Figure 77 : Comparison between simulated and experimental irradiance values along the height of the plane media at a distance of 10 cm along the media length (y-axis) ... 167 Figure 78 : Irradiance contours showing irradiance distribution through reactor for pleated media configuration ... 169 Figure 79 : Irradiance contour showing behavior on the surface of the photocatalytic media for the pleated configuration ... 170 Figure 80 : Irradiance contour showing behavior 8 mm distance in media for the pleated configuration ... 170 Figure 81 : Irradiance contour showing behavior at the outlet of the media for the pleated configuration ... 171 Figure 82 : Comparison between simulated and experimental irradiance values along the length of the one pleat at a distance of 10 cm along the media height ... 172 Figure 83 : Irradiance profile within photocatalytic media for plane and pleated configurations ... 173 Figure 84 : Representation of Room DOPair showing the air flow and the various air cleaning stages [27] ... 178 Figure 85 : (a) Current plane media geometry (b) Proposed pleated media geometry ... 179 Figure 86 : Flow distribution through the module for the plane configuration of Room DOPair ... 179 Figure 87 : Flow distribution on the downstream media surface for the plane configuration of Room DOPair ... 180 Figure 88 : Flow distribution through the module for the pleated configuration of Room DOPair ... 180 Figure 89 : Flow distribution on the downstream media surface for the pleated configuration of Room DOPair ... 181 Figure 90 : Irradiance profile through the module for the plane configuration of Room DOPair ... 182 Figure 91: Irradiance profile through the module for the pleated configuration of Room DOPair ... 182 Figure 92 : Irradiance profile on media surface for the plane configuration of Room DOPair ... 183 Figure 93 : Irradiance profile on media surface for the pleated configuration of Room DOPair ... 183
Table 1 : Ventilation requirements in hospital facilities in France and in the US ... 9
Table 2 : Classification of hospital premises into risk zones by CLIN, France [8] ... 10
Table 3: Summary of some chemical pollutants identified in hospitals ... 13
Table 4 : Concentrations of compounds found in surgical smoke ... 18
Table 5 : Compounds identified in surgical smoke [53] ... 18
Table 6 : Operating room recommended indoor conditions... 20
Table 7 : Characteristics of certified gas cylinders used for the generation of pollutants in the photocatalytic reactor ... 55
Table 8 : Results from nitrogen adsorption/desorption analysis ... 60
Table 9 : Comparison of surface areas of commercial photocatalysts ... 61
Table 10 : Results from mercury porosimetry... 62
Table 11 : Characteristics of the photocatalytic media ... 67
Table 12 : Operational parameters of the TD/GC/FID-MS analytical system ... 72
Table 13 : Calibration results for target compounds using GC/FID-MS ... 73
Table 14 : Formaldehyde and acetaldehyde HPLC calibration results ... 74
Table 15 : Operational parameters of Palas RBG 1000 particle generator ... 80
Table 16 : Experimental operating conditions for the PCO of isoflurane and acrylonitrile .... 81
Table 17 : First order constants and coefficient of determination calculated from first order equation for the three references acrylonitrile experiments (C0 = 2 ppm; v = 1 m.s-1; I = 4.5 mW.cm-2; RH = 50 %) ... 90
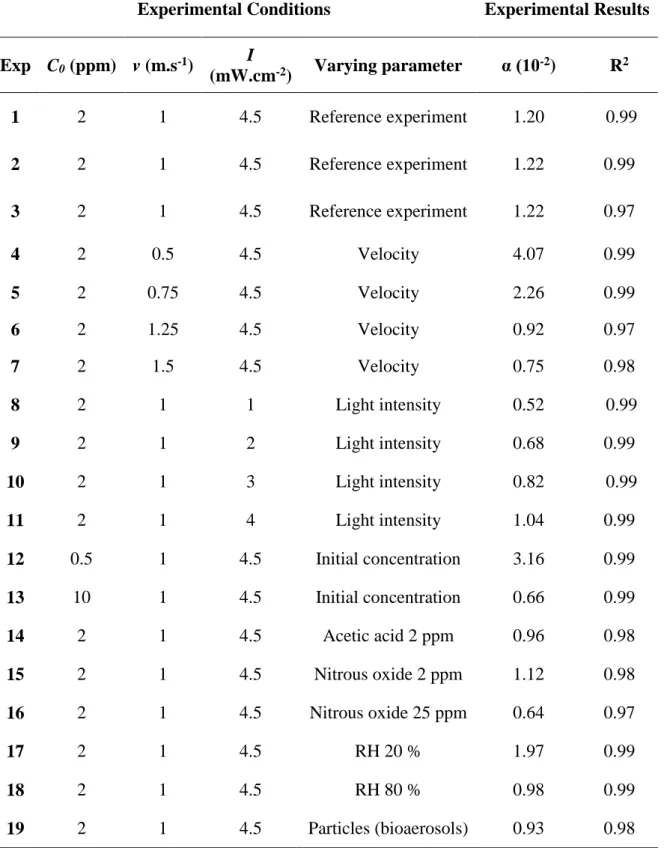
Table 18 : Experimental conditions and experimental results for acrylonitrile using the Dumont and Héquet model ... 95
Table 19 : Experimental conditions and experimental results for isoflurane using the Dumont and Héquet model ... 97
Table 20 : Binary mixture compositions ... 113
Table 21 : List of reaction intermediates identified during the degradation of isoflurane (v = 1 m.s-1; I = 4.5 mW.cm-2; RH = 50 %) ... 121
Table 22 : Surface corrected single-pass removal efficiencies of acrylonitrile and isoflurane calculated for the plane and pleated configurations ... 131
Table 23 : Summary of different uses of CFD in PCO as found in the literature ... 144
Table 24 : Influence of the mesh size on the average velocity and irradiance on the media surface ... 148
Table 25 : Results obtained from the hydrodynamic simulation of plane and pleated geometries ... 164
Table 26 : Simulation results for radiation modeling of photocatalytic module ... 174
Table 27 : Range of irradiance on different sections within the media ... 174
Table 28 : Single-pass removal efficiencies (α) of acrylonitrile and isoflurane calculated for the plane and pleated configurations and the surface areas (S) for each configuration ... 175
Table 29 : Surface corrected single-pass removal efficiencies (α/m-2) of acrylonitrile and isoflurane calculated for the plane and pleated configurations and the corrected surface areas (S’) for each configuration ... 176
Table 32 : Irradiance obtained from the radiation field simulation of plane and pleated geometries for Room DOPair ... 184
a : Absorption coefficient (m-1)
Q : Air flow rate (m3.h-1)
A : Area (m2)
C : Concentration (ppm)
ρ : Density (kg.m-3)
s : Direction of photon (m)
µ : Dynamic viscosity (kg.m-1.s-1)
Pc : Electric power consumption (kW)
g : Gravitational force (m.s-2) C0 : Initial concentration (ppm) E : Irradiance (W.m-2) k : Kinetic constant (h-1) I : Light intensity (mW.cm-2) I : Light intensity (W.m-2) T : Local temperature (K) m : Mass (g) e : Media thickness (m) mod i
: Modal pore size (µm)MV : Molar volume (L.mol-1)
MW : Molecular weight (g.mol-1)
SM : Momentum sink term (-)
k : Permeability (m2)
Φ : Phase function (-)
Rep : Pore Reynolds number (-)
dp : Pore size (µm)
vp : Pore velocity (m.s-1)
ε : Porosity (-)
P : Pressure (Pa)
∆P : Pressure drop (Pa)
n : Reaction order (-)
r : Reaction rate (ppm.h-1) (ppm.min-1)
σ : Scattering coefficient (m )
s’ : Scattering direction (m)
Ω' : Scattering solid angle (sr)
E : Short-circuit factor (-)
α : Single-pass removal efficiency (-)
i
: Slope attenuation coefficient of porosity curve (-)Ω : Solid angle (sr) σSB : Stefan-Boltzmann constant (W.m-2K-4) τ : Stress tensor (kg.m-1.s-2) t : Time (min) v : Velocity (m.s-1) V : Volume (m3)
ACH : Air Change per Hour
ACROSS : Automatic Clean Room Sampler
AICHA : Air Intérieur et Pollution Chimiques dans les Hôpitaux
ANSES :
Agence Nationale de Sécurité Sanitaire de l’alimentation, de l’environnement et du Travail
ANSM : Agence Nationale de Sécurité du Médicament et des produits de santé ASHRAE : American Society of Heating, Refrigerating and Air-Conditioning Engineers ASPEC : Association pour la Prévention et l'Etude de la contamination
BRI : Building Related Illnesses
CADR : Clean Air Delivery Rate
CDC : Center for Disease Control and Prevention
CLIN : Comité de Lutte contre les Infections Nosocomiales FID : Flame Ionization Detection
GC : Gas Chromatography
HEPA : High Efficiency Particulate Air
HPLC : High Performance Liquid Chromatography HRI : Health Related Index
HVAC : Heating, Ventilation And Air Conditioning
IAQ: : Indoor Air Quality
JOSHA : Japanese Occupational Safety and Health Association MS : Mass Spectrometry
NIOSH : National Institute of Occupational Safety and Health OCE : Operating Cost Effectiveness
OEL : Occupational Exposure Limits
OQAI : Observatoire de la Qualité de l’air Intérieur OSHA : Occupational Safety and Health Association PCO : Photocatalytic Oxidation
QAIHOSP : Qualité de l’air Intérieur dans les Hôpitaux REL : Recommended Exposure Limit
RH : Relative Humidity
SBS : Sick Building Syndrome
TVOC
TWA : Time Weighted Average
UV : Ultra Violet
UVT : UV Transmittance
Publications in Scientific Journals
Whyte H.E., Raillard C., Subrenat A., Héquet V.,“Photocatalytic oxidation of isoflurane,
an anesthetic gas: the influence of operating parameters” Chem. Eng. J. 352 (2018) 441–
449. doi:10.1016/j.cej.2018.07.059.
Whyte H.E., Raillard C., Subrenat A., Héquet V.,” Influence of operating parameters on
the single-pass photocatalytic removal efficiency of acrylonitrile” (submitted)
Whyte H.E., Raillard C., Subrenat A., Héquet V., “Influence of environmental parameters
on the photocatalytic oxidation efficiency of acrylonitrile and isoflurane; two operating room pollutants” (Under preparation)
Whyte H.E., Raillard C., Subrenat A., Héquet V.,“The influence of change of media
geometry on the photocatalytic degradation of acrylonitrile: Experimental and CFD analysis” (Under preparation)
Communication at International Conferences
Whyte H.E., Raillard C., Subrenat A., Héquet V., “Photocatalytic oxidation for indoor air
quality in hospital operating rooms: Study of isoflurane degradation” Oral Presentation
-The 2nd International Conference on New Photocatalytic Materials for Environment, Energy and Sustainability (NPM 2), Ljubljana, Slovenia 2-6 July 2017
Raillard C., Whyte H.E., Maroga Mboula V., Héquet V., Thévenet F., Locoge N., “Indoor
Air Purification by a Commercialized Photocatalytic Oxidation Stand-alone Device: Efficiency and Safety” - Oral Presentation -The 2nd International Conference on New
Photocatalytic Materials for Environment, Energy and Sustainability (NPM 2), Ljubljana, Slovenia 2-6 July 2017
Whyte H.E., Raillard C., Subrenat A., Héquet V., “Influence of operating parameters on
the single-pass removal efficiency during the photocatalytic degradation of acrylonitrile”- Oral and Poster Presentation – The 10th European meeting on Solar Chemistry and Photocatalysis: Environmental Applications (SPEA10), Almería, Spain, 4 – 8 June 2018.
Raillard C., Whyte H.E., Maroga Mboula V., Thévenet F., Locoge N., Héquet V.,
“Photocatalytic oxidation of several mixtures of indoor air pollutants by a commercialized stand-alone device” - Poster Presentation -– The 10th European meeting on Solar Chemistry and Photocatalysis: Environmental Applications (SPEA10), Almería, Spain, 4 – 8 June 2018.
acrylonitrile: a study of the influence of operating parameters” -Poster Presentation – The
15th Conference of the International Society of Indoor Air Quality & Climate (ISIAQ), Philadelphia, PA, USA ,22- 27 July 2018
La qualité de l'air intérieur (QAI) fait actuellement l'objet d'une attention particulière et constitue une préoccupation majeure des pouvoirs publics dans nombre de pays. Nous passons, en effet, plus de 80%, en moyenne, de notre temps à l'intérieur. De plus, il est généralement admis qu’une mauvaise QAI peut conduire à une dégradation de l’état de santé des occupants par le biais du syndrome des bâtiments malsains (Sick Building Syndrome) ou de maladies liées à l’air respiré dans les bâtiments (Building Related Illnesses) avec des degrés de gravité variés. L'Organisation Mondiale de la Santé (OMS) estime que la pollution de l’air intérieur provoque environ 3,8 millions de décès prématurés par an dans le monde. En France, l'Agence Nationale de SEcurité sanitaire de l'alimentation, de l'environnement et du travail (ANSES) estime que les coûts socio-économiques liés aux effets de la qualité de l'air intérieur sur la santé humaine s’élèvent à environ 19 milliards d'euros par an. De nombreuses organisations nationales et internationales ont alors vu le jour afin d’assurer la surveillance de la qualité de l'air intérieur. En France, l'Observatoire de la Qualité de l'Air Intérieur (OQAI) a été créé pour mieux connaître la pollution intérieure, ses origines et ses dangers. Depuis sa création, en 2010, les études se sont concentrées sur la qualité de l’air intérieur des maisons, bureaux et écoles. Certains lieux, tels que les hôpitaux, ont, eux, été rarement investigués. Pourtant, la qualité de l'air dans les hôpitaux mérite attention en raison de la complexité des lieux et des activités qui y sont menées ainsi que de la vulnérabilité des personnes qui y séjournent. Un contrôle inadéquat de la QAI à l'hôpital peut provoquer les maladies chez les patients et les soignants. Deux projets récents financés par l’ANSES, AICHA (Air intérieur et pollution chimique dans les hôpitaux) et QAIHOSP (Qualité de l'air intérieur dans les hôpitaux), ont été menés en 2010 et 2013 respectivement, avec pour objectif de fournir des connaissances qualitatives et quantitatives sur les polluants présents dans certains hôpitaux en France. Alors que le projet AICHA se concentrait seulement sur la présence de contaminants chimiques, QAIHOSP a étudié plus largement les contaminants chimiques, microbiologiques et particulaires. Les résultats de ces études ont montré que l'air intérieur des hôpitaux contient un mélange complexe de composés chimiques, physiques et microbiologiques. Les auteurs de ces études concluent également que l'exposition continue des occupants à ces polluants peut nuire à leur santé. Afin de limiter le niveau de pollution en milieu hospitalier, plusieurs agences nationales donnent des recommandations pour le contrôle de la qualité de l'air intérieur en fonction des taux de renouvellement d’air. Aux États-Unis, la norme de référence ASHRAE 170-2017 est issue des travaux de l’American Society of Heating, Refrigerating and Air-Conditioning Engineers (ASHRAE). En France, c’est la norme NFS 90-351, basée sur les recommandations de l’Association pour la Prévention et l'étude de la contamination (ASPEC), qui est appliquée. Actuellement, les dispositifs de traitement d’air, qu'ils soient autonomes ou inclus dans les systèmes de ventilation, sont de plus en plus utilisés comme moyen complémentaire d'amélioration de la QAI. Ces dispositifs de traitement utilisent des technologies telles que la filtration, l’adsorption, le plasma froid ou l’oxydation photocatalytique, seules ou combinées. En milieu hospitalier, la préoccupation principale concerne la réduction des contaminants de nature microbiologique en raison du risque d'infections nosocomiales. Par conséquent, l'efficacité de ces dispositifs ne repose généralement que sur l'élimination des micro-organismes. Cependant, comme les résultats issus des projets AICHA et QAIHOSP montrent que les hôpitaux contiennent également des contaminants chimiques dont certains sont spécifiques à l'environnement médical, il est nécessaire d'étudier le devenir de ces polluants chimiques lorsqu'ils traversent ces dispositifs de traitement. Parmi les technologies de traitement, l’oxydation photocatalytique est considérée comme une méthode économique, peut consommatrice d’énergie et capable de dégrader une large gamme de polluants chimiques. Ces dernières années, de plus en plus de systèmes de traitement utilisant l’oxydation photocatalytiques sont apparus sur le marché et
PCO. C’est cette technologie qui est étudiée lors de ce travail. La thèse vise à évaluer l'efficacité des dispositifs dans l'élimination de certains polluants chimiques spécifiques présents dans les hôpitaux, ainsi qu’à donner des recommandations quant à l’utilisation de cette technologie dans les milieux hospitaliers.
Dans le premier chapitre, la synthèse d’une revue bibliographique est présentée. Elle a été réalisée afin de fournir un état des lieux des polluants chimiques présents dans les hôpitaux et de déterminer ceux qui pourraient être intéressants à étudier de par leur fréquence d’apparition ou leurs niveaux de concentration dans ces milieux. Le choix des molécules cibles a été limité aux composés rencontrés dans les blocs opératoires (BO). Dans les BO, la pollution de l’air provient de trois sources principales : les gaz anesthésiques, la fumée chirurgicale et les agents désinfectants. Sur cette base, deux polluants cibles, l’isoflurane et l’acrylonitrile, ont été choisis. Ils appartiennent à deux des principaux types de composés gazeux présents dans les BO : les gaz anesthésiants (isoflurane) et les gaz contenus dans les fumées chirurgicales (acrylonitrile). Ils proviennent également de deux familles chimiques différentes ; ce qui permet de comparer leurs comportements de dégradation par procédé photocatalytique. En outre, ce sont des molécules complexes qui peuvent être source d’intermédiaires réactionnels. Ensuite, dans ce chapitre, le principe de la photocatalyse en milieu gazeux est d’abord présenté puis les principaux paramètres opératoires et environnementaux susceptibles d'influencer l’efficacité des procédés d’oxydation photocatalytique sont détaillés. Cette partie permet d’identifier les paramètres clés à faire varier pour étudier, comprendre et analyser les performances du système de traitement photocatalytique mis en œuvre dans ce travail. Enfin, ce premier chapitre vise également à établir les objectifs de la thèse :
Effectuer une évaluation paramétrique de la dégradation de l'isoflurane et de l'acrylonitrile en étudiant l'influence de la vitesse de l'air, de l'intensité lumineuse, de la géométrie des matériaux photocatalytiques, de la concentration initiale en polluants, de la présence de co-polluants chimiques (le protoxyde d’azote et l’acide acétique), de la présence de particules (ou bioaérosols) et de l'humidité relative.
Effectuer des simulations numériques afin de mieux comprendre l'influence du changement de géométrie sur la dégradation des molécules cibles par procédé d’oxydation photocatalytique.
Évaluer l'innocuité de la dégradation de l'isoflurane et de l'acrylonitrile par oxydation photocatalytique hétérogène en identifiant les éventuels intermédiaires réactionnels formés et émis dans la phase gazeuse.
Dans le deuxième chapitre, le matériel et les méthodes utilisés sont décrits. Les essais ont été réalisés sur un banc expérimental de 420 L, fonctionnant en boucle fermée. Ce banc inclut un module dans lequel sont disposés le média photocatalytique fibreux non tissé et deux tubes fluorescents UVC de 18 W (série Phillips PL-L). L’air à traiter circule dans le réacteur avec un débit pouvant aller de 28 à 300 Nm3.h-1 grâce à un ventilateur à vitesse variable. Une chambre de tranquillisation dans laquelle un nid d'abeille est installé permet une homogénéisation de l’air ainsi que l'injection et l'échantillonnage des composés d’intérêt. L’évolution dans le temps de la concentration des composés permet de réaliser des cinétiques de dégradation qui sont ensuite analysées. Au cours de la cinétique de dégradation, les échantillons d’air sont prélevés sur des cartouches CarboPack B et DNPH et sont analysés via
chromatographie liquide avec détecteur UV (HPLC-UV). Le média photocatalytique utilisé est un média commercial produit par Saint-Gobain Quartz (QUARTZEL®). Ce média non tissé (feutre) est constitué de fibres de SiO2 revêtues de TiO2 déposé par un procédé sol-gel. Il
a une épaisseur moyenne de 17.5 ± 1.5 mm et une surface spécifique BET de 112 ± 1 m2.g-1. D'autres caractéristiques telles que la porosité, la perméabilité, le facteur de résistance inertielle et la transmittance UV ont été déterminées pour servir lors de la simulation numérique. Celles-ci sont résumées dans le tableau ci-dessous.
Table 1: Caractéristiques du média photocatalytique
Afin d’extraire les indicateurs de performance permettant d’évaluer l’influence des paramètres sur la dégradation phocatalytique, un modèle développé par Dumont et Héquet est utilisé. La modèle décrit une relation de premier ordre de décroissance de la concentration en fonction du temps dans un réacteur multi-passage et permet le calcul du taux d’abattement par passage. Le modèle est donné comme suit:
𝐂 = 𝑪𝟎 𝐞𝐱𝐩 {−𝝉𝒕
𝑹|[𝟏 − 𝐞𝐱𝐩(−𝜶)]}
où le terme α est le taux d’abattement par passage et représente la fraction du débit total traité pendant le temps τR (temps de résidence dans le réacteur). C est la concentration du polluant considéré au temps t et C0 est sa concentration initiale.
Les gammes quantitatives choisies pour certains paramètres sont résumées dans le tableau ci-dessous. Paramètre Valeur Vitesse (m.s-1) 0,5 – 1,5 Intensité lumineuse (mW.cm-2) 1,0 – 4,5 Concentration initiale (ppm) 0,5 - 10 Humidité relative (%) 20 - 80
Table 2 : Conditions opératoires expérimentales pour l’oxydation photocatalytique de l’isoflurane et de l’acrylonitrile
Les valeurs de la vitesse et de l’intensité lumineuse ont été choisies en fonction des conditions de fonctionnement généralement utilisées par un purificateur d'air commercial. La concentration des polluants dans le bloc opératoire varie en fonction des activités et peut aller de plusieurs ppb à quelques dizaines de ppm. La concentration initiale serait donc étudiée dans une plage de 0,5 à 10 ppm. L’humidité relative recommandée par plusieurs agences nationales pour une salle d'opération typique est de 30 à 60 % selon le type de chirurgie à
Caractéristiques Valeur
Porosité 0,875
Permeabilité (m2) 1,45 x10⁻⁸
Facteur de résistance inertielle (m-1) 823
Dans le troisième chapitre, les essais de dégradation de l’acrylonitrile et de l’isoflurane sont présentés. Une étude des profils des courbes de dégradation de l'acrylonitrile et de l'isoflurane montre que l'acrylonitrile est plus rapidement (60 minutes) dégradé que l'isoflurane (600 minutes). L’isoflurane est une molécule halogénée pour laquelle les mécanismes de dégradation sont plus complexes ; ce qui peut expliquer que la dégradation est plus lente que pour l’acrylonitrile. Il est également observé que la dégradation de l'acrylonitrile peut être représentée par une cinétique apparente du premier ordre tandis que la dégradation de l'isoflurane se fait en deux étapes. Au cours de la première phase, la dégradation est lente et peu efficace. Elle peut être attribuée à d'éventuelles réactions de l'isoflurane avec les radicaux hydroxyles OH°. Au cours de la seconde phase, la dégradation s’accélère grâce à un mécanisme supposé de réaction en chaîne incluant les radicaux chlores Cl°, similaire à celui de dégradation photocatalytique du trichloréthylène décrit dans la littérature. Cette seconde phase de dégradation est représentée par une cinétique de décroissance de premier ordre apparent. Le modèle développé par Dumont et Héquet est alors appliqué aux cinétiques de dégradation des deux polluants et permet de calculer un indicateur, le taux d’abattement par tour 𝛼, pour l'acrylonitrile et deux indicateurs, la période d'induction 𝜏𝑖 (correspondant à la durée de la première étape de la cinétique) et, le taux d’abattement par tour 𝛼, pour l'isoflurane. L'influence de la vitesse de passage de l'air, de l'intensité lumineuse, de la géométrie du média, de la présence de co-polluants et de particules (bioaérosols) ainsi que de l'humidité relative influant sur ces indicateurs de performance est présentée. Les résultats montrent que l’influence des paramètres est similaire quel que soit le composé considéré. Lorsque la vitesse augmente de 0,5 m.s-1 à 1,5 m.s-1, le α diminue de 0,04 à 0,007 pour l'acrylonitrile tandis que pour l'isoflurane, le α diminue de 0,0023 à 0,00048 et le τi passe
de 45 minutes à 225 minutes. La diminution de la vitesse de l'air de 1.5 m.s-1 à 0.5m.s-1 entraîne un temps de contact plus long, ce qui conduit à des périodes d'induction plus courtes pour l’isoflurane et à des taux d’abattement par passage plus élevés. L'augmentation de l'intensité lumineuse de 1 mW.cm-2 à 4.5 mW.cm-2 conduit à une diminution de 𝜏
𝑖 250
minutes à 45 minutes et à une augmentation de 𝛼 de 0,0012 à 0,0023 pour l'isoflurane et à une augmentation de 𝛼 de 0,0052 à 0,012 pour l'acrylonitrile. Il est observé que la relation entre l’intensité lumineuse et le taux d’abattement par tour suit un régime d’ordre 0,5 pour les deux composés. Cela signifie que pour la gamme d'intensités lumineuses étudiées, la recombinaison électron-trou est dominante. En conséquence, un accroissement supplémentaire de l’intensité lumineuse n’améliorerait pas de manière significative les taux d’abattement par tour, mais imposerait des coûts énergétiques inutiles. Lorsque la concentration initiale est augmentée de 0,5 ppm à 10 ppm, le taux d’abattement par tour pour l'acrylonitrile diminue de 0,032 à 0,006, tandis que pour l'isoflurane, la période d'induction augmente de 130 minutes à 600 minutes et le taux d'abattement par le passage diminue de 0,0008 à 0,0003. L’augmentation des concentrations initiales en acrylonitrile et en isoflurane de 0,5 ppm à 10 ppm entraîne une diminution d’efficacité de dégradation attribuable à une limitation du nombre d’espèces actives pouvant oxyder les polluants. Lorsque l'humidité relative a été augmentée de 20 % à 80 % les 𝛼 ont été diminués de 50 % et 27 % respectivement pour l’acrylonitrile et l’isoflurane et le 𝜏𝑖 a augmenté de 79 %. L’adsorption
compétitive entre le polluant à dégrader et les molécules d’eau explique qu’une augmentation de l'humidité relative conduit à inhiber la dégradation des deux composés cibles. La présence d'autres polluants gazeux diminuent également la dégradation des composés cibles en raison de la compétition pour l'adsorption sur les sites actifs. Il a également été montré que, dans la présence de particules sur la surface du média photocatalytique, le α était 0,7 fois inférieur et 0,8 fois inférieur pour l’acrylonitrile et l’isoflurane respectivement, tandis que le 𝜏𝑖 était
résultats de l'évaluation de l’influence des paramètres opératoires et environnementaux ont montré que pour améliorer la performance de la dégradation photocatalytique pour l'élimination de l'acrylonitrile et de l'isoflurane, il est préférable de travailler à faibles vitesses car cela augmente le temps de contact entre les polluants et les espèces actives. Des intensités lumineuses plus élevées donnent de meilleures performances mais, pour le système étudié, une intensité lumineuse au-delà de 5 mW.cm-2 engendrerait un coût énergétique important à
mettre en balance avec une efficacité de dégradation plus mitigée. Dans le bloc opératoire les niveaux de l’humidité relative recommandés se situent entre 30 et 60 %, donc il est préférable de ne pas opérer au-delà de 60 %. L'introduction de filtres en amont du média photocatalytique est souhaitable pour réduire la charge de particules reçue sur le support. Le procédé présente une efficacité accrue lorsque le niveau de concentration reste peu élevé (0,5 ppm pour l’isoflurane et l’acrylonitrile). Cependant, étant donné que les concentrations de polluants (cibles et co-polluants) varient avec le temps, le système de traitement photocatalytique devrait comporter plusieurs modules photocatlytiques en séries ou en parallèle afin de maximiser l'efficacité d'élimination des polluants. Cela serait également bénéfique pour réduire les concentrations en intermédiaires réactionnels éventuellement émis en phase gazeuse et les maintenir à des niveaux qui ne posent pas de risques pour la santé. Les composés intermédiaires identifiés lors de la dégradation de l'isoflurane comprennent le pentafluoropropanal, le chlorodifluoroacétaldéhyde, le formaldéhyde, l'acétaldéhyde, l'acide formique et l'acide acétique. Les concentrations mesurées de ces produits en phase gazeuse restent en-deçà des limites susceptibles de présenter un risque avéré pour la santé. Dans le cas de l'acrylonitrile, aucun intermédiaire n'a été identifié. Cependant l’analyse du taux de minéralisation en fonction du taux de conversion a montré que l'acrylonitrile était transformé en produits intermédiaires avant d’être complètement minéralisé. Il a donc été conclu que les méthodes d’échantillonnage et d’analyse n’étaient probablement pas appropriées pour permettre leur piégeage et leur détection de façon exhaustive. Enfin, l’influence du changement de géométrie des médias photocatalytiques a été étudiée. Des expériences dans des conditions de référence à la fois pour l'acrylonitrile et l'isoflurane ont été réalisées avec une configuration de média plan et une configuration de média plissé. L'objectif expérimental était ici de mettre en évidence l'influence du temps de contact pour une intensité lumineuse moyenne reçue sur le support maintenue constante dans les deux configurations. Les résultats ont montré que les le taux d’abattement par tour pour les deux composés étaient 2,3 fois plus élevés pour la configuration plissée que pour la configuration plane. Cette augmentation peut être imputable à l’augmentation de la quantité de photocatalyseur lorsque le média est plissé car la surface de média utilisée est supérieure par rapport à la configuration dans laquelle le média est plan. Pour éliminer l'influence de l'augmentation de la quantité de catalyseur, les taux d’abattement par tour ont été corrigés en les divisant par les surfaces de média respectives des configurations plane et plissée. Les résultats ont montré que la configuration du média plissé améliorait encore la dégradation de 27 % par rapport à la géométrie plane. Cette augmentation d’efficacité peut être attribuée à un temps de contact plus long et également à une meilleure distribution de l’irradiance dans le cas de la géométrie plissée. En effet, dans la littérature, certains auteurs sont en accord avec le fait que le temps de contact puisse augmenter dans les médias plissés, mais certains avancent l’hypothèse d’une diminution de la vitesse de passage de l’air dans le média tandis que d’autres évoquent un allongement du chemin parcouru par les molécules dans le média. Les deux hypothèses sont difficiles à évaluer expérimentalement. En outre, même si l’intensité lumineuse reçue est la même pour les deux supports, la répartition de l’éclairement sur et dans les médias peut également influer sur l’efficacité. Afin de mieux comprendre le rôle de la géométrie du média dans l'amélioration des rendements d'élimination, des simulations numériques ont semblé
Dans le quatrième chapitre, des simulations numériques de l’écoulement d’air et du rayonnement dans le pilote, pour les deux configurations de média photocatalytique (plane et plissée) ont été effectuées en utilisant le logiciel ANSYS 14.5. Les résultats des simulations ont montré que la longueur du trajet parcouru par l'air dans le support était égale à l'épaisseur du média photocatalytique et restait donc identique quelle que soit la configuration considérée. Cependant, la vitesse de l’air à travers le média a été estimée, par les simulations, être 43 % inférieure dans le cas du média plissé par rapport au cas du média plan. Par conséquent, le temps de contact des molécules à dégrader avec le photocatalyseur est plus long dans le cas du support plissé que dans le cas du support plan. Les calculs ont permis de mettre en évidence que le temps de contact était augmenté de 76 % pour la configuration plissée par rapport à la configuration plane. Cette valeur est supérieure à l’augmentation de l’efficacité de dégradation entre média plan et média plissée observée grâce à l’indicateur de performance obtenu expérimentalement. Cela peut être imputé à une distribution différente de l’irradiance entre les deux configurations testées. En effet, les simulations numériques ont également permis d’observer que la distribution de l’irradiance était plus hétérogène sur le support plissé que sur le support plan. Ainsi, sur la base de l’analyse de la répartition de l'éclairement sur le média et des profils d'écoulement dans le module photocatalytique, deux hypothèses ont pu être proposées pour expliquer les différence d’efficacité de dégradation obtenue expérimentalement : premièrement, la surface efficace du média plissé peut être réduite en raison de la présence d'une zone sombre importante (18 %) autour des plis et, en second lieu, l'hétérogénéité plus élevée de la distribution de la vitesse et de l'irradiance pourraient entraver l'effet du temps de contact et entraîner une réduction de l'efficacité globale attendue de la configuration plissée. L'approche de simulations numériques qui a été développée et utilisée pour la configuration expérimentale a été appliquée à une unité commerciale pour aider à étudier l'amélioration du système en proposant une configuration plissée. Bien qu’il n’ait pas été possible d’obtenir une confirmation expérimentale, les simulations ont montré qu’en modifiant uniquement la géométrie du média de plan à plissée l’efficacité de dégradation du système pouvait être améliorée car il y avait une augmentation de la quantité de catalyseur, du temps de contact et de l’irradiance moyenne reçue dans le média.
En conclusion, ces travaux contribuent à l’amélioration des connaissances sur l’influence des paramètres opératoires et environnementaux lors de la dégradation photocatalytique de deux composés qui n’ont jamais ou rarement été étudiés : l’isoflurane et l’acrylonitrile. Il a été démontré comment il était possible d’améliorer les performances de systèmes photocatalytiques dans des conditions spécifiques qui correspondent à des environnements hospitaliers. La simulation numérique constitue un outil utile pour une compréhension plus fine des mécanismes et pour mettre en évidence le comportement de l'écoulement et de l’irradiance dans un média photocatalytique.
Au regard de ces résultats de thèse, plusieurs perspectives peuvent être envisagées:
Il serait nécessaire d'étudier la performance pour un système de traitement photocatalytique comportant comporter plusieurs modules photocatalytiques en séries ou en parallèle. Cela va contribuer à fournir des réponses en premier part sur l’efficacité d’un tel système sur l’élimination des polluants et, d’autre part, sur l’influence qu’il aurait sur les intermédiaires trouvés à la sortie du système de traitement.
l'efficacité d'élimination des polluants. Comme l'air intérieur contient des particules dont on a démontré qu'elles diminuaient l'efficacité de l’oxydation photocatalytique, l'utilisation de techniques de prétraitement comme la filtration pourrait améliorer l'efficacité.
L’innocuité de l’oxydation photocatalytique est importante pour caractériser complètement son efficacité. La sécurité peut être assurée en identifiant et en quantifiant les intermédiaires formés pendant la dégradation. Des travaux supplémentaires devraient être menés sur l'identification et la quantification des composés intermédiaires en utilisant des processus d'échantillonnage et d'analyse plus sensibles.
Un modèle de la dynamique des fluides computationnelle plus rigoureuse couplant la modélisation de la vitesse, du champ de rayonnement et de la réaction cinétique devrait être développé pour aider à concevoir et à optimiser les réacteurs photocatalytiques. La modélisation pourrait être plus économique car le réacteur peut être facilement modifié pour optimiser l'hydrodynamique et le champ de rayonnement du système sans nécessiter différentes configurations de réacteurs pour déterminer la géométrie la plus efficace.
Indoor air quality (IAQ) is receiving significant attention and is currently a major public concern as it is observed that people generally spend more than 80 % of their time indoors. Poor IAQ has been known to cause outbreaks of Sick Building Syndrome (SBS) or Building Related Illnesses (BRI) with varying degrees of severity examples of which include skin and eye irritations, eye infections, headaches, fatigue, nausea, asthma, cancer, etc. The World Health Organization (WHO) estimates that air pollution causes approximately 4.3 million premature deaths per year worldwide. In France, the Agence nationale de sécurité sanitaire de l’alimentation, de l’environnement et du travail (ANSES) estimates that the socio-economic costs associated with the effects of indoor air quality on human health is about 19 billion euros per year.
Indoor air pollution is therefore a great preoccupation of many national and international organizations. These organizations are tasked with the surveillance of indoor air quality. In France for example, the Observatoire de la qualité de l’air intérieur (OQAI) was created to provide better knowledge of indoor pollution, its origins and its dangers. However, since its creation in 2001, the indoor environments mostly studied have been homes, offices and schools. Whilst some indoor environments like the hospital had been rarely studied. The air quality in hospitals deserves a lot more attention because of the complexities and vulnerabilities of the occupants. Consequently improper control of hospital IAQ may cause hospital-acquired (nosocomial) infections and occupational diseases.
It is for this reason that two projects AICHA (Air intérieur et pollution chimiques dans les hôpitaux) and QAIHOSP (Qualité de l’air intérieur dans les hôpitaux) were created in 2010 and 2013 respectively and financed by ANSES. These projects were undertaken to provide some quantitative and qualitative knowledge on the pollutants that were present in some hospitals in France. While AICHA focused on the presence of chemical contaminants, QAIHOSP studied chemical and microbiological contaminants and particulate matter. Their results showed that hospital indoor air contained a complex mixture of chemical, physical and microbiological compounds. They also concluded that the continuous exposure of occupants to these pollutants could be detrimental to their health.
In order to limit the level of pollution in hospital environments, several national agencies, recommend regulations for indoor air quality control based on ventilation rates. In the US the reference guideline is ASHRAE 170-2017 adopted from the work of The American Society of Heating, Refrigerating and Air-Conditioning Engineers (ASHRAE) whilst in France it is the
standard NFS 90-351 based on the recommendations of theAssociation pour la Prévention et l'Etude de la Contamination (ASPEC). Currently, air treatment devices whether stand-alone or included in the main ventilation systems are becoming increasingly popular for use as complementary means to improve IAQ. ASHRAE states that in recent years, more and more air cleaning devices are advertised in the market for the removal of indoor pollutants. The Center for Disease Control and Prevention (CDC) and the Société Française d'Hygiène Hospitalière (SF2H) recognize these devices as supplementary means of treating the air and also improving ventilation in medical environments in the US and France respectively.
The treatment devices use technologies that can be divided in two categories:
Trapping and separation techniques: These include filtration and adsorption where pollutants are transferred unto a filter or a sorbent material. Filtration is used to remove particulate matter whilst adsorption targets gaseous pollutants. Consequently they are effective for certain pollutants but less for others. Additionally, they do not eliminate the pollutants but only transfer them to another phase and subsequently additional disposal or handling steps are required.
Destruction and oxidation techniques: These techniques include plasma treatment, UV germicidal irradiation (UVGI), ozonation and photocatalytic oxidation (PCO). Plasma treatment involves oxidizing pollutants by means of cold plasma at a very high voltage between two electrodes. This technique is effective but it can lead to ozone production and the formation of toxic by-products. UVGI is mostly used for the destruction of bioaerosls using UV light. However it is also capable of degrading some gaseous pollutants. It has the disadvantage of producing intermediates that may be toxic including ozone. Ozonation involves using ozone an oxidizing agent for the destruction of volatile organic compounds (VOCs) and microbial agents. However it can lead to the exposure of ozone. For photocatalytic oxidation, pollutants are oxidized at ambient temperature and under atmospheric pressure using a catalyst activated by light. This technique leads to the transformation of pollutants into innocuous final products. However depending on the type of pollutants and conditions it could also lead to the formation of toxic by-products.
When it comes to air treatment in the hospital however, the major concern is with the reduction of microbiological pollutants rather than chemical pollutants due to the risk of nosocomial infections. Consequently, the efficiency of these devices is usually based on the
microbiological pollutant removal. However, since studies such as AICHA and QAIHOSP show that hospitals contains several chemical contaminants some of which are specific to the medical environment, it is necessary that the fate of these chemical pollutants when they pass through these treatment devices is studied.
Among these treatment technologies, photocatalytic oxidation (PCO) is seen as an economic and energy efficient method capable of degrading a wide range of chemical pollutants and is therefore chosen for this work.
The PhD work therefore aims to evaluate the efficiency of PCO devices in removing some specific chemical pollutants found in hospitals and subsequently to investigate whether PCO is a safe technology for the occupants of the hospital.
The PhD work was financed by ATA Medical and the IMT Atlantique. ATA medical is a French company that has expertise in providing air treatment solutions to various sectors including the medical sector. The research work was carried out in the Department of energetic systems and environment, part of the Génie des procédés, environnement et agro-alimentaire (GEPEA) laboratory located in IMT Atlantique campus in Nantes. The laboratory has a research platform called SAFEAIR which has expertise in indoor air treatment and has made several scientific contributions to PCO for air treatment and is furnished with specific equipments necessary for the study of indoor air treatment by photocatalytic oxidation.
This manuscript consists of four chapters each of which provides information to help achieve the main objective.
- The first chapter recapitulates the state of the art on the indoor air quality in the hospitals detailing principally the chemical pollutants that are present and how some are chosen for this study. Then a preview of the existing knowledge of the photocatalytic degradation process including the principles, the reactors that are available, the parameters influencing its efficiency and the performance evaluation factors are presented. Based on this review and some of these parameters that are important for this study are retained. Finally the experimental objectives of this PhD work are listed.
- In the second chapter, the experimental materials and methods that are utilized to achieve the objectives are described. The photocatalytic reactor in which the
degradations are carried out is presented. Next, the sampling and analytical devices are explained. Then the model that enables the calculation of the performance indicators is described and then, the experimental methodology is given.
- The third chapter deals with the photocatalytic degradation of the target pollutants. Firstly, a parametric evaluation to study the influence that air velocity, light intensity, relative humidity, presence of particles (bioaerosols) and presence of chemical co-pollutants will have on the degradation efficiency of the target compounds is presented. Then, the investigation of intermediates formed during the degradation is done to assess the safety of the process. Thirdly, the mineralization rates obtained during the degradation are also discussed. In the last section of this chapter the influence of two different media geometries is presented. Experimental results from the degradation of isoflurane and acrylonitrile using a pleated media configuration are compared to those obtained using plane media geometry under similar experimental conditions.
- Complementary to the last section of the third chapter, the fourth chapter focuses on using numerical simulations to examine how a change in media geometry affects the behavior of air flow and light irradiance. This is done with the aim of better understanding the role of the media geometry in improving the removal efficiencies of the target compounds.
Finally, the general conclusion summarizes the main results achieved from the work presented in this manuscript as well as some recommendations regarding PCO use in hospital environments.
CHAPTER I: MANAGEMENT OF INDOOR AIR
QUALITY IN MEDICAL ENVIRONMENTS
I.1 Introduction
This work is concerned with the study of using photocatalytic oxidation (PCO) to remove chemical pollutants that are specific to medical environments. This chapter through a review of literature defines a reference frame about the research topic. In detail, the first section (I.2) discusses the indoor air quality generally in hospitals and then specifically in operating rooms (ORs). It aims to provide information on the sources of pollutants and the methods employed to ensure a good indoor air quality. The second section (I.3) discusses photocatalytic oxidation and its use as an air treatment process by looking at its principles and the factors that influence the efficiency of PCO. The different photocatalytic reactors and the performance indicators are also detailed in this section. All of this is done with the objective to identify target compounds as well as the operating parameters that will influence the effectiveness of PCO to remove these target compounds. Finally the experimental objectives of the PhD work are presented.
I.2 Indoor air quality in hospitals
The air quality in hospitals plays an important role on the health of both patients and hospital staff and consequently improper control of hospital indoor air quality (IAQ) may cause hospital-acquired (nosocomial) infections and occupational diseases [1]. Indoor air quality is even more critical in the hospitals than in most other building environments, because of the increased susceptibility of the patients [2].
Unlike other closed indoor environments like residential and commercial buildings, hospitals are composed of a diversity of facilities and occupants and thus the indoor air requirements differ from one facility to the other. Consequently, there is the need to set specific requirements for ventilation, temperature and humidity for the various facilities. For example, facilities such as intensive care units and laboratories will require stricter demands compared to facilities such as meeting rooms. This therefore makes the hospital a complex environment.
In order to reach adequate indoor air, one important feature is the heating, ventilation and air conditioning (HVAC) systems. Ventilation has the function of supplying filtered air from outside (or recycled filtered room air) to dilute pollutant concentrations. The dilution effect is controlled by the ventilation rate which is expressed as air change per hour (ACH).
The ACH (h-1) is defined as the volumetric air flow through the facility divided by the volume
of the facility [3]. In most developed countries, national organizations and agencies provide guidelines based on these ventilation rates. These guidelines may vary depending on the country.
In the US, the reference guideline for ventilation requirements in hospitals is provided in ASHRAE 170-2017 [4] which is based on the recommendations of the American Society of Heating, Refrigerating and Air-Conditioning Engineers (ASHRAE). Whilst in France the NFS 90-351 [5] is the document providing guidelines for indoor air quality in the hospitals. This guideline is based on the recommandations of Association pour la Prévention et l'Etude de la Contamination (ASPEC). The ventilation requirements for some hospital facilities according to these two guidelines are summarized in Table 1.
Table 1 : Ventilation requirements in hospital facilities in France and in the US
Indoor pollutants that could be present in the hospital are principally of three types; biological pollutants, chemical pollutants and particulate matter and their levels are influenced by outdoor and indoor emissions [6]. Due to nosocomial infections however, the main focus when it comes to IAQ is microbiological pollutants. It has been reported that 5% of all patients who go to the hospital get nosocomial infections whilst they are there [7]. In the USA it is estimated that over 100,000 people die each year from hospital infections and 25,000 die in Italy every year [6].
The principal mission of the hospital is to prevent airborne infection and transmission. Consequently, in addition to the ventilation requirements; strict hygiene standards are adhered to, to reduce the microbiological risk of contamination. This is done through the implementation of rigorous cleaning standards. Depending on the degree of infectious risk, hospitals are classified into different zones and the cleaning requirements (frequency of cleaning and products used) necessary to ensure the prevention of nosocomial diseases is influenced by the zone [8,9]. In France, the Comité de Lutte contre les Infections Nosocomiales (CLIN) developed a program which classifies the hospital into four zones.
Facility Minimum ACH (h-1)
ASHRAE 170-2017 [4] NFS – 90-351 [5]
Halls 4 -
Consultation room 6 10
![Figure 4 : Schematic representation of the photocatalytic mechanism induced by the photo-excitation of the catalyst [95]](https://thumb-eu.123doks.com/thumbv2/123doknet/11556293.296783/53.892.206.695.325.746/figure-schematic-representation-photocatalytic-mechanism-induced-excitation-catalyst.webp)
![Figure 7 : Collection efficiency of QUARTZEL ® PCO media as a function of particle diameter and loading rate [140]](https://thumb-eu.123doks.com/thumbv2/123doknet/11556293.296783/61.892.167.636.567.870/figure-collection-efficiency-quartzel-function-particle-diameter-loading.webp)