HAL Id: hal-00850163
https://hal.archives-ouvertes.fr/hal-00850163
Submitted on 5 Aug 2013
HAL is a multi-disciplinary open access
archive for the deposit and dissemination of
sci-entific research documents, whether they are
pub-lished or not. The documents may come from
teaching and research institutions in France or
abroad, or from public or private research centers.
L’archive ouverte pluridisciplinaire HAL, est
destinée au dépôt et à la diffusion de documents
scientifiques de niveau recherche, publiés ou non,
émanant des établissements d’enseignement et de
recherche français ou étrangers, des laboratoires
publics ou privés.
The SNCD as a Metrics for Image Quality Assessment
Avid Roman-Gonzalez
To cite this version:
Avid Roman-Gonzalez. The SNCD as a Metrics for Image Quality Assessment. International journal
of advanced computer science and applications (IJACSA), The Science and Information Organization,
2013, 4 (7), pp.40-47. �hal-00850163�
The SNCD as a Metrics for Image Quality
Assessment
A. Roman-Gonzalez
Abstract—In our era, when we have a lot of instrument
to capture digital images and they go more in more increasing the image resolution; the quality of the images become very important for different application, and the development tool to quality assessment is a current issue. In this paper, we propose to use the Symmetric Normalized Compression Distance (SNCD) as a metrics for the measurement of image quality, especially when we analyze residual errors. We also show performance comparisons of other metrics that we can found in the various research literatures and the SNCD. We also present an analysis about the performance of the SNCD depending to the type of distortion.1
Keywords—Quality metrics, NCD, SNCD, Kolmogorov
complexity, image quality.
I. INTRODUCTION
HE quality assessment of images is an issue very important since different automatic tools for signal processing were developed. The results given by these automatic tools can be affected if the image quality is not enough good. Thus, it is necessary an image analysis as is explained in [1].
In the literature, we can see that many metrics have been developed within the full-reference approach to allow comparison and thus an assessment of the quality between an image and its reference. Some quality metrics to assess images using the full-reference approach have also been evaluated in [2], [3] and [4].
Figure 1: Two images with same PSNR. The same amount of noise has been added to rectangular areas at the top (left) and at the bottom (right) of this image.
1
A. Roman-Gonzalez, Universidad Nacional San Antonio Abad del Cusco, Universidad Andina del Cusco, Universidad Alas Peruanas; Perú. & TELECOM ParisTech – France.
avid.roman-gonzalez@ieee.org
Each of the metrics evaluated in [2], [3] and [4] works better or worse in case of specific distortions. One of the best known metrics is the PSNR (peak signal to noise ratio) even if some results may appear to be inconsistent. For instance, if an equal amount of additive noise is added to different sections of an image, we obtain different image quality results based on a visual assessment as shown in Figure 1. Here, however, both images have the same PSNR = 35.29.
The visual effect of the distortions depends of the section where the artifacts have been placed. For this reason, it is necessary to look for another quality metric more correlated to the human subjective evaluation. In this work, we propose to use the SNCD that will be explained in follow.
An application of Kolmogorov Complexity is to estimate the shared information between two objects given by their Normalized Information Distance (NID) [5]. The NID is proportional to the length of the shortest program that can calculate x given y. The normalized information distance is calculated as follows:
,
,
min
,
max
,
K x y
K x K y
NID x y
K x K y
(1)where K(x) is the Kolmogorov complexity of x, K(y) is the Kolmogorov complexity of y, x and y are two strings to be compared, and K(x,y) is the joint Kolmogorov complexity of x and y. The NID result is a positive value r in the range of 0 ≤ r ≤ 1, with r = 0 if the objects are identical, and r = 1 stands for the maximum distance between them. However, the NID is not computable and therefore we need a computable approximation. A well-known approach is the Normalized Compression Distance NCD defined by [5] and by [6] considering K(x) as the compressed version of x, and taking it as a lower limit of what can be achieved with the compressor C. Thus, the Normalized Compression Distance (NCD) can be defined as shown in the following equation:
(
),
(
)
max
)
(
),
(
min
)
,
(
)
,
(
y
C
x
C
y
C
x
C
y
x
C
y
x
NCD
(2)where C(x, y) represents the size of compressed file obtained by the concatenation of x and y. We use this equation to estimate the NID.
The NCD can be calculated easily between two strings or two files x and y, and it shows how different these files are. We can use the NCD for various applications with different classes of data as a parameter-free approach [7], [8],
T
[9] and [10]. The NCD can also be used to classify the data by unsupervised methods [6]. The NCD returns a positive result 0 ≤ NCD ≤ 1+e, with e as a representation of potential inefficiencies of the compression algorithms. Please note that the K(x) approximation via C(x) depends on the data with which to work; we know that common compressors are based on different hypotheses; some are more efficient than others with specific data.
We analyzed the Normalized Compression Distance (NCD) that should be an approximation of the Normalized Information Distance (NID) in more detail [5]. The NID is a symmetric measure as the Kolmogorov Complexity K(x, y) = K(y, x). However, we observed experimentally that the NCD is not symmetrical, NCD(x, y) ≠ NCD(y, x). Therefore, we use a Symmetric Normalized Compression Distance (SNCD) defined as the arithmetic mean of NCD(x, y) and NCD(y, x). The SNCD is given by:
(
,
)
(
,
)
2
1
)
,
(
x
y
NCD
x
y
NCD
y
x
SNCD
(3)
( ), ( )
max 2 ) ( ), ( min 2 ) , ( ) , ( ) , ( y C x C y C x C x y C y x C y x SNCD (4)The structure of this paper is as follows: In Section II we present the image quality metrics that we use to compare with the SNCD. Section III presents the correlation coefficients that we use for the comparison step. In Section IV is shown a description of the database used for this work. Section V presents our results and analysis. Finally in Section VI we present the conclusions and discussion.
II. METRICSFOR IMAGE QUALITY ASSESSMENT
Multimedia images are always subject to a variety of distortions and modifications during the process of compression, transmission, reproduction, etc.
It is important to measure and identify the quality and quality degradation in the data in order to have control and a chance to improve the quality of the images.
To evaluate the quality of images, some methods use measures of comparison against a reference. In that sense, we have three approaches [11]:
The "full-reference” (FR) approach
The full-reference method requires full access to the original image as a reference. It is based on the following philosophy:
Distorted Signal = Reference Signal + Error Signal We assume that the reference signal has a perfect quality, and we quantify the error of visual perception.
The “non-reference” (NR) approach
The non-reference approach does not require any access to the original image, but the quality assessment
without reference is a very difficult task. Several researchers have done some work for the evaluation of specific distortions. The "reduced-reference” (RR) approach
The reduced-reference approach does not require full access to the original image but needs some partial information as references such as a set of extracted features.
The related research develops methods and algorithms that can automatically assess the quality of an image. [11] present a concept for quality-aware images. They use features extracted from the original image; the feature extraction is based on wavelet coefficients. [12] propose how to quantify lost image information and explore a relationship between image information and image quality. The authors of [13] investigated whether observers used structural cues to direct their fixation as they searched for simple embedded geometric targets at very low signal-to-noise ratios; the authors demonstrated that even in case of very noisy displays, observers do not search randomly, but in many cases they deploy their fixation to stimulus regions that resemble some aspect of the target in their local image features. [2] show an evaluation of different recent full reference image quality assessment methods, where they performed a subjective evaluation.
For comparison, in the present work, from the many existing metrics in the literature with a full reference approach, we use the PSNR and SSIM metrics that are also used and evaluated in [2] and [14].
The PSNR (Peak Signal-to-Noise Ratio) is given by:
MSE L PSNR 2 10 log 10 (5)
where MSE is the Mean Squared Error and L is the maximum dynamic range; for gray-scale images with 8 bits/pixel L = 255.
Another metrics is the SSIM (Structural Similarity Index) that has three independent components: luminance, contrast, and structure. The SSIM is given by:
3 3 2 2 2 2 1 2 2 1
)
,
(
2
)
,
(
2
)
,
(
))
,
(
),
,
(
),
,
(
(
C
C
y
x
s
C
C
y
x
c
C
C
y
x
l
y
s
s
y
x
c
y
x
l
f
SSIM
y x xy y x y x y x y x
(6) (7) (8) (9)where µx , σx and σxy represent the global mean, the standard deviation, and the cross-correlation. C1, C2 and C3 are selectable constants.
III. COMPARISONOF METRICS
In order to compare the different metrics and the SNCD, we use three correlation coefficients. These correlation coefficients are calculated from the results obtained by a subjective evaluation of images of the database and the results obtained by the metrics. This subjective assessment was performed by a group of experts who evaluated the degree of distortion of each image in the database.
The correlation measures we will use are:
- The Pearson correlation coefficient (PCC) is an index that measures the linear relationship between two quantitative random variables. Unlike the covariance, Pearson correlation is independent of the scale of the measured variables. To calculate the PCC, we use the following MATLAB instruction: corr(MOS, RG, 'type', 'Pearson'), where MOS is the result for the subjective evaluation, and RG is the result using the image quality metrics.
- The Spearman correlation coefficient (SCC) is a measure of correlation (association or interdependence) between two continuous random variables. To calculate it, the data is sorted and replaced by their ordered indices. We used the following MATLAB instruction: corr(MOS, RG, 'type', 'Spearman'), where MOS is the result for the subjective evaluation, and RG is the result using the image quality metrics.
- The Kendall correlation coefficient (KCC) is another non-parametric correlation measure. To calculate de KCC, we used the following MATLAB: corr(MOS, RG, 'type', 'Kendall'), where MOS is the result for the subjective evaluation, and RG is the result using the image quality metrics.
IV. DATABASE DESCRIPCTION
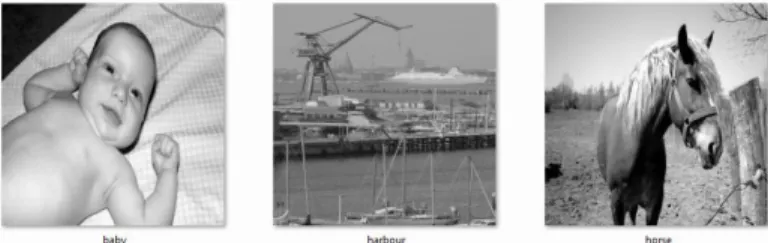
To perform SNCD metrics experiments and to make appropriate comparisons, we use a database that has already been used by other researchers and is available on the Internet. The database that we use is the Cornell-A57 collection [15], consisting of three original images (baby, harbor, and horse) as shown in Figure 2 and which also includes distorted images. For each original image, we have six types of distortion:
- Quantization of the LH (L = Low and H = High) sub-bands of a 5-level discrete wavelet transform, where the sub-bands were quantized via uniform scalar quantization (FLT)
- Additive white Gaussian noise (NOZ) - JPEG BaseLine compression (JPG)
- JPEG2000 compression without visual frequency weighting (JP2)
- JPEG2000 compression with the dynamic contrast-based quantization algorithm (DCQ)
- Blurring by a Gaussian filter (BLR)
For each type of distortion, we have 3 intensities; thus we have a database of 54 images (3 images × 6 distortion types × 3 distortion parameters).
Figure 2: Original images of Cornell-A57 database.
Each image has a size of 512×512 pixels; we can see that the baby picture and the horse picture contain a predominant object that we will use to analyze the behavior of our selected compression methods together with the existing metrics.
V. ANALYSISOF RESULTS
To evaluate the performance of the SNCD as a quality metrics, we made various experiment and also we analyzed the error maps. The errors E between the original image and the distorted image, are the absolute difference values between the original image X and the distorted image Y, E = abs (X - Y). In order to validate the error map importance, we calculate for:
- The SNCD comparing the original image X and the distorted image Y.
- The SNCD for the original image X, and the error map E.
- The SNCD for the error map E and the distorted image Y.
For the first tests, we calculated the quality measures of the images of the entire database, and compared them with the subjective evaluation using correlation coefficients explained above. The subjective evaluation was obtained from seven imaging experts by using a continuous rating system; greater values represent a greater distortion. The results are shown in Table 1.
COMPLETE DATABASE PCC SCC KCC PSNR 0.6347 0.6189 0.4309 SSIM 0.7528 0.8066 0.6058 SNCD XY jpeg 0.0967 0.1501 0.1287 SNCD XE jpeg 0.2943 0.1860 0.1217 SNCD EY jpeg 0.1245 0.1273 0.1063 SNCD XY zip 0.0929 0.0448 0.0518 SNCD XE zip 0.295 0.0278 0.0154 SNCD EY zip 0.0196 0.0789 0.0686
Table 1: Results of the comparison of different metrics to evaluate image quality using the correlation coefficients with the entire database of 54 images.
Fig. 3: Summary results of Table 1.
We can see that the best results are obtained by the classical metrics; we obtain a Pearson correlation of 0.7528 using SSIM metrics, a Spearman correlation of 0.8066, and a Kendall correlation of 0.6058. The values obtained by the SNCD are really very low, indicating that it is not a good representation of the subjective assessment of quality; we obtained for the SNCD between the X image and the E map the following values: a Pearson correlation of 0.2943, a Spearman correlation of 0.1860, and a Kendall correlation of 0.1217 using a JPEG lossless compressor.
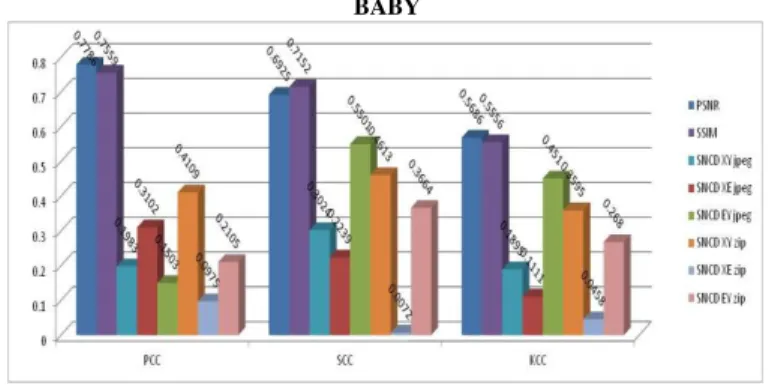
Another experiment we conducted was to sub-divide the database for each given parent image since, as mentioned above, the database contains two parent images with a predominant structure, and another parent image that does not have a predominant structure; then we could see how they behave with respect to the metrics. The results are shown in Tables 2 to 4. BABY PCC SCC KCC PSNR 0.7786 0.6925 0.5686 SSIM 0.7559 0.7152 0.5556 SNCD XY jpeg 0.1983 0.3024 0.1895 SNCD XE jpeg 0.3102 0.2239 0.1111 SNCD EY jpeg 0.1503 0.5501 0.4510 SNCD XY zip 0.4109 0.4613 0.3595 SNCD XE zip 0.0975 0.0072 0.0458 SNCD EY zip 0.2105 0.3664 0.2680
Table 2: Results of the comparison of the different metrics to evaluate image quality using the correlation coefficients for the 18 Baby images.
HARBOUR PCC SCC KCC PSNR 0.6137 0.7438 0.5461 SSIM 0.7375 0.8182 0.6382 SNCD XY jpeg 0.2312 0.0723 0.0066 SNCD XE jpeg 0.3629 0.2965 0.1645 SNCD EY jpeg 0.4642 0.1560 0.0724 SNCD XY zip 0.2773 0.0465 0.1118 SNCD XE zip 0.1945 0.0031 0.0461 SNCD EY zip 0.3626 0.1829 0.0855
Table 3: Results of the comparison of the different metrics to evaluate image quality using the correlation coefficients for 18 Harbour images.
HORSE PCC SCC KCC PSNR 0.7968 0.6863 0.4771 SSIM 0.7779 0.7936 0.5948 SNCD XY jpeg 0.3282 0.3230 0.2941 SNCD XE jpeg 0.2917 0.0423 0.0196 SNCD EY jpeg 0.0595 0.1538 0.0980 SNCD XY zip 0.3099 0.1950 0.1373 SNCD XE zip 0.0829 0.1373 0.1111 SNCD EY zip 0.1605 0.1889 0.1111
Table 4: Results of the comparison of the different metrics to evaluate image quality using the correlation coefficients for 18 Horse images.
When we sub-divide the database into smaller databases for each parent image, we see that the traditional metrics for image quality still show a better performance (see Figs. 6.22 to 6.24). We obtain a Pearson correlation of 0.7786 for baby when using PSNR, a Spearman correlation of 0.7152 using SSIM, and a Kendall correlation of 0.5686 using PSNR. For the harbour image we obtain a Pearson correlation of 0.7375 when using SSIM, a Spearman correlation of 0.8182 using SSIM, and a Kendall correlation of 0.6382 using SSIM. Finally, for the horse image we obtain a Pearson correlation of 0.7968 when using PSNR, a Pearson correlation of 0.7936 using SSIM, and a Kendall correlation of 0.5948 using SSIM. We also see that the performance of the SNCD has improved somewhat, although is still not comparable with the classical metrics, but it has improved somewhat compared with the experiment of the complete database. For the baby image, we obtain a Pearson correlation of 0.4109 when using SNCD XY, a Spearman correlation of 0.5501 using SNCD EY, a Kendall correlation of 0.4510 using SNCD EY. For the harbour image, we obtain a Pearson correlation of 0.4642 when using SNCD EY, a Spearman correlation of 0.2965 using SNCD XE, and a Kendall correlation of 0.1645 using SNCD XE. Finally, for the horse image we obtain a Pearson correlation of 0.3282 when using SNCD XY, a Spearman correlation of 0.3230 using SNCD XY, and a Kendall correlation of 0.2941 using SNCD XY.
We could imagine that SNCD can improve the comparison performance for images with predominant structure, but experience shows that it is not.
BABY
HARBOUR
Fig. 5: Summary results of Table 3.
HORSE
Fig. 6: Summary results of Table 4.
Therefore, the next experiment to perform is to sub-divide the database according to the type of distortion. In this case, we have 6 types of distortion with 9 images for each one. The results are shown in Tables 5 to 10.
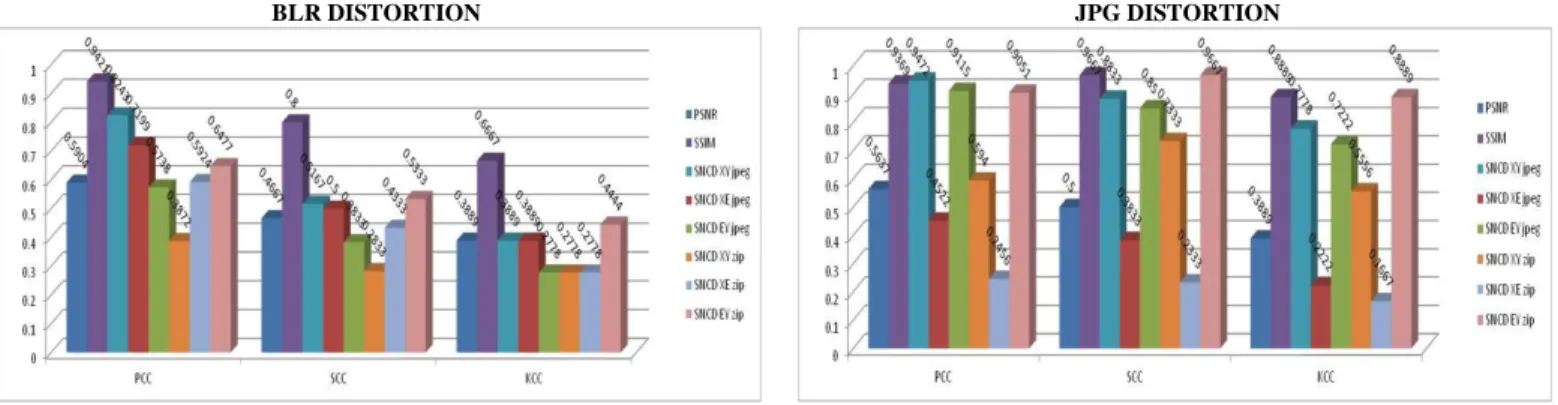
BLR DISTORTION PCC SCC KCC PSNR 0.5904 0.4667 0.3889 SSIM 0.9421 0.8000 0.6667 SNCD XY jpeg 0.8243 0.5167 0.3889 SNCD XE jpeg 0.7199 0.5000 0.3889 SNCD EY jpeg 0.5738 0.3833 0.2778 SNCD XY zip 0.3872 0.2833 0.2778 SNCD XE zip 0.5924 0.4333 0.2778 SNCD EY zip 0.6477 0.5333 0.4444
Table 5: Results of the comparison of different metrics to evaluate image quality using the correlation coefficients with images distorted by Blurring (9 images). DCQ DISTORTION PCC SCC KCC PSNR 0.5637 0.5000 0.3889 SSIM 0.9369 0.9667 0.8889 SNCD XY jpeg 0.9472 0.8833 0.7778 SNCD XE jpeg 0.4522 0.3833 0.2222 SNCD EY jpeg 0.9115 0.8500 0.7222 SNCD XY zip 0.5940 0.7333 0.5556 SNCD XE zip 0.2456 0.2333 0.1667 SNCD EY zip 0.9051 0.9667 0.8889
Table 6: Results of the comparison of different metrics to evaluate image quality using the correlation coefficients with images distorted by JPEG2000 + DCQ (9 images). FLT DISTORTION PCC SCC KCC PSNR 0.9100 0.9000 0.7222 SSIM 0.8982 0.8500 0.6667 SNCD XY jpeg 0.4327 0.3333 0.2222 SNCD XE jpeg 0.9533 0.9167 0.7778 SNCD EY jpeg 0.9432 0.9000 0.8333 SNCD XY zip 0.4342 0.2667 0.1667 SNCD XE zip 0.9519 0.9500 0.8333 SNCD EY zip 0.9803 0.9667 0.8889
Table 7: Results of the comparison of different metrics to evaluate image quality using the correlation coefficients with images distorted by a FLT allocation (9 images). JP2 DISTORTION PCC SCC KCC PSNR 0.7957 0.8000 0.6667 SSIM 0.8641 0.8167 0.6667 SNCD XY jpeg 0.6422 0.6833 0.5000 SNCD XE jpeg 0.7495 0.7000 0.5000 SNCD EY jpeg 0.7470 0.7000 0.5556 SNCD XY zip 0.1047 0.1500 0.1667 SNCD XE zip 0.6645 0.6333 0.5000 SNCD EY zip 0.6742 0.7167 0.5556
Table 8: Results of the comparison of different metrics to evaluate image quality using the correlation coefficients with images distorted by JPEG2000 Compression (9 images). JPG DISTORTION PCC SCC KCC PSNR 0.7008 0.6333 0.5000 SSIM 0.9178 0.9333 0.7778 SNCD XY jpeg 0.6659 0.7167 0.6111 SNCD XE jpeg 0.1015 0.4167 0.1667 SNCD EY jpeg 0.6852 0.7333 0.5556 SNCD XY zip 0.7225 0.7833 0.6111 SNCD XE zip 0.0300 0.0667 0.0556 SNCD EY zip 0.0163 0.0833 0.1111
Table 9: Results of the comparison of different metrics to evaluate image quality using the correlation coefficients with images distorted by JPEG Compression (9 images). NOZ DISTORTION PCC SCC KCC PSNR 0.9340 0.9500 0.8333 SSIM 0.8834 0.9500 0.8333 SNCD XY jpeg 0.3986 0.2500 0.2222 SNCD XE jpeg 0.3254 0.2833 0.2222 SNCD EY jpeg 0.4414 0.5000 0.3889 SNCD XY zip 0.5715 0.3333 0.3333 SNCD XE zip 0.8552 0.8333 0.7222 SNCD EY zip 0.9194 0.9167 0.8333
Table 10: Results of the comparison of different metrics to evaluate image quality using the correlation coefficients with images distorted by Gaussian Noise (9 images).
BLR DISTORTION
Fig. 7: Summary results of Table 5.
DCQ DISTORTION
Fig. 8: Summary results of Table 6.
FLT DISTORTION
Fig. 9: Summary results of Table 7.
JP2 DISTORTION
Fig. 10: Summary results of Table 8.
JPG DISTORTION
Fig. 11: Summary results of Table 9.
NOZ DISTORTION
Fig. 12: Summary results of Table 10.
The results of this experiment grouped by the type of distortion are very interesting. We have encouraging results for the SNCD. The performance of the SNCD has improved considerably in all cases. It outperforms the traditional metrics SSIM and PSNR for the DCQ case and for the filtering case; however, for the remaining distortion cases, the obtained values are quite comparable to the classical metrics (see Figs. 7 to 12):
- For BLR distortion, we obtain of a Pearson correlation of 0.8243 when using SNCD XY, a Spearman correlation of 0.5167 using SNCD XY, and a Kendall correlation of 0.4444 using SNCD EY.
- For DCQ distortion we obtain a Pearson correlation of 0.9472 when using SNCD XY, a Spearman correlation of 0.9667 using SNCD EY, and a Kendall correlation of 0.8889 using SNCD EY.
- For FLT distortion we obtain a Pearson correlation of 0.9803 when using SNCD EY, a Spearman correlation of 0.9667 using SNCD EY, and a Kendall correlation of 0.8889 using SNCD EY.
- For JP2 distortion we obtain a Pearson correlation of 0.7495 when using SNCD XE, a Spearman correlation of 0.7167 using SNCD EY, and a Kendall correlation of 0.5556 using SNCD EY;
- For JPG distortion we obtain a Pearson correlation of 0.7225 when using SNCD XY, a Spearman correlation of 0.7833 using SNCD XY, and a Kendall correlation of 0.6111 using SNCD XY.
- For NOZ distortion we obtain a Pearson correlation of 0.9194 when using SNCD EY, a Spearman correlation of 0.9167 using SNCD EY, and a Kendall correlation of 0.8333 using SNCD EY.
For all distortions cases, the performance of SNCD deteriorates as the method is based on data compression, and therefore, cannot identify the compression distortions, but still shows very comparable values.
In the experiments where we sub-divided the database by type of distortion we have good results for SNCD. Why we do not have the same results when we work with the database sub-divided per parent image, or when working with the entire database? A reason may be that the SNCD method properly evaluates the distortion or quality of the images, but does not consider the magnitude of the type of distortion for the entire database. This means that for the subjective assessment, some kind of distortion is more influential than another. In contrast, during SNCD computation, the sequence of distortion types can be rearranged; however, the SNCD determines with good approximation the intensity of the type of distortion. This holds for all results shown in the different tables.
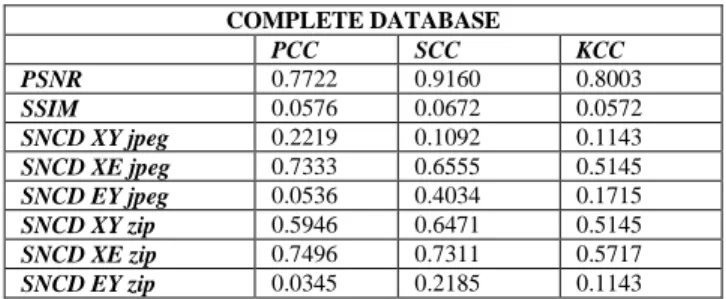
Another experiment is to have distorted images with the same or about the same mean squared error MSE. For this experiment, we take the original image of Figure 2 and create distorted images. We calculate the measure of quality of the images of the new database (9 distorted images for the original image shown in Figure 2; the distortions are: JPEG compression, JPEG2000 compression and Noise; all distortions with about the same MSE values between 3200 and 3400 and PSNR values between 22 and 24; these distorted images are shown in Figure 13) and compared them using the correlation coefficients explained above. The results are shown in Table 11.
Figure 13: Distorted images of the Cornell-A57 database with the same or about the same MSE.
COMPLETE DATABASE PCC SCC KCC PSNR 0.7722 0.9160 0.8003 SSIM 0.0576 0.0672 0.0572 SNCD XY jpeg 0.2219 0.1092 0.1143 SNCD XE jpeg 0.7333 0.6555 0.5145 SNCD EY jpeg 0.0536 0.4034 0.1715 SNCD XY zip 0.5946 0.6471 0.5145 SNCD XE zip 0.7496 0.7311 0.5717 SNCD EY zip 0.0345 0.2185 0.1143
Table 11: Results of the comparison of different metrics to evaluate image quality using the correlation coefficients with the entire database of 9 images.
VI. CONCLUSIONSAND DISCUSSION
The results obtained by the classical metrics, are better than the SNCD when we analyze the complete database.
When we sub-divide the database into smaller databases for each parent image, the traditional metrics still show a better performance, it was in contrast to our idea (we imagined that SNCD can improve the comparison performance for images with predominant structure).
The results for the experiment grouped by the type of distortion are very interesting. We have encouraging results for the SNCD. The SNCD outperforms the traditional metrics SSIM and PSNR for the DCQ case and for the filtering case; however, for the remaining distortion cases, the obtained values are quite comparable to the classical metrics. A reason for that may be that the SNCD method is based on compression techniques and cannot to evaluate distortions produced by compressors.
The SNCD method properly evaluates the distortion or quality of the images, but does not consider the magnitude of the type of distortion for the entire database. This means that for the subjective assessment, some kind of distortion is more influential than another. In contrast, during SNCD computation, the sequence of distortion types can be rearranged; however, the SNCD determines with good approximation the intensity of the type of distortion.
The SNCD as a metrics for assessing image quality is limited to a single type of distortion with different levels of intensity.
VII. REFERENCES
[1] A. Roman-Gonzalez, “Digital Images Analysis”, Revista ECIPeru, vol. 9, N° 1, 2012, pp. 61-68.
[2] H. R. Sheikh, M. F. Sabir, A. C. Bovik, “A Statistical Evaluation of Recent Full Reference Image Quality Assessment Algorithms”, IEEE Transactions on Image Processing, vol. 15, N°. 11, 2006, pp. 3441-3451.
[3] I. Avcibas, B. Sankur, K. Sayood, “Statistical Evaluation of Image Quality”, Journal of Electronic Imaging, vol. 11, N° 2, 2002, pp. 206-223.
[4] I. Avcibas, “Image Quality Statistics and Their Use in Steganalysis and Compression”, PhD Thesis – Bogazici University, Istanbul/Istanbul Province, Turkey, 2001.
[5] M. Li and P. Vitányi, “The Similarity Metric”, IEEE Transaction on Information Theory, vol. 50, N° 12, 2004, pp. 3250-3264.
[6] R. Cilibrasi, P. M. B. Vitanyi; “Clustering by Compression”, IEEE Transaction on Information Theory, vol. 51, N° 4, April 2005, pp 1523 - 1545.
[7] M. R. Quispe-Ayala, K. Asalde-Alvarez, A. Roman-Gonzalez, “Image Classification Using Data Compression Techniques”; 2010 IEEE 26th Convention of Electrical and Electronics Engineers in Israel – IEEEI 2010; Eilat – Israel; November 2010, pp. 349-353. [8] E. Keogh, S. Lonardi, Ch. Ratanamahatana, “Towards
Parameter-Free Data Mining”, Department of Computer Science and Engineering, University of California, Riverside.
[9] B.J.L. Campana y E.J. Keogh, “A Compression Based Distance Measure for Texture”, University of California, Riverside, EEUU 2010.
[10] A. Roman-Gonzalez, “Clasificación de Datos Basado en Compresión”, Revista ECIPeru, vol. 9, N° 1, 2012, pp. 69-74. [11] Z. Wang, G. Wu, H. R. Sheikh, E. P. Simoncelli, E. Yang, A. C.
Bovik; “Quality-Aware Images”; IEEE Transaction on Image Processing.
[12] H. R. Sheikh, A. C. Bovik, “Image Information and Visual Quality”, IEEE Transactions on Image Processing, vol. 15, N° 2, 2006, pp. 430-444.
[13] U. Rajashekar, A. C. Bovik, L. K. Cormack, “Visual Search in Noise: Revealing the Influence of Structural Cues by Gaze-contingent Classification Image Analysis”, Journal of Vision, vol. 6, N° 4, 2006.
[14] Z. Wang, Q. Li, “Information Content Weighting for Perceptual Image Quality Assessment”, IEEE Transactions on Image Processing, vol. 20, N° 5, 2011, pp. 1185-1198.
[15] E. P. Simoncelli, E. H. Adelson, “Nonseparable QMF Pyramids”, Proc. SPIE, Visual Comm and Image Proc. IV, vol. 1199.3, 1989, pp. 1242-1246.