HAL Id: hal-01789170
https://hal.archives-ouvertes.fr/hal-01789170
Submitted on 9 May 2018HAL is a multi-disciplinary open access archive for the deposit and dissemination of sci-entific research documents, whether they are pub-lished or not. The documents may come from teaching and research institutions in France or abroad, or from public or private research centers.
L’archive ouverte pluridisciplinaire HAL, est destinée au dépôt et à la diffusion de documents scientifiques de niveau recherche, publiés ou non, émanant des établissements d’enseignement et de recherche français ou étrangers, des laboratoires publics ou privés.
Elucidating the origin of superior electrochemical cycling
performance: new insights on sodiation–desodiation
mechanism of SnSb from operando spectroscopy
Marcus Fehse, Moulay Sougrati, Ali Darwiche, Vincent Gabaudan, Camille La
Fontaine, Laure Monconduit, Lorenzo Stievano
To cite this version:
Marcus Fehse, Moulay Sougrati, Ali Darwiche, Vincent Gabaudan, Camille La Fontaine, et al.. Elucidating the origin of superior electrochemical cycling performance: new insights on sodiation– desodiation mechanism of SnSb from operando spectroscopy. Journal of Materials Chemistry A, Royal Society of Chemistry, 2018, 6 (18), pp.8724-8734. �10.1039/c8ta02248h�. �hal-01789170�
Elucidating the origin of superior electrochemical
cycling performance: new insights on
sodiation-desodation mechanism of SnSb from
operando spectroscopy
Marcus Fehse,
∗,†,‡,¶Moulay T. Sougrati,
§,kAli Darwiche,
§Vincent Gabaudan,
§Camille La Fontaine,
⊥Laure Monconduit,
§,k,¶and Lorenzo Stievano
∗,§,k,¶†Dutch-Belgian (DUBBLE), ESRF-The European Synchrotron, CS 40220, 38043 Grenoble
Cedex 9, France.
‡Faculty of Applied Sciences, Delft University of Technology, Delft, Netherlands. ¶Alistore European Research Institute, Universit´e de Picardie Jules Verne, 33 rue Saint
Leu, 80039 Amiens Cedex, France.
§Institut Charles Gerhardt - AIME (CNRS UMR 5253), Universit´e de Montpellier, CC 1502, Pl. E. Bataillon, 34095 Montpellier Cedex 5, France.
kReseau sur le Stockage Electrochimique de l’Energie (RS2E), CNRS FR3459, 33 Rue
Saint Leu, 80039 Amiens Cedex, France.
⊥Synchrotron Soleil, L’Orme des Merisiers, Saint-Aubin, BP 48, 91192 Gif-sur-Yvette
Cedex, France.
E-mail: marcus.fehse@esrf.fr; lorenzo.stievano@umontpellier.fr
Abstract
in Na-ion than in Li-ion batteries in spite of its even larger volume expansion. Where is this special behaviour coming from?
In this work, the reversible sodiation-desodiation reaction of SnSb was investigated by simultaneous operando Sn and Sb K-edge X-ray absorption spectroscopy along with
operando 119Sn M¨ossbauer spectroscopy. Chemometric tools such as Principal Com-ponent Analysis and Multivariate Curve Resolution - Alternating Least Squares were used to analyse the whole data sets to gain information on the nature and sequence of formation of different species during electrochemical cycling vs. Na. The obtained results indicate that the sodiation reaction is a two-step process clearly distinct from the reaction of SnSb vs. Li. Firstly Sb is sodiated to form Na3Sb and an intermediate phase of nanosized metallic Sn, which we were able to identify as α-Sn, commonly unstable at ambient conditions. During the second step, this tin phase is fully sodiated to form Na15Sn4, as rarely observed for pure Sn-based electrodes. Finally, EXAFS analysis proves that the amorphous SnSb phase formed after one complete cycle is clearly distinct from the pristine material.
These new insights on the mechanism of SnSb vs. Na provide a basis for under-standing the exceptional electrochemical performance, which is superior not only to SnSb vs. Li but also to Sn vs. Na. The key to the enhanced cycle life and capacity re-tention lies in the gradual formation of amorphous, nano-confined intermediate phases and correlated elastic softening of highly sodiated tin and antimony phases which have enhanced ability to absorb and mitigate the strong volume changes occurring upon sodiation and desodiation.
Keywords
X-ray absorption spectroscopy, M¨ossbauer spectroscopy, Chemometrics, MCR-ALS, Na-ion batteries, Alloy-type reaction, SnSb
1
Introduction
Although SnSb-based alloy-type materials were already proposed as candidates for lithium-ion battery negative electrodes more than 20 years ago,1 their application as an alternative
high-capacity anode material for sodium-based batteries (NIB) has only shifted in the focus of research in the last five years. While severe volume changes upon sodiation poses a serious degradation threat, recent studies have shown encouraging results that these obstacles can be mitigated and reversible capacities in the range of 350-525 mAh g−1 for 100-200 cycles with decent coulombic efficiency are attainable.2–6 Moreover we have recently shown that a
SnSb electrode without any sophisticated preparation can reach a capacity of 700 mAh g−1 at low rate (11 mA g−1) and a stable capacity of 500-550 mAh g−1 at high rate (111 mA g−1) over many cycles.7 In their very recent study Qin et al. demonstrate that via embedding
SnSb nanocrystalls in a graphene scaffold the capacity can be stabilized over thousands of cycles.8Such outstanding electrochemical performance make SnSb one of the most promising
negative electrode materials for NIB. The remarkable cycle life of SnSb vs. Na, which exceeds by far the one observed vs. Li for the same electrode, comes as a surprise considering the huge volume expansion (226%) expected for the reaction of SnSb with ≈4.9 Na. The fact that Sn metal cycles poorly vs. Na but within SnSb alloy the sodiation of tin contributes strongly to the reversible capacity is another curiosity.
The exceptional electrochemical performance of SnSb vs. Na has spurred several studies investigating the electrochemical sodiation process. Xiao et al. were the first to suggest that the sodiation of SnSb occurs via a two-step reaction process.9 In a recent study we have shown that the electrochemical mechanism of SnSb vs. Na is not the simple combi-nation of those of Sn and Sb metals vs. Na, and that it is clearly distinct from the SnSb lithiation mechanism.7 Baggetto et al. studied the reaction mechanism via an ex situ XRD
and M¨ossbauer analysis. However, due to amorphization upon reaction and the extended use of only ex situ characterizations, the obtained information content is somewhat lim-ited and remains partially ambiguous.10 In particular, the authors claimed the simultaneous
formation of sodiated Sn and Sb species, providing a rather questionable interpretation of their M¨ossbauer spectra and justification of the unexpected presence of unusual quadrupole splitting and isomer shift values by the occurrence of nanosizing and large disorder in the ob-tained phases. Allan et al. carried out NMR and PDF analysis to elucidate the intermediate species but focusing solely on the sodiation of Sb and not on SnSb.11 Consequently, in spite
of the above mentioned studies, the scientific community still lacks a thorough understanding of the processes occurring upon sodiation of SnSb.
In order to elucidate the excellent performance of SnSb in NIB, superior to those mea-sured in LIB under similar conditions,7 we carried out an in-depth analysis of the reversible
sodiation reaction of SnSb via operando X-ray diffraction (XRD), XAS, and M¨ossbauer spec-troscopy. For data analysis and extraction of reliable information, a chemometric approach including Principal Component Analysis (PCA) and Multivariate Curve Resolution - Al-ternating Least Squares (MCR-ALS) was used. In previous studies, it was shown that the application of PCA and MCR-ALS on operando X-ray absorption spectroscopy (XAS) data sets is a smart and elegant way to analyze large data sets and extract key information which are rather difficult to access otherwise.12–17 Very recently we demonstrated that it can also
be applied to operando M¨ossbauer data sets.18 This chemometric approach allows the
iden-tification of the main contributing components as well as the analysis of their local structure and their order of appearance and disappearance during the electrochemical reaction.
2
Experimental
2.1
Material synthesis and electrode formulation
Electrode materials were prepared via ball milling as previously reported.7 Self-supported
electrodes were made from an aqueous slurry containing SnSb active material, carbon black ground carbon fibres VGCF-S and PTFE binder in the ratio 70:6:6:18 with a loading variable from ≈ 2 to 15 mg cm−2. High-loading electrodes were necessary for the operando XAS
analysis, in order to obtain a sufficiently high signal-to-noise ratio in the measured spectra. The mixture was thoroughly mixed in a planetary ball-mill for 1 h, tape casted on a thin aluminum foil (thickness ≈ 7 µm), dried at room temperature and subsequently at 100◦C
under vacuum.
2.2
Operando X-ray Absorption Spectroscopy
XAS measurements at the Sn and Sb K-edge were performed in the transmission mode at the SAMBA beamline of Synchrotron SOLEIL in Gif-sur-Yvette (France). A Si(220) double crystal monochromator with an energy resolution of 1 eV at 30 keV was used. The intensity of the monochromatic X-ray beam was measured by three consecutive ionization detectors. The operando electrochemical cell19 was placed between the first and the
sec-ond ionization chambers. The homogeneity of the sample was checked before running the electrochemical test. The latter was carried on continuously for the first cycle and a half (discharge/charge/discharge) with a cycling rate of C/3, whereas 1 C corresponds to the reaction of 1 mol of Na with 1 mol of SnSb.
In the XANES (X-ray absorption near-edge structure) region of Sn and Sb K-edges (29200 and 30491 eV , respectively), equidistant energy steps of E = 1 eV were used. For all measured spectra, the exact energy calibration was established with simultaneous absorption measurements on a SnSb reference pellet placed between the second and the third ionization chamber. The first inflection point of the XAS pattern of Sb (30491 eV ) was used for the energy calibration. The absolute energy reproducibility of the measured spectra was ±0.1 eV . EXAFS (Extended X-ray Absorption Fine Structure) spectra were collected up to k = 15 ˚A−1. The spectra of the pure reference compounds (Sb, Na3Sb, Sn) were extracted and
fitted using the IFEFFIT software package.20Fourier transform of EXAFS oscillations with different k weights was carried out in k-range from 3.0 to 12.0 ˚A−1. Fitting was performed in R-range from 1.6 to 4.6 ˚A using k2 and k3 weights. EXAFS amplitudes and phase-shifts
Na15Sn4, α-Sn and Sb metal (vide infra). Interatomic distances (R) and the Debye-Waller
factors (σ2) were calculated for all paths included in the fits.
2.3
119Sn M¨
ossbauer spectroscopy
Transmission 119Sn M¨ossbauer spectroscopy measurements were carried out with a source of 119mSn in a matrix of CaSnO
3. During the measurement, the source was always kept at room
temperature. The velocity scale was calibrated with the magnetically split sextet spectrum of a high-purity α-Fe foil as the reference absorber, using a 119Co:Rh source. 119Sn isomer
shifts are given relative to the CaSnO3 source. The M¨ossbauer spectrometer was operated
with a triangular velocity wave. A LiF scintillation detector was used for the detection of the γ-rays. The measured spectra (or the derived MCR-ALS components, vide infra) were fitted to appropriate combinations of Lorentzian profiles by least-squares methods. In this way, spectral parameters such as quadrupole splitting (∆), isomer shift (δ), linewidth (Γ) and relative resonance areas of the different spectral components were determined. These data are reported in Tab. 3. Simultaneously to M¨ossbauer acquisition, X-ray diffraction patterns were collected in joint setup previously reported.21,22
Operando measurements were performed at room temperature using the same in situ cell
used for the operando XAS measurements.19
Ex situ measurements at variable temperature were performed in a close-cycle helium
flow cryostat (Janis SH-850). For the ex situ measurements of cycled electrodes, the cells were discharged at C/6 rate, and then transferred to the glove box before disassembly. The electrodes were mounted in air-tight sealed sample holders to avoid any contamination from ambient atmosphere before and during the collection of M¨ossbauer spectra. Debye temperatures ΘD were calculated from the temperature dependence of the M¨ossbauer spectra measured between ambient temperature (300 K) and 12 K following the procedure which has been described in detail elsewhere.23
2.4
Chemometric data analysis
The operando EXAFS and M¨ossbauer spectra were first globally analyzed using a statistical tool named Principal Component Analysis (PCA) using the computer program Matlab.24 PCA is a chemometric factor analysis tool, and is generally used to discover the minimal particular structures in multivariate spectral data sets. More precisely, it is used here to de-termine the number of independent components contributing to the whole series of collected spectra during electrochemical cycling. The number of principal components determined in this way was used as the basis for Multivariate Curve Resolution-Alternating Least Squares (MCR-ALS) analysis.25,26 This algorithm allows the stepwise reconstruction of the spectral
components which are necessary for interpreting the whole multiset of operando spectra. The MCR-ALS analysis for EXAFS data was performed on normalized absorption spectra with the following constraints: (i) non-negativity of the concentration of the components, (ii) unimodality for one of the components, reflecting the irreversible transformation of the pristine material and (iii) closure (sum of the components concentrations always equal to 100%). The reconstructed spectral components were then fitted using the IFEFFIT software package in the same way as for the reference compounds.
For M¨ossbauer spectra only unimodality and non-negativity conditions were applied but no closure constraint was applied to allow for an additional degree of freedom. The re-constructed components were fitted to appropriate combinations of Lorentzian profiles by least-squares methods, as described in Sec. 2.3.
3
Results
3.1
Operando XAS
The electrochemical signature of the SnSb alloy during the first three processes (sodia-tion/desodiation/sodiation) is shown in Fig. 1 along with markers indicating the acquisition
of XAS spectra. A characteristic feature of the electrochemical cycling curve is the presence of two plateaus suggesting a two-step process reaction. Similar to conversion-type materials, the first discharge is taking place at lower potentials than subsequent.27 This can be linked
to restructuring and nanosizing of the electrode material, in line with previous reports.10
Figure 1: (a) Electrochemical signature of subsequent sodiation/desodiation and sodiation at C/3 rate of SnSb during operando XAS acquisition. (b) Typical electrochemical cycling curve of SnSb vs. Na and its derivative (inset) at C/2.
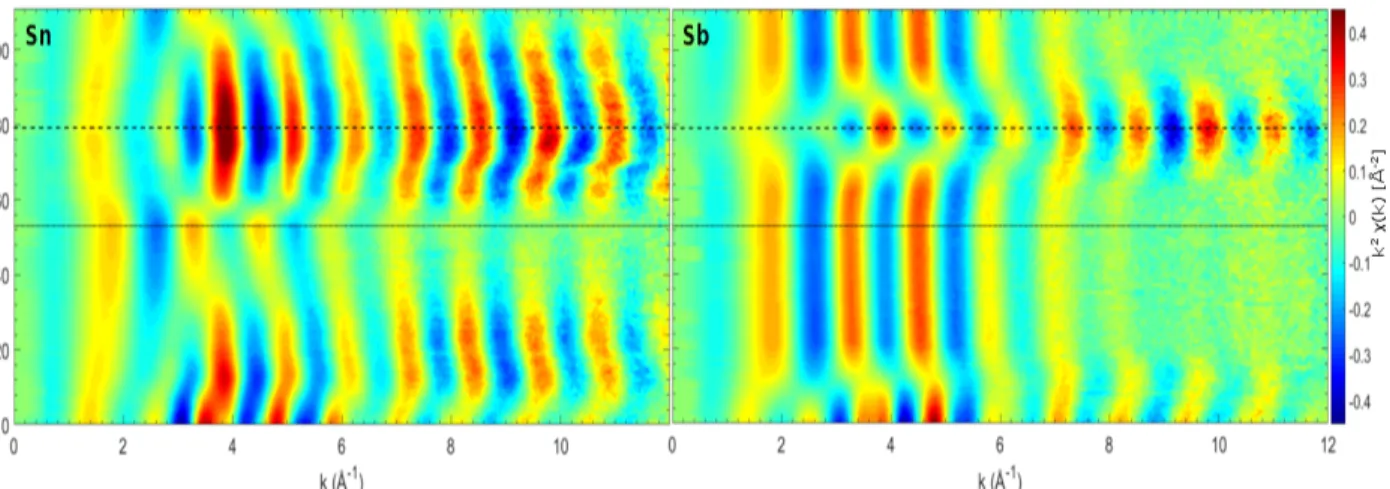
The operando Sn and Sb K-edges EXAFS spectra collected during the first three processes are shown in Fig. 2 (left) and (right), respectively. Even though the absorption edges shift noticeably during the different electrochemical processes, their features are rather broad and badly defined, and their shape varies only very little. This result is somehow expected, since the very high energy of the absorption K-edges of Sb and Sn is connected to a very short lifetime of the core-hole, resulting in a low energy resolution of the absorption edge. Consequently, the XANES part of the spectra carry very little information and could not be used to identify the different species formed during the process.
When comparing the evolution of EXAFS spectra shown in Fig. 2, it is striking that the main changes of Sn and Sb do not occur simultaneously. During first discharge Sb spectra change strongly up to spectra #15 and then remain almost unaltered during remainder of discharge. Sn spectra on the other hand reveal only a shift of the EXAFS oscillation to higher k values up to spectra #15 but then the amplitude of the EXAFS oscillation
strongly decreases upon continuous sodiation. These differences suggest a complex multi-step electrochemical process.
Figure 2: Operando Sn (left) and Sb (right) K-edge EXAFS spectra collected upon sodia-tion/desodiation and further sodiation process of a SnSb electrode. Dotted line marks the end of first discharge (#53), dashed line marks the end of first complete cycle (#79).
The oscillations of the EXAFS part are rather intense and visible up to k = 12 ˚A−1 for both Sn and Sb K-edge spectra, and can thus be used successfully to describe the average coordination around the Sn and Sb centres, respectively. The two sets of operando EXAFS data were analysed separately using PCA in order to avoid an over-interpretation of the experimental data, and to extract the maximum amount of useful information independently for Sn and Sb. The variance plots obtained is shown in Fig. 3 and indicates that over 94% of the variance of the EXAFS spectra can be described by using three principal components for Sb, whereas four components were included in the case of Sn to achieve over 98% of variance. The residual part stems from the experimental noise.
Even though the so-obtained principal components are only orthogonal mathematical functions and not real EXAFS spectra, their determination reveals the number of indepen-dent spectral components that can be used to fit the whole set of experimental data. Several methodologies are then available to reconstruct the corresponding real EXAFS components as well as their evolution. In this case, the MCR-ALS analysis was used25,26 producing pure
Figure 3: Variance plots obtained by PCA analysis for Sb (×) and Sn (◦). The dashed lines indicates the 99% threshold below which the origin is considered as experimental noise. Three and four components have to be taken into consideration for reconstructing the full data set of Sb and Sn, respectively.
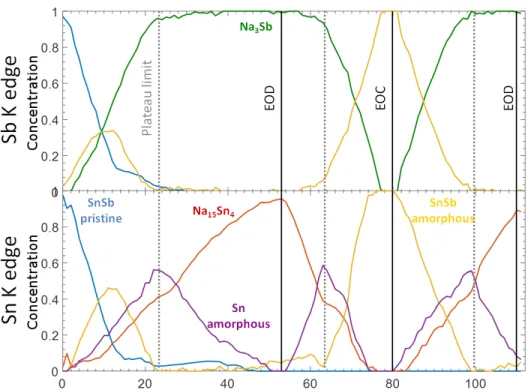
cycling, see Fig. 4.
These components correspond perfectly to specific spectra measured along the operando measurements, in line with their observed evolution: component 1 produced from the analysis of the Sb spectra, for instance, is practically identical to the Sb K-edge EXAFS spectrum of pristine SnSb. On the other hand, component 2 is identical to spectrum obtained at the end of the first discharge, i.e., to full sodiation, whereas component 3 resembles perfectly the spectrum obtained at the end of the charge process, corresponding to the fully desodiated electrode. A similar attribution can be made also for the first three components identified for the Sn K-edge spectra. Component 4, necessary only in the case of Sn, represents the formation of an intermediate Sn species which reaches its maximum at the end of the first plateau of the electrochemical curve (see dotted line, Fig. 4). From previous studies this suggests its attribution to a form of amorphous metallic Sn.7,9
The reconstructed pure components were fitted in the traditional way, starting from the known structures. The results of the EXAFS fit for Sn and Sb K-edge, see S.I., are reported in Tab. 1 and 2, respectively. Optimum fit for component 1 of Sn was achieved using 3 Sn-Sn(Sb) shells corresponding to the published structure of SnSb. For the second component the optimum fit was obtained using 3 Sn-Na shells, similar to the structure published for Na15Sn4, whereas fits with other sodiated tin phases (e.g. Na9Sn4) did not lead to satisfactory
Figure 4: Evolution of the concentrations of the MCR-ALS spectral components for Sb (top) and Sn (bottom) K-edges during subsequent sodiation, desodiation and sodiation.
results. For the third component best fit was achieved using a single shell of Sn-Sn(Sb) which corresponds to an amorphous form of SnSb (or Sn) with lower coordination and quite short bond distances. Fitting of the 4th component is somewhat similar involving solely one Sn-Sn shell corresponding to an amorphous Sn with bond distance at 2.94 ˚A, somehow in between those reported for α and β-Sn, and a coordination number of 4, identical to that of α-tin. It is interesting to notice that tetragonal β-tin, also known as white tin, is the stable polymorph of tin at ambient conditions, and is characterised by a coordination number of 6, corresponding to a distorted octahedron with two different bond distances (4 neighbours at 3.02 ˚A and 2 neighbours at 3.18 ˚A). The α-Sn allotrope, on the other hand, is known as grey tin, has a highly symmetric diamond-like structure with a perfect four-fold coordination shell at 2.81 ˚A, and is usually stable only below 13.2◦C.28,29
Component 1 of the Sb K-edge spectra, representing pristine SnSb is fitted in the identical way as the Sn K-edge spectrum, starting from the crystal structure of the pure compound. The fitting of component 2 can be performed using the first two Sb-Na shells of hexagonal
Na3Sb. It is noteworthy that unlike our previous study in which we were able to identify
both cubic and hexagonal Na3Sb,30 such a distinction is impossible in this study since we
only see the first shell of next neighbours. Such limited range in R-space renders the two polymorphs indistinguishable from an EXAFS viewpoint, hence we observe an average of the two phases. Finally, component 3 can be fitted by using simply the first coordination shells of Sb metal, with a significant decrease of the average Sb-Sb distance and half the number of nearest neighbours of Sb metal. The presence of a tri-coordinated Sb-Sb shell with a Sb-Sb interatomic distance lower than in Sb metal reminds of the long known structure of amorphous “explosive” antimony, synthesized by Krebs et al. via electrolysis of antimony chloride.31 The proposed structural model for this phase is based on a disordered network of
antimony, where all antimony atoms are bonded to three other ones with a Sb-Sb distance sensibly lower than in Sb metal. A large range of coordination angles results in the total disappearance of the spectral contributions beyond the first nearest neighbour shell, and an absence of long-range order. It is important to notice that such interpretation is in complete agreement with the totally flat X-ray diffraction pattern observed at the end of the charge process, previously published.7
Table 1: EXAFS fitting parameters of MCR-ALS components of Sn K-edge Component Shell N Rtheo[˚A] Rf it [˚A] σ2 [˚A]2 S20
M-Sn/Sb 6 3.113 2.974(9) 0.016(1) 0.85(9) 1 M-Sn/Sb 6 4.379 4.15(4) 0.020(5) 0.85(9) M-Sn/Sb 6 4.426 4.33(3) 0.017(1) 0.85(9) M-Na 3 3.221 3.16(1) 0.009(1) 0.85* 2 M-Na 6 3.432 3.39(2) 0.028(7) 0.85* M-Na 3 3.529 3.75(8) 0.032(9) 0.85* 3 M-Sn/Sb 3.5 3.113 2.866(3) 0.0065(2) 0.85* 4 M-Sn/Sb 4 3.022β/ 2.810α 2.936(3) 0.0058(2) 0.85* β β-Sn α α-Sn
* values without error have been fixed during the fit **all goodness of fit values are lower than 0.02 (R values)
could be evidenced. This result is somehow in contradiction not only with the work of
Baggetto et al.,32 who suggested the formation of an amorphous form of NaSb as an
inter-mediate phase during the discharge, but also with more recent results that we obtained by
operando Pair Distribution Function (PDF) and ex situ 23Na Solid State Nuclear Magnetic
Resonance analysis in the case of pure Sb.11 In that work, two different electrochemically
formed intermediates were identified: (i) amorphous Na3−xSb (with x ≈ 0.4 to 0.5), having
a local structure similar to crystalline Na3Sb but with a significant number of sodium
vacan-cies and a limited correlation length, and (ii) amorphous Na1.7Sb, with a highly amorphous
structure featuring some Sb-Sb bonding. Even though the first of these two phases seems to form during the first sodiation, the second one is expected to appear only during the following desodiation. It is important to notice that such phases, even though mostly amor-phous, can be identified by PDF in the direct space using the series of peaks from 2 to about 10 ˚A. Contrary to PDF, in the EXAFS spectra measured during the operando processes, only the first coordination shell is visible due to the amorphous nature of the samples, with the notable exception of pristine SnSb where also the second coordination shell is visible. This limit of EXAFS compared to PDF is inherent to the nature of the probe: scattered electrons and X-rays in EXAFS and PDF, respectively, which have different diffusion path lengths in the materials. Therefore, even though EXAFS is more sensitive to the nature of the neighbouring atoms, and Sb atoms can thus be distinguished from the Na ones in the fits, the analysis remains restricted to the neighbours corresponding to only the first peak of the PDF signal, and is probably not sufficient to differentiate among many possible amorphous phases characterised by similar nearest-neighbours distances, which is the case of the intermediates proposed by Allan et al.11 A parallel study on the sodiation/desodiation
of Sb performed in the same way proves exactly the same inability of spotting intermediate species, confirming that EXAFS is not the appropriate probe to identify such phases. (ref submitted to journal)
Table 2: EXAFS fitting parameters of MCR-ALS components of Sb K-edge
Component Shell N Rtheo[˚A] Rf it [˚A] σ2 [˚A]2 S20
M-Sn/Sb 6 3.113 2.944(7) 0.013(1) 0.80(6) 1 M-Sn/Sb 6 4.379 4.13(4) 0.021(8) 0.80(6) M-Sn/Sb 6 4.426 4.30(3) 0.016(5) 0.80(6) M-Na 3 3.093 3.04(3) 0.010(4) 0.80* 2 M-Na 2 3.171 3.18(4) 0.007(4) 0.80* M-Na 6 3.481 3.62(6) 0.030(7) 0.80* 3 M-Sn/Sb 3 3.113 2.850(5) 0.0063(3) 0.80* * values without error have been fixed during the fit
**all goodness of fit values are lower than 0.02 (R values)
see S.I.. The small differences observed can be ascribed to slightly different S2
0 amplitude
reduction factors observed experimentally for the two metals which originate from the ball milling induced disorder. Since Sn or Sb neighbours are indistinguishable from an EXAFS point of view on both Sn and Sb K-edge spectra, similar spectra indicate the presence of virtually identical neighbours around two metal centres. This is reflected by EXAFS fitting results, showing very similar bond distances and σ2, see Tab. 1 and 2. In the same way Sb and Sn K-edge spectra of the 3rd component (EOC) of amorphous SnSb are very similar (see S.I.), whereas here the difference in intensity leads to slightly different coordination numbers. However, practically the same bond distance and σ2 are obtained while fitting.
The similarity of the Sb and Sn K-edge of the EOC phase is in line with the reformation of the SnSb alloy. We would like to point out that the phase obtained at the EOC is different from the amorphous tin metal intermediate, which is formed during the first plateau and reaches its maximum concentration at the plateau limit, see dotted line in Fig. 4.
3.2
119Sn M¨
ossbauer spectroscopy
Evolution of the operando 119Sn M¨ossbauer spectra during the first discharge along with corresponding electrochemical curve are shown in Fig. 5. In the pristine state, the M¨ossbauer plot reveals a dominant feature at 2.4-2.8 mm s−1 which loses its intensity upon discharge.
Starting from spectra 5 a new signal centered at about 2 mm s−1arises and disappears around spectra #11 again. The spectra #13 and #14 were lost due to instrumental problems. After recovery of the signal, only a very weak spectral feature is visible in spectrum #15, which continues to decrease upon further sodiation.
Figure 5: Left: Evolution of the 119M¨ossbauer spectra collected during the first discharge of SnSb vs Na. Please note that spectra #13 & 14 were lost due to technical issues. Right: Cor-responding electrochemical discharge curve, marked points indicate acquisition of M¨ossbauer spectra.
In order to avoid over- and misinterpretation of the data set a PCA + MCR-ALS approach was pursued. Three orthogonal independent components were identified via PCA (see S.I.) and reconstructed into real spectral components using MCR-ALS. To follow the evolution of these components upon sodiation, MCR-ALS was applied using only two components, while the third one was considered as inherent, representing the flat spectrum at EOD state. The evolution of their relative intensities upon one complete discharge is shown in Fig. 6. The concentration profile depicts that before discharge there is one single component (named MCR#1) which decreases upon sodiation while a second component (called MCR#2) rises and reaches its maximum around spectrum #8 before starting to slowly fade away. In the final four spectra only small residue of MCR#1 is present.
The reconstructed pure M¨ossbauer components were fitted in a traditional way, see S.I.. The obtained parameters are presented Tab. 3. MCR#1 can be fitted using two subspectra: a dominant spectral component which can be unambiguously attributed to SnSb, while a
Figure 6: Evolution of concentrations of the MCR-ALS spectral components of the M¨ossbauer signal during a discharge(sodiation) of SnSb.
second minor contribution is identified as nanosized SnO2 stemming from surface oxidation of
Sn, with a share of ≈5%, obtained via weighing absorption area ratio with Lamb-M¨ossbauer factor.
In the case of MCR#2, a single spectral contribution with an isomer shift of 1.93 mm s−1 is observed. Such an isomer shift cannot be attributed to any known sodiated tin NaxSn species. In fact, all sodiated phases have isomer shifts above 2.17 mm s−1, which corresponds to the sodiated tin phase with the highest Na content, i.e., Na15Sn4,34see S.I. for M¨ossbauer
spectra of reference samples. On the other hand, such a low isomer shift value does not correspond to that of the thermodynamically expected β-Sn phase, but rather resembles to that of the grey α-Sn allotrope (vide supra, Sec. 3.1). The formation of an amorphous Sn phase similar to α-Sn during the first discharge plateau is supported by the operando XAS data presented above (cf. Sec. 3.1), which also indicate the formation of an intermediate with structural parameters (bond distance and coordination number) similar to those of
α-Sn that undergoes sodiation mainly during the second discharge plateau. The formation
of thermodynamically unexpected phases is not uncommon in electrochemical processes and has been previously reported for several other conversion and alloy reactions.30,35,36
Towards the end of the discharge the signal-to-noise ratio becomes very small, see Fig. 5, testifying the formation of new tin-containing species with small Lamb-M¨ossbauer factors.
Table 3: 119Sn M¨ossbauer parameters of the components derived from the MCR-ALS analysis of the operando spectra and of the ex situ samples measured at variable temperature Component ∆ [mm s−1] δ*[mm s−1] Γ [mm s−1] Area [%] Θ D**[K] MCR#1 0 2.69(2) 1.14(5) 87(2) -0.5(1) 0.09(8) 0.80(5) 13(2) -MCR#2 0 1.93(3) 0.93(7) 100 -EOD @12 K *** 0.76(1) 2.22(2) 1.22(2) 83(1) 130 0 2.78(1) 1.22(2) 17(1) 150 EOD @300 K 0.80(2) 2.12(4) 1.14(2) 75(3) 130 0 2.68(4) 1.14(2) 25(3) 150 3Na @12 K *** 0 2.79(2) 1.05(2) 44(2) 155 0 1.98(2) 1.04(2) 56(2) 150 3Na @300 K 0 2.68(3) 1.02(4) 45(2) 155 0 1.93(5) 1.02(4) 55(2) 150
* Isomer shift values are given relative to CaSnO
3 at RT
**Errors in the determination of the Debye temperatures are currently of ≈ 10 K.
***Nota bene: In order to compare the values of the low temperature measurement with
those acquired at RT, the second order Doppler shift arising from the difference in temper-ature between source and absorber has to be taken into account, which leads to a difference of the IS values of ≈ 0.1 mm s−1.33
This result is not surprising, since an elastic softening of the alloys upon increasing sodiation is expected for tin as well as for antimony.11,37In order to increase the Lamb-M¨ossbauer factor
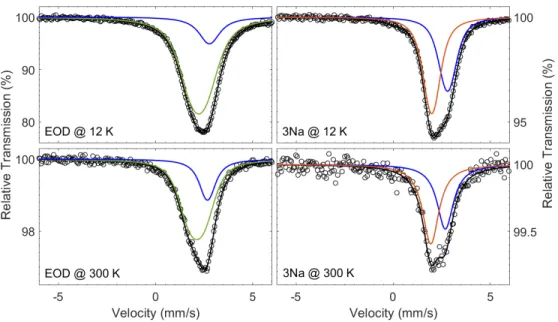
of the obtained phases, an ex situ variable temperature M¨ossbauer spectroscopy study was carried out on two selected electrodes, which were put in test batteries and stopped after the reaction of 3 mol of Na per mol of Sn, and at the end of the first discharge, respectively. The spectra of these two samples measured at room temperature and at 12 K are shown in Fig. 7, while the hyperfine parameters obtained from their fitting are shown in Tab. 3.
The spectrum of the electrode stopped at the end of the first discharge indicates the presence of a dominant spectral contribution centred at ≈ 2.2 mm s−1, corresponding to the formation of a majority of Na15Sn4,34 together with some residual unreacted SnSb. The
low Debye temperature ΘD derived from the temperature dependence of the intensity of the Na15Sn4 spectral component underlines the loss of rigidity upon sodiation and explains why
Figure 7: Ex situ 119Sn M¨ossbauer spectra measured at 12 K (top) and at ambient
tempera-ture (bottom) of two SnSb electrodes recovered at the end of the first discharge (EOD, left) and after the reaction of 3 mol of Na per mol of SnSb (3Na, right), and fit results
The spectrum of the electrode stopped after the reaction of 3 mol Na, i.e. at about 3/4 of the first plateau, contains (at least) two spectral components with quite similar in-tensity: the first one corresponds to the spectrum of pristine SnSb, whereas the second component is characterised by an isomer shift of 1.98(2) mm s−1 at 12 K, corresponding to about 1.9 mm s−1 at ambient temperature. Such a spectrum corresponds well to the presence of both pristine SnSb and the amorphous Sn phase similar to α-Sn detected in the operando spectra. The presence of minor amounts of sodiated tin phases cannot be excluded, since a minor signal of such species could be hidden in between these two major contributions. It is interesting to notice that the relative amounts of the two spectral components vary very little between ambient conditions and 12 K, indicating that the two phases are characterised by similar Debye temperatures ΘD.
3.3
Discussion
With these combined spectral information in mind, it is now possible to follow the evolution of the different phases during the sodiation/desodiation/sodiation processes shown in Fig. 4. The electrochemical reaction mechanism during sodiation (discharge) can be written as a two-step process, as resumed in Eq. 1 and 2, being well in line with the hypothesis of Xiao
et al.,9 but in partial contradiction with other works, which suggested the direct formation
of sodiated tin phases without the formation of tin intermediates.10 These authors, however,
proposed a sodiation mechanism based mainly on ex situ 119Sn M¨ossbauer spectra measured
solely at room temperature and on relaxed samples. Unfortunately, these spectra could not be fitted in an unequivocal way and thus provided only an incomplete sketch of the whole mechanism.
During the first part of the reaction, Sb is sodiated to form almost pure Na3Sb, along
with amorphous metallic tin resembling to α-Sn. It is important to note that, during the first discharge, XAS also indicates the temporary formation of amorphous SnSb. This is in partial analogy to the reaction of SnSb vs. Li reported in the literature in which Li3Sb and
β-Sn are formed.38Contrary to the lithiation, however, the tin and antimony species formed
in the electrochemical reaction vs. Na are mostly amorphous. The subsequent reaction step involves the sodiation of Sn leading to the formation of Na15Sn4. This mechanism is
very distinct from sodiation process of Sn metal and from the lithiation mechanism of SnSb, for which several intermediate steps involving successive crystalline phase transitions have been reported.34,39,40 The fact that the nano-confined, amorphous metallic tin phase shows
high electrochemical reversibility in this system is in accordance with our previous study in which we highlighted these prerequisites.41 It is noteworthy that the sodiation reaction of
SnSb is often incomplete due to a voltage drop caused by overpotentials arising from kinetic limitations or ohmic resistances which reduces the reversible capacity obtained.
Upon desodiation (charge) the processes and potentials are inverted. After one complete cycle an amorphous “SnSb”-like species is dominating, see Eq: 3, which is distinct from
the pristine starting material. This result reminds of the phenomena of nanostructuring of electrode materials observed for alloy and conversion type materials in lithium batteries, such as, for instance, the ternary intermetallic TiSnSb.42
SnSb + 3N a−−−−−−−−−−−→ α Sn + N aHigh voltage plateau 3Sb (1)
4 α Sn + 15N a−−−−−−−−−−−→ N aLow voltage plateau 15Sn4 (2)
4SnSb + 27N a−−−−−−−→ 4N a1stReduction 3Sb + N a15Sn4
Subsequent cycle
←−−−−−−−−→ 4“SnSb” + 27N a (3)
4
Conclusion
The sodiation mechanism of SnSb was thoroughly investigated under operando conditions using Sn and Sb K-edges XAS and 119Sn M¨ossbauer spectroscopy. The collected XAS and M¨ossbauer spectra were analyzed using a chemometric approach including PCA and MCR-ALS. Our findings confirm that SnSb undergoes a two-step alloying reaction upon sodiation in which firstly Sb is sodiated, ensuing the sodiation of Sn. We successfully identified sodi-ated species of Na3Sb and Na15Sn4 as well as an amorphous Sn metal intermediate phase
resembling metallic α-Sn, as confirmed by in situ and ex situ 119Sn M¨ossbauer spectroscopy.
Nevertheless, no intermediate Na-Sb nor Na-Sn species could be identified. The concentra-tion profile of the identified species were monitored throughout the electrochemical reacconcentra-tion, and it was possible to link the prominent features of the electrochemical signature to spe-cific reaction steps. Furthermore, EXAFS fingerprints prove that SnSb formed after one complete cycle is distinct from pristine SnSb. Our findings show that sodiation process of SnSb is distinct from alloying of individual elements Sn and Sb, but also from the lithiation process of SnSb. The chemometric approach pursued in this study clearly illustrates that
the formation of sodiated phases occurs in a gradual and decoupled way by firstly sodiating Sb and subsequently Sn. This induces a stepwise and steady increase in volume change which is less harmful to the electrode integrity than an abrupt formation of highly sodiated compounds, as observed in the case of lithiation. Moreover the strong amorphization upon sodiation, which is much more pronounced than for lithiation of SnSb, together with the elastic softening of tin and antimony alloys through sodiation provide a cushion for the vol-ume expansion. Therefore we have strong evidence to believe that the combination of these unique cycling characteristics are the key to the enhanced capacity retention and cycle life.
Acknowledgments
S. Belin and V. Briois are gratefully acknowledged for their expert advice on beamline opera-tion, Synchrotron Soleil (France) for providing beamtime at the beamline SAMBA. Alistore-European Research Institute is gratefully acknowledged for financial support through the postdoc grant to M. F. The research group Catalyse, R´eactivit´e de Surface et Rayonnement Synchrotron (GDR CNRS 3590) is gratefully acknowledged for its information and
support-ing activity for the application of the chemometric approach in the analysis of spectroscopic data.
Supporting Information Available
FT and k-space EXAFS data obtained via PCA MCR-ALS on operando SnSb are presented along with the fit in R-space of the components. Furthermore M¨ossbauer spectra of sodiated tin reference samples and the variance plot and pure spectra components of PCA MCR-ALS on operando M¨ossbauer spectra are shown. This material is available free of charge via the Internet at http://pubs.acs.org/.
References
(1) Yang, J. Small particle size multiphase Li-alloy anodes for lithium-ionbatteries. Solid
State Ionics 1996, 90, 281–287.
(2) Ji, L.; Gu, M.; Shao, Y.; Li, X.; Engelhard, M. H.; Arey, B. W.; Wang, W.; Nie, Z.; Xiao, J.; Wang, C.; Zhang, J. G.; Liu, J. Controlling SEI formation on SnSb-porous carbon nanofibers for improved Na ion storage. Adv. Mater. 2014, 26, 2901–2908. (3) He, M.; Walter, M.; Kravchyk, K. V.; Erni, R.; Widmer, R.; Kovalenko, M. V.
Monodis-perse SnSb nanocrystals for Li-ion and Na-ion battery anodes: synergy and dissonance between Sn and Sb. Nanoscale 2015, 7, 455–459.
(4) Ji, L.; Zhou, W.; Chabot, V.; Yu, A.; Xiao, X. Reduced Graphene Oxide/Tin-Antimony Nanocomposites as Anode Materials for Advanced Sodium-Ion Batteries. ACS Appl.
Mater. Interfaces 2015, 7, 24895–24901.
(5) Walter, M.; Doswald, S.; Kovalenko, M. V. Inexpensive colloidal SnSb nanoalloys as efficient anode materials for lithium- and sodium-ion batteries. J. Mater. Chem. A
2016, 4, 7053–7059.
(6) Yi, Z.; Han, Q.; Geng, D.; Wu, Y.; Cheng, Y.; Wang, L. One-pot chemical route for morphology-controllable fabrication of Sn-Sb micro/nano-structures: Advanced anode materials for lithium and sodium storage. J. Power Sources 2017, 342, 861–871. (7) Darwiche, A.; Sougrati, M. T.; Fraisse, B.; Stievano, L.; Monconduit, L. Facile
syn-thesis and long cycle life of SnSb as negative electrode material for Na-ion batteries.
Electrochem. commun. 2013, 32, 18–21.
(8) Qin, J.; Wang, T.; Liu, D.; Liu, E.; Zhao, N.; Shi, C.; He, F.; Ma, L.; He, C. A Top-Down Strategy toward SnSb In-Plane Nanoconfined 3D N-Doped Porous Graphene
Composite Microspheres for High Performance Na-Ion Battery Anode. 2018; http: //doi.wiley.com/10.1002/adma.201704670.
(9) Xiao, L.; Cao, Y.; Xiao, J.; Wang, W.; Kovarik, L.; Nie, Z.; Liu, J. High capacity, reversible alloying reactions in SnSb/C nanocomposites for Na-ion battery applications.
Chem. Commun. 2012, 48, 3321.
(10) Baggetto, L.; Hah, H. Y.; Jumas, J. C.; Johnson, C. E.; Johnson, J. A.; Keum, J. K.; Bridges, C. A.; Veith, G. M. The reaction mechanism of SnSb and Sb thin film an-odes for Na-ion batteries studied by X-ray diffraction, 119Sn and 121Sb M¨ossbauer spectroscopies. J. Power Sources 2014, 267, 329–336.
(11) Allan, P. K.; Griffin, J. M.; Darwiche, A.; Borkiewicz, O. J.; Wiaderek, K. M.; Chap-man, K. W.; Morris, A. J.; Chupas, P. J.; Monconduit, L.; Grey, C. P. Tracking Sodium-Antimonide Phase Transformations in Sodium-Ion Anodes: Insights from Operando Pair Distribution Function Analysis and Solid-State NMR Spectroscopy. J. Am. Chem.
Soc. 2016, 138, 2352–2365.
(12) Conti, P.; Zamponi, S.; Giorgetti, M.; Berrettoni, M.; Smyrl, W. H. Multivariate Curve Resolution Analysis for Interpretation of Dynamic Cu K-Edge X-ray Absorption Spec-troscopy Spectra for a Cu Doped V <sub>2</sub> O <sub>5</sub> Lithium Bat-tery. Anal. Chem. 2010, 82, 3629–3635.
(13) Cassinelli, W. H.; Martins, L.; Passos, A. R.; Pulcinelli, S. H.; Santilli, C. V.; Rochet, A.; Briois, V. Multivariate curve resolution analysis applied to time-resolved synchrotron X-ray Absorption Spectroscopy monitoring of the activation of copper alumina catalyst. Catal. Today. 2014; pp 114–122.
(14) Giorgetti, M.; Mignani, A.; Aquilanti, G.; Conti, P.; Fehse, M.; Stievano, L. Structural and electronic studies of metal hexacyanoferrates based cathodes for Li rechargeable batteries. J. Phys. Conf. Ser. 2016, 712, 012127.
(15) Iadecola, A.; Perea, A.; Aldon, L.; Aquilanti, G.; Stievano, L. Li deinsertion mecha-nism and Jahn-Teller distortion in LiFe0.75Mn0.25PO4: an operando X-ray absorption spectroscopy investigation. J. Phys. D Appl. Phys. 2017, 50, 144004.
(16) Broux, T.; Bamine, T.; Simonelli, L.; Stievano, L.; Fauth, F.; M´en´etrier, M.; Carlier, D.; Masquelier, C.; Croguennec, L. VIV Disproportionation Upon Sodium Extraction from Na3V2(PO4)2F3 Observed by Operando X-ray Absorption Spectroscopy and Solid-State NMR. J. Phys. Chem. C 2017, 121, 4103–4111.
(17) Loaiza, L. C.; Salager, E.; Louvain, N.; Boulaoued, A.; Iadecola, A.; Johansson, P.; Stievano, L.; Seznec, V.; Monconduit, L. Understanding the lithiation/delithiation mechanism of Si(1-x)Gex alloys. J. Mater. Chem. A 2017, 5, 12462–12473.
(18) Coquil, G.; Fullenwarth, J.; Grinbom, G.; Sougrati, M. T.; Stievano, L.; Zitoun, D.; Monconduit, L. FeSi4P4: A novel negative electrode with atypical electrochemical mechanism for Li and Na-ion batteries. J. Power Sources 2017, 372, 196–203.
(19) Leriche, J. B.; Hamelet, S.; Shu, J.; Morcrette, M.; Masquelier, C.; Ouvrard, G.; Zer-rouki, M.; Soudan, P.; Belin, S.; Elka¨ım, E.; Baudelet, F. An electrochemical cell for operando study of lithium batteries using synchrotron radiation. J. Electrochem. Soc.
2010, 157, A606–A610.
(20) Ravel, B.; Newville, M. ATHENA, ARTEMIS, HEPHAESTUS: Data analysis for X-ray absorption spectroscopy using IFEFFIT. J. Synchrotron Radiat. 2005; pp 537–541. (21) Jumas, J.-C.; Stievano, L.; Sougrati, M.-T.; Fullenwarth, J.; Fraisse, B.; Leriche, J.-B.
Analyse des caracteristiques d’un mat´eriau d’´electrode d’une cellule ´electrochimique. 2013.
(22) McCalla, E.; Sougrati, M. T.; Rousse, G.; Berg, E. J.; Abakumov, A.; Recham, N.; Ramesha, K.; Sathiya, M.; Dominko, R.; Van Tendeloo, G.; Nov´ak, P.; Tarascon, J. M.
Understanding the Roles of Anionic Redox and Oxygen Release during Electrochemical Cycling of Lithium-Rich Layered Li<inf>4</inf>FeSbO<inf>6</inf>. J. Am. Chem.
Soc. 2015, 137, 4804–4814.
(23) Conte, D. E.; Aboulaich, A.; Robert, F.; Olivier-Fourcade, J.; Jumas, J. C.; Jordy, C.; Willmann, P. Snx[BPO4]1-x composites as negative electrodes for lithium ion cells: Comparison with amorphous SnB0.6P0.4O2.9 and effect of composition. J. Solid State
Chem. 2010, 183, 65–75.
(24) Massart, D.; Vandeginste, B.; Buydens, L.; De Jong, S.; Lewi, P.; Smeyers-Verbecke, J.
Handbook of Chemometrics and Qualimetrics: Part A, 1st ed.; Elsevier: Amsterdam,
1997.
(25) Jaumot, J.; Gargallo, R.; De Juan, A.; Tauler, R. A graphical user-friendly interface for MCR-ALS: A new tool for multivariate curve resolution in MATLAB. Chemom. Intell.
Lab. Syst. 2005, 76, 101–110.
(26) Jaumot, J.; de Juan, A.; Tauler, R. MCR-ALS GUI 2.0: New features and applications.
Chemom. Intell. Lab. Syst. 2015, 140, 1–12.
(27) Cabana, J.; Monconduit, L.; Larcher, D.; Palac´ın, M. R. Beyond intercalation-based Li-ion batteries: the state of the art and challenges of electrode materials reacting through conversion reactions. Adv. Mater. 2010, 22, E170–92.
(28) Silver, J.; Mackay, C. A.; Donaldson, J. D. A systematic investigation of the M¨ossbauer parameters of some intermetallic compounds and electroplated alloys of tin. J. Mater.
Sci. 1976, 11, 836–842.
(29) Stevens, J. G. Isomer shift reference scales. Hyperfine Interact. 1983, 13, 221–236. (30) Darwiche, A.; Marino, C.; Sougrati, M. T.; Fraisse, B.; Stievano, L.; Monconduit, L.
Better cycling performances of bulk Sb in Na-ion batteries compared to Li-ion systems: an unexpected electrochemical mechanism. J. Am. Chem. Soc. 2012, 134, 20805–11. (31) Krebs, H.; Steffen, R. Neubestimmung der Nahordnung im glasigen Selen, im explosiven
Antimon und im beta- und gamma-Arsen. Z. Anorg. Allg. Chem. 1964, 327, 224–237. (32) Baggetto, L.; Ganesh, P.; Sun, C.-N.; Meisner, R. A.; Zawodzinski, T. A.; Veith, G. M. Intrinsic thermodynamic and kinetic properties of Sb electrodes for Li-ion and Na-ion batteries: experiment and theory. J. Mater. Chem. A 2013, 1, 7985.
(33) Stievano, L.; Wagner, F. E. Charact. Solid Mater. Heterog. Catal.; Wiley-VCH Verlag GmbH & Co. KGaA: Weinheim, Germany, 2012; Chapter 10, pp 407–452.
(34) Du, Z.; Dunlap, R. A.; Obrovac, M. N. Investigation of the reversible sodiation of Sn foil by ex-situ X-ray diffractometry and M¨ossbauer effect spectroscopy. J. Alloys Compd.
2014, 617, 271–276.
(35) Villevieille, C.; Ionica-Bousquet, C.-M. M.; Ducourant, B.; Jumas, J.-C.; Moncon-duit, L. NiSb2 as negative electrode for Li-ion batteries: An original conversion reaction.
J. Power Sources 2007, 172, 388–394.
(36) Sougrati, M. T.; Fullenwarth, J.; Debenedetti, A.; Fraisse, B.; Jumas, J. C.; Mon-conduit, L. TiSnSb a new efficient negative electrode for Li-ion batteries: mechanism investigations by operando-XRD and M¨ossbauer techniques. J. Mater. Chem. 2011,
21, 10069–10076.
(37) Mortazavi, M.; Deng, J.; Shenoy, V. B.; Medhekar, N. V. Elastic softening of alloy negative electrodes for Na-ion batteries. J. Power Sources 2013, 225, 207–214.
(38) Zhou, G. T.; Palchik, O.; Nowik, I.; Herber, R.; Koltypin, Y.; Gedanken, A. Microwave-assisted selective preparation and characterization of Li 21Si5 and Li17Sn4. J. Solid
(39) Stratford, J. M.; Mayo, M.; Allan, P. K.; Pecher, O.; Borkiewicz, O. J.; Wiaderek, K. M.; Chapman, K. W.; Pickard, C. J.; Morris, A. J.; Grey, C. P. Investigating Sodium Storage Mechanisms in Tin Anodes: A Combined Pair Distribution Function Analysis, Density Functional Theory, and Solid-State NMR Approach. J. Am. Chem. Soc. 2017,
139, 7273–7286.
(40) Antitomaso, P.; Fraisse, B.; Stievano, L.; Biscaglia, S.; Ayme-perrot, D.; Girard, P.; Sougrati, M. T.; Monconduit, L. SnSb electrode for Li-ion batteries: electrochemical mechanism and capacity fading origins elucidated by Operando techniques. J. Mater.
Chem. A 2017, 5, 6546–6555.
(41) Jahel, A.; Ghimbeu, C. M.; Darwiche, A.; Vidal, L.; Hajjar-Garreau, S.; Vix-Guterl, C.; Monconduit, L. Exceptionally highly performing Na-ion battery anode using crystalline SnO 2 nanoparticles confined in mesoporous carbon. J. Mater. Chem. A 2015, 3, 11960– 11969.
(42) Fehse, M.; Darwiche, A.; Sougrati, M. T.; Kelder, E. M.; Chadwick, A. V.; Alfreds-son, M.; Monconduit, L.; Stievano, L. In-Depth Analysis of the Conversion Mechanism of TiSnSb vs Li by Operando Triple-Edge X-ray Absorption Spectroscopy: A Chemo-metric Approach. Chem. Mater. 2017, 29, 10446–10454.


![Table 1: EXAFS fitting parameters of MCR-ALS components of Sn K-edge Component Shell N R theo [˚ A] R f it [˚ A] σ 2 [˚ A] 2 S 2 0](https://thumb-eu.123doks.com/thumbv2/123doknet/11546660.296227/13.918.152.766.720.945/table-exafs-fitting-parameters-mcr-components-component-shell.webp)


![Table 3: 119 Sn M¨ ossbauer parameters of the components derived from the MCR- MCR-ALS analysis of the operando spectra and of the ex situ samples measured at variable temperature Component ∆ [mm s −1 ] δ * [mm s −1 ] Γ [mm s −1 ] Area [%] Θ D ** [K] MCR#1](https://thumb-eu.123doks.com/thumbv2/123doknet/11546660.296227/18.918.149.771.184.464/ossbauer-parameters-components-analysis-operando-measured-temperature-component.webp)