HAL Id: hal-01193825
https://hal.archives-ouvertes.fr/hal-01193825
Submitted on 27 May 2020
HAL is a multi-disciplinary open access
archive for the deposit and dissemination of
sci-entific research documents, whether they are
pub-lished or not. The documents may come from
teaching and research institutions in France or
abroad, or from public or private research centers.
L’archive ouverte pluridisciplinaire HAL, est
destinée au dépôt et à la diffusion de documents
scientifiques de niveau recherche, publiés ou non,
émanant des établissements d’enseignement et de
recherche français ou étrangers, des laboratoires
publics ou privés.
first fall onset in elderly people: a two-year prospective
observational study
Jean-Baptiste Mignardot, Thibault Deschamps, Eric Barrey, Bernard Auvinet,
Gilles Berrut, Christophe Cornu, Thierry Constans, Laure Decker De
To cite this version:
Jean-Baptiste Mignardot, Thibault Deschamps, Eric Barrey, Bernard Auvinet, Gilles Berrut, et
al..
Gait disturbances as specific predictive markers of the first fall onset in elderly people: a
two-year prospective observational study.
Frontiers in Aging Neuroscience, Frontiers, 2014, 6,
Gait disturbances as specific predictive markers of the first
fall onset in elderly people: a two-year prospective
observational study
Jean-Baptiste Mignardot1,2, Thibault Deschamps1*, Eric Barrey3,4, Bernard Auvinet5, Gilles Berrut1,6,
Christophe Cornu1, Thierry Constans7and Laure de Decker6
1
Laboratory “Motricité, Interactions, Performance” (UPRES EA 4334), University of Nantes, Nantes, France
2
Up-COURTINE Lab, Centre for Neuroprosthetics and Brain Mind Institute, Ecole Polytechnique Fédérale de Lausanne, Lausanne, Switzerland
3Unité de Biologie Intégrative des Adaptations à l’Exercice (Inserm U902) Genople, Université d’Evry Val d’Essonne, Évry, France 4GABI, UMR-1313, INRA, Jouy-en-Josas, France
5Service de Rhumatologie, Centre Hospitalier de Laval, Laval, France 6
Gérontopôle des Pays de la Loire, CHU de Nantes, Nantes, France
7
Geriatrics Department, Centre Hospitalier Universitaire de Tours, Tours, France
Edited by:
Hari S. Sharma, Uppsala University, Sweden
Reviewed by:
Marcia Chaves, Federal University of Rio Grande do Sul, Brazil
Shin Murakami, Touro University-California, USA
*Correspondence:
Thibault Deschamps, Laboratory “Motricité, Interactions, Performance” (E.A. 4334), University of Nantes, 25 Bis Boulevard Guy Mollet, BP 72206, 44322 Nantes Cedex 3, France e-mail: thibault.deschamps@ univ-nantes.fr
Falls are common in the elderly, and potentially result in injury and disability. Thus, preventing falls as soon as possible in older adults is a public health priority, yet there is no specific marker that is predictive of the first fall onset. We hypothesized that gait features should be the most relevant variables for predicting the first fall. Clinical baseline characteristics (e.g., gender, cognitive function) were assessed in 259 home-dwelling people aged 66 to 75 that had never fallen. Likewise, global kinetic behavior of gait was recorded from 22 variables in 1036 walking tests with an accelerometric gait analysis system. Afterward, monthly telephone monitoring reported the date of the first fall over 24 months. A principal components analysis was used to assess the relationship between gait variables and fall status in four groups: non-fallers, fallers from 0 to 6 months, fallers from 6 to 12 months and fallers from 12 to 24 months. The association of significant principal components (PC) with an increased risk of first fall was then evaluated using the area under the Receiver Operator Characteristic Curve (ROC). No effect of clinical confounding variables was shown as a function of groups. An eigenvalue decomposition of the correlation matrix identified a large statistical PC1 (termed “Global kinetics of gait pattern”), which accounted for 36.7% of total variance. Principal component loadings also revealed a PC2 (12.6% of total variance), related to the “Global gait regularity.” Subsequent ANOVAs showed that only PC1 discriminated the fall status during the first 6 months, while PC2 discriminated the first fall onset between 6 and 12 months. After one year, any PC was associated with falls. These results were bolstered by the ROC analyses, showing good predictive models of the first fall during the first six months or from 6 to 12 months. Overall, these findings suggest that the performance of a standardized walking test at least once a year is essential for fall prevention.
Keywords: risk of fall, gait analysis, gait variability, gait speed, accelerometric device, fall-related injuries, home-dwelling people, principal components analysis
INTRODUCTION
In view of the high prevalence of individuals in elderly popula-tions with a risk of falling and the potentially dramatic conse-quences of fall-related injuries (e.g., fractures and psychological trauma) leading to self-imposed restriction in daily activities and, consequently, loss of independence (Arfken et al., 1994; Tinetti et al., 1994a; Tinetti and Williams, 1997; Scheffer et al., 2008), avoidance or delay of the first fall onset is a major public health concern. As reported by theWHO (2007), falls are the second leading cause of accidental or unintentional-injury deaths world-wide with more than 420,000 individuals dying from falls globally, of which over 80% are in low- and middle-income countries. In addition, 37.3 million falls each year require medical atten-tion, with about 40% of all serious fall-related injuries among
the elderly resulting in hospital admission. After hospitalization, 30–40% of these patients are transferred to a nursing home. Altogether, 30% of people over the age of 65 years that live in the community fall at least once per year and this proportion increases greatly with age. To tackle the major public health chal-lenges of preventing falls in older adults as soon as possible, we argue that it is crucial to identify specific markers that are sig-nificantly associated with an increased risk of the first fall onset. Identifying these markers would help the medical professional to prescribe an intervention early enough to effectively prevent a fall. Up to now, considerable literature on the identification of risk factors for falls in the elderly and on the prediction of recurrent falls has been published (Tinetti et al., 1988; Nevitt et al., 1989; Wickham et al., 1989; O’Loughlin et al., 1993;
Mahoney et al., 1994; Luukinen et al., 1995; Thapa et al., 1995; Tinetti and Williams, 1997; Lord et al., 2000; Rubenstein and Josephson, 2002; Stel et al., 2003). According to significant meta-analyses (Gillespie et al., 2012; Bloch et al., 2013), among the most important intrinsic predictors of falls are taking medica-tions [Odds Ratio = 4.24 (3.06–5.88) 95% Confidence inter-val), abnormal balance test [OR= 2.26 (1.79–2.85)], low body mass index [OR= 2.05 (1.70–2.48)], fracture history [OR = 1.89 (1.53–2.34)], vision impairment [OR = 1.49 (1.39–1.59)], cardiac rhythm disorder [OR= 1.42 (1.14–1.75)], impaired cog-nition [OR= 1.96 (1.80–2.14)], or limited activity [OR = 1.32 (1.01–1.72)].
More specifically, it is well documented that a large propor-tion of falls in the elderly occur during walking (Wild et al., 1981; Campbell et al., 1989; Robinovitch et al., 2013). Thus, gait disturbances (e.g., decreased speed, changes in stride time vari-ability, or medio-lateral symmetry) have been associated with falls (Rubenstein et al., 1988; Tinetti et al., 1988; Maki, 1997; Hausdorff et al., 2001; Auvinet et al., 2003; Vassallo et al., 2003; Brach et al., 2005; Verghese et al., 2009; Toebes et al., 2012; Weiss et al., 2013). For example,Mirelman et al. (2012)conducted a five-year prospective study that showed that gait disturbances, and especially dual-task gait variability, were associated with future falls, while controlling for age, gender and history of falls the year prior to the participants’ initial screening. However, as far as we know, no prospective cohort study has replicated or con-firmed these findings in home-dwelling people aged 65–75 that had never fallen. Thus our approach owes its originality both to this particular cohort (i.e., primary prevention policy) and to the compression of dimension of collected gait variables as essential information to be related to risk of the first fall in older popula-tion; In this particular context (i.e., the “unknown” cohort), we hypothesized that the average walking speed and stride regularity should be the most relevant variables to discriminate non-fallers from fallers. With an economic, easy to use, and non-invasive accelerometric device, this 2-year prospective study aimed to examine the correlations between specific gait patterns and falls. In addition, we also sought to characterize the duration between the fall-risk screening test and a potential fall using an original multi-step statistical analysis.
MATERIALS AND METHODS
PARTICIPANTS
A total of 259 older adults (mean age 69.6 ± 2.7 years; 61.5% women) who never had fall experience, were recruited for the present cohort, which is a prospective observational multicen-ter study designed to identify the risk factors for the first fall in elderly community-dwellers. This study was approved by the Local Ethical Committee of the Region of Pays de la Loire (France) (reference: n◦ 2004/05, “Facteurs prédictifs du risque de première chute chez les personnes âgées (predictive factors of risk of the first fall in elderly people); CCPPRP n◦1, favorable opinion the 20th July 2004) and was conducted in accordance with the Declaration of Helsinki (last modified in 2004).
Each participant was screened by medical staff for their med-ical history, personal information (age, gender), physmed-ical and clinical baseline characteristics according to the aforementioned
predictors of falls: taking medications, abnormal balance test (one leg standing test), body mass index, fracture history (lower limb surgery during the five past years), vision impairment (global visual acuity score), cardiac rhythm disorder (normal-ity of electrocardiogram), impaired cognition (Mini-Mental State Examination “MMSE” and Frontal Assessment Battery “FAB” tests) and limited activity (Daily physical activity).
Eligibility criteria were age between 66 and 75 years, living at home, never fallen, and an ability to walk without assistance (for at least 30 s). Previous falls (or not) were evaluated dur-ing the first meetdur-ing with the patient, by askdur-ing them if they have already fallen. To clarify the definition of fall, the geriatric medicine doctors explained the WHO definition, with case exam-ples. The question of fall event was discussed again with the participant during the presentation of the study and during the first baseline visit (inclusion visit). For the present analysis, exclu-sion criteria were refusal to give consent or lack capacity to give consent or if the participant was hospitalized at the time of screen-ing. Participants were included after having given their written informed consent for research.
Basic gait mobility was assessed using an accelerometric device (see the Gait assessment section below) in order to characterize the overall locomotor behavior of each participant. After this base-line assessment, all the participants received standardized phone calls from the research medical staff each month during the first year, and every three months during the second year in order to obtain information regarding any falls or related incidents. The telephone calls were performed by trained interviewers, and were similar to the procedure used in the literature (e.g.,Stalenhoef et al., 2002). By using open-ended questions, the date, circum-stances, causes and consequences of falls, and changes in living conditions and life events were collected. If necessary, the inter-viewers reminded the WHO definition to the participants, with case examples. A fall was defined as “unintentionally on the ground or lower level, not as a result of a major intrinsic event (such as a stroke) or overwhelming hazard” (Tinetti et al., 1988; WHO, 2007).
CATEGORIZATION OF FALLERS GROUPS ACCORDING TO THE DATE OF THE FIRST FALL ONSET
At the end of the follow-up period, a committee of geriatric medicine doctors analyzed the circumstances of each fall recorded during the prospective follow-up in order to verify and, if appro-priate, validate that the fall occurred during usual living con-ditions and was factually consistent with the definition-related criteria of a fall (WHO, 2007). For example, a fall occurring while practicing a high-risk sport or because of ice on the sidewalk was not considered as a falling event. About 5% of collected falls were rejected by this committee of experts. Three participants were then excluded from this study before the analysis. During the 24-month follow-up period, 72 subjects (27.40%) reported falling one or more times. Among the reported first falls, 20 participants (7.72%) fell during the first six months, 26 (10.04%) between the sixth and twelfth months and 26 (10.04%) during the second year. 69 of the 72 subjects that fell reported falling only once and 3 fell multiple times during the follow-up period. Note also that the committee kept blind for the gait assessment results as the
geriatric M.D. met. In addition, none of them has been involved in the statistical process.
GENERAL BASELINE CHARACTERISTICS
According to the main factors identified involved in the risk of falling in older people (Gillespie et al., 2012; Bloch et al., 2013), the relationship between falls and these potential confounding factors was examined by means of multinomial logistic regression analysis. By performing this statistical analysis for each variable separately, we specified the association between (the risk of) the first fall and these clinical factors, with the non-fallers group used as the reference level. The baseline clinical characteristics were gender, taking medications, daily physical activity (above 30 min per day), one leg standing test (above 5 s), lower limb surgery dur-ing the five previous years, and abnormal electrocardiogram as binary variables, and age, body mass index, global visual acuity score, and MMSE and FAB tests as parametric variables.
ACCELEROMETRIC GAIT ANALYSIS DEVICE
The gait analysis system used in this study included a 3-D-acceleration sensor, a data logger and a computer program for processing the acceleration signals and calculating the gait param-eters (Locometrix®, Figure 1). The sensor weighs 20 g and is composed of three accelerometers placed perpendicularly to each other and housed in a moulded box (40× 18× 18 mm). The sensor is incorporated into an elastic belt, which was fastened around the subject’s waist, so that the sensor was placed over the L3–L4 inter-vertebral space (Figure 1). The first accelerome-ter was aligned with the cranio-caudal axis of the body, the second one with the antero-posterior axis and the third one with the medio-lateral axis. Signals were recorded by a data logger at a sampling frequency of 100 Hz and an anti-aliasing filter with a cut-off frequency of 50 Hz was applied. This data logger weighed 140 g and was housed in a box (65× 22× 12 mm) (seeAuvinet et al., 1999, 2002, for further details).
GAIT ASSESSMENT
Four tests were carried out on each subject walking at his/her own comfortable speed down and back along a 30 m straight hospital corridor. No prompting signals were used. The 30 m distance was long enough to ensure a constant speed over 25 s in order to select a steady state walking pattern of 20 s for analysis. All subjects wore their usual walking shoes avoiding high heels or hard-soled shoes. The walking speed was measured with an electronic stopwatch synchronized with the gait data logger. Although subjects were asked to walk in a straight line with their arms free, the trajec-tory was not imposed and the corridor width was limited so the conditions of walking allowed a large degree of freedom for walk disorder expression with the environmental conditions carefully standardized. Overall, considering the 259 subjects, 1036 tests of 30 m distance have been recorded or approximately 30 kilometers and 60000 strides.
GAIT VARIABLES
The software program Locometrix® automatically calculated kinematic and kinetic gait variables after selecting a steady state walk sample of 20.48 s. This sample included exactly 1024 points of acceleration measurements on each axis, which provided an
optimal calculation for Fast Fourier Transformation (FFT) and other algorithms. This period corresponded to 19–21 walk cycles-about 28 m for healthy adult subjects. All the biomechanical variables were calculated from the walk sample 3D-accelerations signals for each person. These variables were derived from calcu-lating of several algorithms as indicated in Table 1: time measure, vectorial calculations, FFT, autocorrelation, wavelet analysis and statistical regressions. Further explanations on the calculation of the variables can be obtained in previous validation papers of the accelerometric gait analysis device (Auvinet et al., 1999, 2002). This gait analysis system has been extensively used for clinical trials both in humans and animals (Paquet et al., 2003; Auvinet et al., 2011; Barthélémy et al., 2011). The 22 collected variables are presented in detail in Table 1.
DATA AND STATISTICAL ANALYSIS OF GAIT
We tried to characterize the overall gait behavior for the different (non) fallers groups by performing a statistical analysis consisting of a seven-step procedure. Specifically, we replicated the statistical process mainly based on a principal components analysis (PCA) as described in recent studies (Courtine et al., 2009; Musienko et al., 2011; van den Brand et al., 2012).
Step 1
A total of 22 gait variables providing detailed quantification of the overall locomotor behavior from the 3-axis accelerometric device that were collected (Figure 1).
Step 2
A PCA was applied on all computed variables. This PCA allowed the extraction of the most relevant information from the initial data by generating new independent variables called Principal Components (PC). Each PC linearly combines the original vari-ables to maximize the amount of explained variance for each successive PC (Figure 1).
Step 3
We then computed correlations (PC loadings) between each mea-sured parameter and each selected PC. In order to understand what each PC reflected, we focused on the variables that showed the highest PC loading (r> 0.5, p < 0.05). PC1 accounted for the largest part of the variance (36.7%), PC2 for 12.6% of the total variance and PC3 for 7.9% of the total variance) (Figure 1). Note that these three PCs are sufficient to summarize the entire col-lected data because there is a very strong correlation (r= 0.92, p< 0.001) between the eigenvector constructed with these first three PCs and the eigenvector constructed from all the PCs (i.e., 100% of the variance).
Step 4
The overall locomotor behavior of each group was then displayed in a 3-D space defined by the newly constructed variables, PC1–3 (57.2% of explained variance) (Figure 2). Note that clear differ-ences emerged visually across the groups. The displayed ellipsoid volumes for each group were located from the mean value of the three PC eigenvectors for each group, and their diameters corresponded to the 95% confidence interval (95% CI).
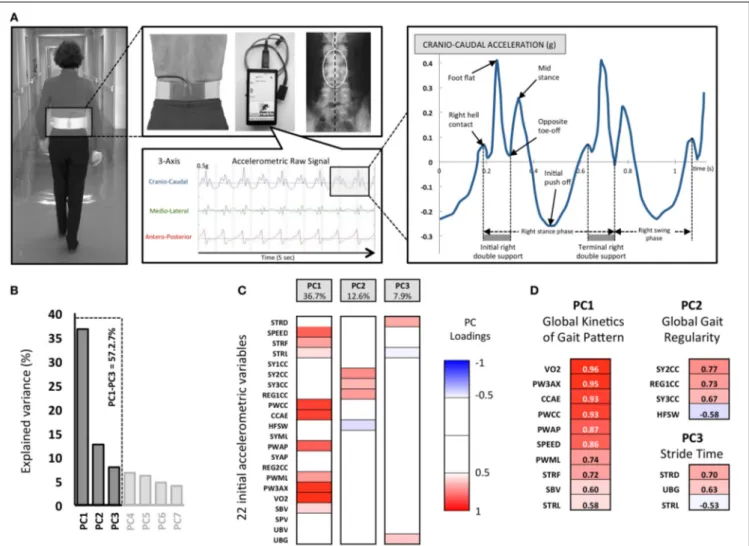
FIGURE 1 | The experimental Locometrix® gait analysis system for the walking test and first methodological steps of the Principal
Components Analysis (PCA). (A) The accelerometric sensor is applied in the middle of the lower back using an elastic beltfastened around the subject’s waist. The sensors are connected to a data logger, which is attached onto the front part of the belt. The participants were requested to walk at their own comfortable speed along a 30 m straight corridor. The sensor provides the cranio-caudal, medio-lateral and antero-posterior raw acceleration signals. Then the software allowed to select walk sample of 20 s to calculated 22 variables related to kinetics, regularity, power and
expended energy of locomotor behavior. (B) 22792 pieces of data corresponding to 22 variables, extracted from 1036 walking trials, were used for the PCA. The three retained principal components (PC) are shown with their associated eigenvalues, for 57.2% of the total variance. (C) Each initial variable, as correlated with a PC with|r| > 0.5 (p < 0.05), was considered “significant” and used for interpretation. The color code corresponds to these component loadings. (D) The resulting analysis identified three groups of variables that can be related to (i) the Global kinetics of gait pattern (PC1), (ii) Global gait regularity (PC2) and (iii) the Stride time (PC3).
Step 5
The expected differences between groups were represented by histograms (Figure 2), which correspond to the mean posi-tion±95% CI, according to the three PC eigenvectors. One-Way analysis of variance (ANOVA) was used to examine the between-groups effects with each eigenvector as dependent variable. This fifth step allowed for the identification of the delay-related predictive marker of the first fall onset.
Step 6
In order to specify the relationships between the occurrence of the first fall event during the follow-up and extracted PCs (step 5), we assessed the Area Under the Curve (AUC) of the Receiving Operating Characteristics (ROC), plotted from the sensitivity and
sensibility of the PCs eigenvectors, for the three fallers groups in comparison to the non-fallers group: fallers (+0 to +6 months) vs. non-fallers, fallers (+6 to +12 months) vs. non-fallers, fallers (+12 to +24 months) vs. non-fallers (Figure 3).
Step 7
Lastly, Odds ratios (OR) were quantified by performing multi-ple univariate logistic regressions after a dichotomization process, necessary to transform the continuous eigenvectors, by the com-putation of the Youden Index (Youden, 1950; Shapiro, 1999; Greiner et al., 2000). The latter consisted of the determination of the cut-off value (J), from a maximization process of (Sensibility + Specificity) − 1; {J = maxc [Se(c) + Sp(c) −1]}. On this basis, survival curves analyses using Kaplan-Meier testing were
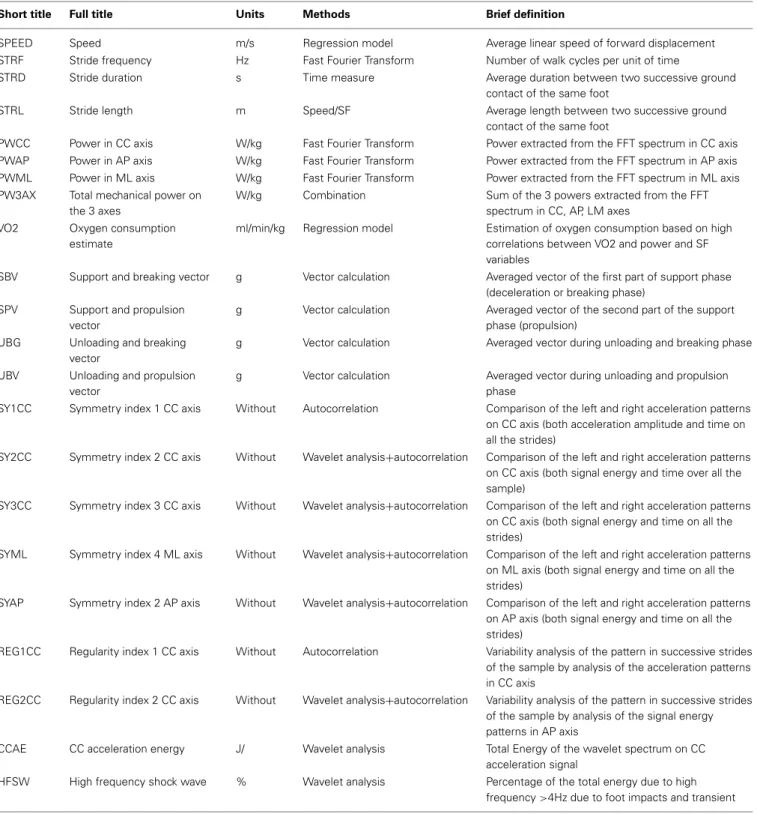
Table 1 | Details of 22 gait variables collected from the accelerometric gait analysis device.
Short title Full title Units Methods Brief definition
SPEED Speed m/s Regression model Average linear speed of forward displacement
STRF Stride frequency Hz Fast Fourier Transform Number of walk cycles per unit of time
STRD Stride duration s Time measure Average duration between two successive ground
contact of the same foot
STRL Stride length m Speed/SF Average length between two successive ground
contact of the same foot
PWCC Power in CC axis W/kg Fast Fourier Transform Power extracted from the FFT spectrum in CC axis PWAP Power in AP axis W/kg Fast Fourier Transform Power extracted from the FFT spectrum in AP axis PWML Power in ML axis W/kg Fast Fourier Transform Power extracted from the FFT spectrum in ML axis PW3AX Total mechanical power on
the 3 axes
W/kg Combination Sum of the 3 powers extracted from the FFT spectrum in CC, AP, LM axes
VO2 Oxygen consumption estimate
ml/min/kg Regression model Estimation of oxygen consumption based on high correlations between VO2 and power and SF variables
SBV Support and breaking vector g Vector calculation Averaged vector of the first part of support phase (deceleration or breaking phase)
SPV Support and propulsion vector
g Vector calculation Averaged vector of the second part of the support phase (propulsion)
UBG Unloading and breaking vector
g Vector calculation Averaged vector during unloading and breaking phase
UBV Unloading and propulsion vector
g Vector calculation Averaged vector during unloading and propulsion phase
SY1CC Symmetry index 1 CC axis Without Autocorrelation Comparison of the left and right acceleration patterns on CC axis (both acceleration amplitude and time on all the strides)
SY2CC Symmetry index 2 CC axis Without Wavelet analysis+autocorrelation Comparison of the left and right acceleration patterns on CC axis (both signal energy and time over all the sample)
SY3CC Symmetry index 3 CC axis Without Wavelet analysis+autocorrelation Comparison of the left and right acceleration patterns on CC axis (both signal energy and time on all the strides)
SYML Symmetry index 4 ML axis Without Wavelet analysis+autocorrelation Comparison of the left and right acceleration patterns on ML axis (both signal energy and time on all the strides)
SYAP Symmetry index 2 AP axis Without Wavelet analysis+autocorrelation Comparison of the left and right acceleration patterns on AP axis (both signal energy and time on all the strides)
REG1CC Regularity index 1 CC axis Without Autocorrelation Variability analysis of the pattern in successive strides of the sample by analysis of the acceleration patterns in CC axis
REG2CC Regularity index 2 CC axis Without Wavelet analysis+autocorrelation Variability analysis of the pattern in successive strides of the sample by analysis of the signal energy patterns in AP axis
CCAE CC acceleration energy J/ Wavelet analysis Total Energy of the wavelet spectrum on CC acceleration signal
HFSW High frequency shock wave % Wavelet analysis Percentage of the total energy due to high frequency>4Hz due to foot impacts and transient
performed to assess if the identified markers were significantly associated to fall as a function of its occurrence delay.
RESULTS
BASELINE CLINICAL CHARACTERISTICS
The mean and standard deviations, or frequencies and per-centages, as appropriate, of the baseline characteristics of the
entire sample and the four groups [non-fallers, fallers (+0 to+6 months), fallers (+6 to +12 months) and fallers (+12 to+24 months)] are presented in Table 2. To identify potential differences between non-fallers and fallers, One-Way ANOVAs (or equivalent non-parametric Kruskal-Wallis test as appropri-ate) were performed for all clinical variables. Note that no main effect of group was found, whatever the tested clinical variable.
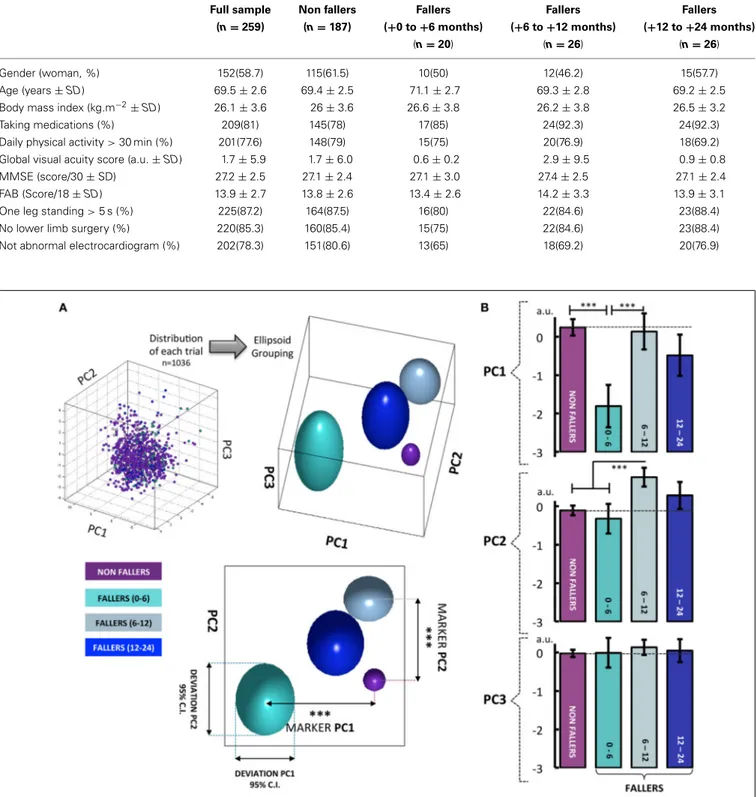
Table 2 | Baseline clinical characteristics (mean± standard deviation SD, or percentages) of the entire sample and the four groups: non-fallers, fallers from 0 to 6 months, fallers from 6 to 12 months and fallers from 12 to 24 months.
Full sample Non fallers Fallers Fallers Fallers
(n= 259) (n= 187) (+0 to +6 months) (+6 to +12 months) (+12 to +24 months)
(n= 20) (n= 26) (n= 26)
Gender (woman, %) 152(58.7) 115(61.5) 10(50) 12(46.2) 15(57.7)
Age (years± SD) 69.5± 2.6 69.4± 2.5 71.1± 2.7 69.3± 2.8 69.2± 2.5
Body mass index (kg.m−2± SD) 26.1± 3.6 26± 3.6 26.6± 3.8 26.2± 3.8 26.5± 3.2
Taking medications (%) 209(81) 145(78) 17(85) 24(92.3) 24(92.3)
Daily physical activity> 30 min (%) 201(77.6) 148(79) 15(75) 20(76.9) 18(69.2)
Global visual acuity score (a.u.± SD) 1.7± 5.9 1.7± 6.0 0.6± 0.2 2.9± 9.5 0.9± 0.8
MMSE (score/30± SD) 27.2± 2.5 27.1± 2.4 27.1± 3.0 27.4± 2.5 27.1± 2.4
FAB (Score/18± SD) 13.9± 2.7 13.8± 2.6 13.4± 2.6 14.2± 3.3 13.9± 3.1
One leg standing> 5 s (%) 225(87.2) 164(87.5) 16(80) 22(84.6) 23(88.4)
No lower limb surgery (%) 220(85.3) 160(85.4) 15(75) 22(84.6) 23(88.4)
Not abnormal electrocardiogram (%) 202(78.3) 151(80.6) 13(65) 18(69.2) 20(76.9)
FIGURE 2 | (A) When results from all walking tests are visualized in a 3-D space defined by the newly constructed variables PC1–3 (57.2% of explained variance), clear differences can be seen between the four groups: non-fallers, fallers from 0 to 6 months, fallers from 6 to 12 months and fallers from 12 to 24 months. For the PC1, the participants who fell from 0 to 6 months show a clear difference in behavior compared to the three other groups. Similarly, when considering the PC2, the fallers from 6 to 12 months can be significantly differentiated from all the other groups.
With PC3, no differentiation between groups was found. Note that the group of fallers from 12 to 24 months displays a behavior very similar to the non-fallers group. (B) These visual findings are confirmed by one-way analysis of variance, with the 4 groups used as a differential factor between subjects. The HSD Tukey tests were used as post-hoc tests following significant effects. The histograms represent the mean score of eigenvector for each group with±95% confidence intervals. Note. ∗p< 0.05,∗∗p< 0.01∗∗∗p< 0.001.
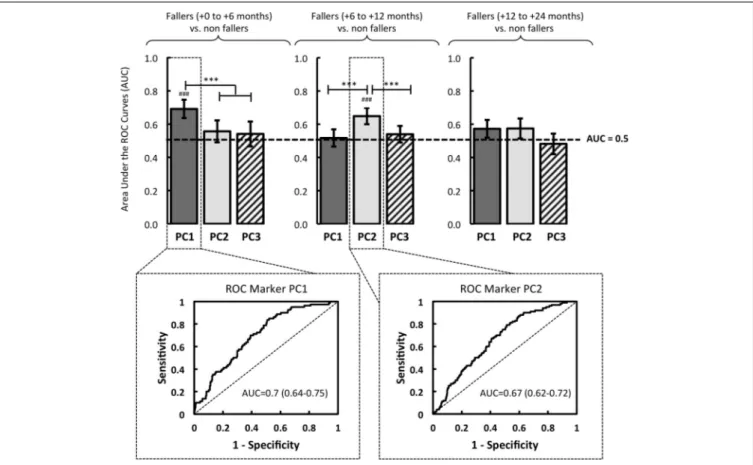
FIGURE 3 | Based on logistic regressions performed with the eigenvectors of PC1, PC2 and PC3, the quality of the models was evaluated by the area under the Receiver Operator Characteristic (ROC) Curve (AUC). The resulting models were compared in relation to three groups of fallers: fallers
from 0 to 6 months, fallers from 6 to 12 months, and fallers from 12 to 24 months. The significant AUC (i.e., different from a random law) are displayed in the figure where#p< 0.05,##p< 0.01, or###p< 0001. Note. Significant difference between models is reported:∗p< 0.05,∗∗p< 0.01∗∗∗p< 0.001.
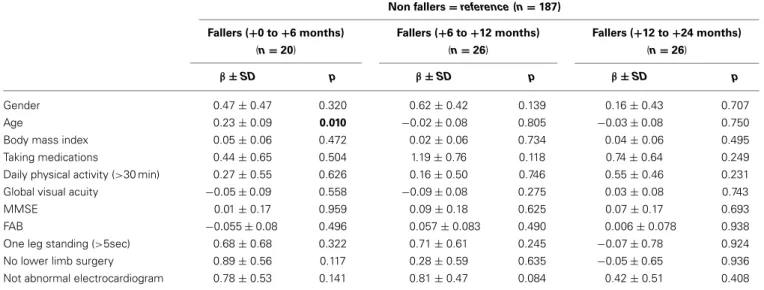
In addition, the overall statistical results are presented for each of these confounding variables in Table 3, with the regression coef-ficientβ ± the standard deviation and p-value. It is worthy to note that only a significant association between falls and age was found for the fallers group (+0 to +6 months), with the non-fallers used as the reference level (β = 0.23 ± 0.09; p = 0.01). There were no other significant relations, no matter what the con-founding factor included in the multinomial logistic regression analysis.
Steps 1–4
PC1 is composed of the following variables (r> 0.5, p < 0.05), which represent 80.6% of the PC1-variance and 36.7% of the total variance: VO2, PW3AX, CCAE, PWCC, PWAP, SPEED, PWML, STRF, SBV, STRL (see Figure 1 and Table 1 for the details). We denominated this PC1 the “Global kinetics of gait pattern,” includ-ing the mechanical power and temporo-spatial variables of walk-ing gait. Principal component loadwalk-ings also revealed a PC2 called “Global gait regularity,” which is composed of following variables (r> 0.5, p < 0.05), representing 54.3% of the PC2-variance and 12.6% of the total variance: SY2CC, REG1CC, SY3CC, HFSW (see Figure 1 and Table 1 for details). This component included three variables related to gait symmetry and regularity of walking strides (low variability). Finally, PC3 is constituted of variables
(r> 0.5, p < 0.05) which represent 49.7% of the PC3-variance and 7.9 % of the total variance: STRD, UBG, STRL (see Figure 1 and Table 1 for details). We labeled PC3 “Stride time,” including both stride duration and sum of acceleration vectors averaged by a part of stride time duration.
Step 5
The decomposition of the PC eigenvectors according to the non-faller groups showed a significant effect of group for PC1 [F(3, 1032)= 13.58, p < 0.001] and PC2 [F(3, 1032)= 10.06, p <
0.001]. No main effect of the group was shown with PC3 [F(3, 1035)= 0.48, p = 0.7]. The following HSD-Tukey post-hoc
tests showed that the fallers (+0 to +6 months) are greatly different from the non-fallers (p< 0.001) and the fallers (+6 to+12 months) (p < 0.001) on PC1. When considering PC2 “Global gait regularity,” the post-hoc comparisons revealed that the fallers (+6 to +12 months) differed from the non-fallers (p < 0.001) and the fallers (+0 to +6 months) (p < 0.001) (Figure 2).
Step 6
The ROC analysis revealed that PC1 had a significant predic-tive power of the first fall onset during the first six months after the initial screening: AUC= 0.7 (0.64–0.75, 95% CI) (p < 0.001). Over the course of these first six months, no association
Table 3 | Regression coefficientβ ± standard deviation and p-value for all baseline characteristics, obtained by multinomial logistic regression analysis.
Non fallers= reference (n = 187)
Fallers (+0 to +6 months) Fallers (+6 to +12 months) Fallers (+12 to +24 months)
(n= 20) (n= 26) (n= 26)
β ± SD p β ± SD p β ± SD p
Gender 0.47± 0.47 0.320 0.62± 0.42 0.139 0.16± 0.43 0.707
Age 0.23± 0.09 0.010 −0.02 ± 0.08 0.805 −0.03 ± 0.08 0.750
Body mass index 0.05± 0.06 0.472 0.02± 0.06 0.734 0.04± 0.06 0.495
Taking medications 0.44± 0.65 0.504 1.19± 0.76 0.118 0.74± 0.64 0.249
Daily physical activity (>30 min) 0.27± 0.55 0.626 0.16± 0.50 0.746 0.55± 0.46 0.231
Global visual acuity −0.05 ± 0.09 0.558 −0.09 ± 0.08 0.275 0.03± 0.08 0.743
MMSE 0.01± 0.17 0.959 0.09± 0.18 0.625 0.07± 0.17 0.693
FAB −0.055 ± 0.08 0.496 0.057± 0.083 0.490 0.006± 0.078 0.938
One leg standing (>5sec) 0.68± 0.68 0.322 0.71± 0.61 0.245 −0.07 ± 0.78 0.924
No lower limb surgery 0.89± 0.56 0.117 0.28± 0.59 0.635 −0.05 ± 0.65 0.936
Not abnormal electrocardiogram 0.78± 0.53 0.141 0.81± 0.47 0.084 0.42± 0.51 0.408
Note. Significant results are indicated in bold type (i.e., p< 0.05).
between the PC1 and falls was found (AUC< 0.5, p > 0.05) (Figure 3).
In the same vein, the logistic regression analysis revealed a rel-evant interest of PC2, significantly associated with an increased risk of first fall onset only when it occurred between the sixth and the twelfth months: AUC= 0.67 (0.62-0.72, 95% CI) (p < 0.001) (Figure 3). Note that no predictive power of PC3 was determined by the ROC analysis (AUC< 0.5, p > 0.05), whatever the date of the first fall onset.
Step 7
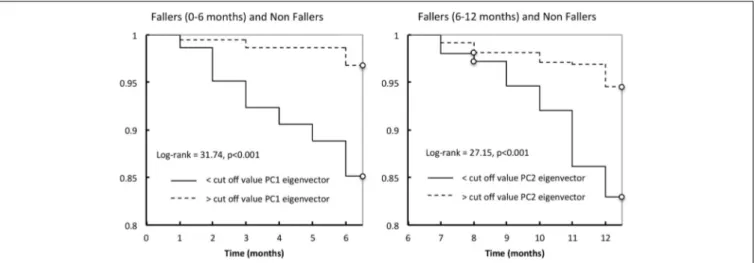
The logistic regression parameters showed ORs of 3.89 (2.2– 6.7, 95% CI) (p< 0.001) and of 3.6 (2.16–5.89, 95% CI) (p < 0.001), for PC1 and PC2, respectively. Lastly, considering only the non-fallers and fallers (+0 to +6 months), Kaplan-Meier’s distri-butions of falls differed significantly between those with values lower than cut-off value PC1 eigenvector and those with val-ues higher than the cut-off value PC1 (log-rank test = 31.74, p< 0.001; Figure 4). For the non-fallers and fallers (+6 to +12 months), similar difference of Kaplan-Meier’s distributions of falls was found between those with values lower than cut-off value PC2 eigenvector and those with values higher than the cut-off value PC2 (log-rank test= 27.15, p < 0.001; Figure 4).
DISCUSSION
Using a very simple and economical gait analysis system that allowed ecological measurements, we proposed a metrological and statistical analysis of gait patterns in home-dwelling people aged 66–75, with follow-up telephone calls each month during the first year, and every three months during the second year. The current findings provide for the first time the possibility of iden-tifying relevant indicators of imminent fall occurrence, that is the “Global kinetics of gait pattern” (PC1) and the “Global gait regular-ity” (PC2). In addition to the fact that the identification of these markers is relatively easy to envisage in clinical settings (i.e., safe test, short duration, and low cost), and might of special interest
to accurately estimate the available time before the occurrence of the first fall. Furthermore, this new key information might be use-ful for recommending a specific fall-prevention program. From a clinical viewpoint, to perform a walking test at least once a year might be essential for fall prevention.
It is important to bear in mind that the current cohort is very specific and original (i.e., home-dwelling people that had never fallen), and by definition has no previous evidence. In this respect, it is not necessarily surprising that no difference between the four groups was found when considering all the screened clini-cal variables (see Table 3). It might be suggested that the present population was “full-matched” at the time of inclusion, with the same well-documented multifactorial risks for falling (Gillespie et al., 2012; Bloch et al., 2013). Thus our current findings on the specific gait markers reinforce the main idea to accurately assess gait behavior for this healthy home-dwelling population. But this point needs to be confirmed and to be precisely tested in a prospective independent cohort. Nevertheless the current find-ings observed in an original cohort confirm that the gait analysis is probably one of best tools to predict the first fall onset, and most importantly, its occurrence time frame.
SPECIFIC GAIT MARKERS AND RISK OF FIRST FALL
Numerous studies have already demonstrated the relationship between gait disorders and risk of falling in the elderly, by supporting the idea that a decrease in walking speed in usual conditions and an increase of stride-time variability are strong predictors of falls (Dargent-Molina et al., 1996; Brach et al., 2005; Verghese et al., 2009; Studenski et al., 2011). However, as far as we know, all the conclusions drawn in the current retro-or prospective studies cannot be implemented in a population of healthy elderly people that have never fallen. Indeed, stud-ies with prospective follow-up for falls do not warrant that the participants included in the cohorts had not already fallen before the year preceding the initial screening.
FIGURE 4 | Kaplan-Meier estimates of the probability of a first fall occurrence during the first year follow-up according to the cut-off value of PC1 eigenvector (left) or PC2 eigenvector (right).
In this original context, the alterations in global kinetics of gait pattern (i.e., the PC1) can be used as a new locomotor marker, which is significantly associated with an increased risk of imminent fall occurrence. Based on a data reduction of high-dimensional gait data to a low-high-dimensional set of essential fea-tures, our analysis actually showed that PC1 discriminated the fall status during the first 6 months (see Figures 2, 3). Moreover, these results are bolstered by the ROC analyses: the logistic model showed that PC1 was significantly related to a higher risk of first fall during the first six months (AUC= 0.7, p < 0.001, OR = 3.89, p< 0.001). It is also worth noting that this first marker is modeled by a few variables (VO2: r= 0.957, p < 0.001, PW3AX: r= 0.952, p < 0.001 and CCAE: r = 0.927, p < 0.001), which are closely linked to symptoms of hypokinesia (see Table 1). Indeed, it is well established in the literature that aging can lead to impairments in the central and/or peripheral nervous system, which are consequently reflected in executive functions, or by a decrease in physical, functional and locomotor performance (e.g.,
Lundin-Olsson et al., 1997).
In this light, the slowing down of walking speed—a vari-able that composes the PC1—might be partially explained by a decrease in volume / thickness of white and gray matter at the cortical and subcortical levels (i.e., corticospinal tract, cortical atrophy in the frontal, parietal, hippocampal and motor-cortex), which are in charge of the programming and the execution of locomotor commands (Annweiler and Montero-Odasso, 2012; de Laat et al., 2012; Dumurgier et al., 2012; Rosano et al., 2012). Moreover, considering pathways downstream of the CNS, physio-logical aging also causes alterations in nerve conduction velocities (Borg, 1981; Wang et al., 1999; Scaglioni et al., 2002), muscle synergies/coordination (Woollacott et al., 1986; Olafsdottir et al., 2007), contractility of acto-myosin bridges (Frontera and Bigard, 2002; D’Antona et al., 2003), and transmission of force to the skeletal system (Narici and Maganaris, 2006; Onambele et al., 2006; Carroll et al., 2008). All these changes might cause impair-ment in motor skills, postural control and gait speed (Baloh et al., 1998; Brach and VanSwearingen, 2002; Amiridis et al., 2003;
Capodaglio et al., 2005; Buatois et al., 2006; Jung et al., 2006; Paterson and Warburton, 2010). Taken together, these aforemen-tioned studies might explain the observed hypokinetic behavior in participants that have fallen during the first 6 months, as an evidence of lack of flexibility (Hausdorff et al., 1996; Jordan et al., 2007).
The second major result highlighted in this study is the rel-evance of the “Global gait regularity” marker strongly related to the occurrence of a possible first fall 6–12 months after the ini-tial screening test (AUC= 0.67, p < 0.001, OR = 3.6, p < 0.001). Given the three variables included in the PC2 (these variables are SY2CC: r= 0.766, p < 0.001, REG1CC: r = 0.733, p < 0.001 and SY3CC: r= 0.675, p < 0001), the locomotor behavior is characterized by changes in regularity and symmetry parameters. There is clear evidence to suggest that the global gait regular-ity or gait variabilregular-ity (usually reported by using the coefficient of variation of stride time) is strongly associated with a risk of falling (Brach et al., 2005; Montero-Odasso et al., 2009; Lord et al., 2011; Beauchet et al., 2012; Toebes et al., 2012). From a neurophysiolog-ical point of view, some studies have clearly shown that changes in gait variability could be the result of atrophy and dysfunction in the parietal cortex (right angular gyrus) and hippocampus, which supports the idea of the decline of sensorimotor areas involved in executive functions (Camicioli et al., 1997; Marquis et al., 2002; Hausdorff, 2005; Zimmerman et al., 2009; Zwergal et al., 2012; Beauchet et al., 2013). More precisely, according to the results ofBeauchet et al. (2013), the focal neurodegeneration (especially in the parietal cortex, which is strongly involved in executive functions) might have altered the spatial displacement in relation to the surrounding environment, with subsequent impairment in gait regularity. In the same vein, Zwergal et al. (2012) demonstrated a relationship between age and the cor-tical control of gait, evidenced by higher attentional cost for controlling locomotor activity with age (i.e., the component of voluntary and executive function processes during the control of gait). In particular, they showed that the supraspinal locomo-tor centers remained preserved during aging, but multisensory
cortical control of locomotion changed with age. If young peo-ple adopt an automated mode of locomotion, the multisensory cortical activation in elderly persons occurs as a result of reduced reciprocal inhibitory sensory interaction. This might serve as a compensatory mechanism for peripheral sensory decline with age and confirm the more costly and irregular mode of locomotion in the elderly (seeZwergal et al., 2012, for details).
WHAT COULD BE DONE WITH THESE SIGNIFICANT MARKERS?
The aforementioned morpho-functional alterations in muscu-lar peripheral and central nervous systems as the source of gait disturbances are the result of natural physiological aging and apoptosis (Lexell, 1997; Tomlinson and Irving, 1977). Despite the inevitable component of aging, it is, however, possible to reduce or delay this age-related cognitivo-motor decline, through the preservative effects of adapted and regular physical activity. In fact, many studies have already demonstrated the positive impact of different exercise programs (e.g., voluntary muscular strength, neuromuscular electrostimulation, aerobic exercises, functional daily living exercises, combined training, dancing) on the daily activities and autonomy, quality of life, balance and/or walking (Fiatarone et al., 1994; Tinetti et al., 1994b; Dionne et al., 2003; Gauchard et al., 2003; Robinson et al., 2004; Toulotte et al., 2004; Capodaglio et al., 2005; Paillard et al., 2005; Sievänen and Kannus, 2007).
A subject exhibiting a generalized hypokinesia (i.e., indicative of imminent fall occurrence a maximum of 6 months prior to falling), could have an urgent need to be included in a preven-tion program. For example, the neuromuscular changes following a muscular training program are well-documented in the litera-ture in order to improve locomotor skills (Scaglioni et al., 2002; Capodaglio et al., 2005; Paillard et al., 2005). In parallel, or per-haps a priority given this patient profile, the implementation of structured safety programs for the daily living environment is of special interest for reducing risk factors (Tinetti et al., 1994b; Cumming et al., 1999; Sievänen and Kannus, 2007).
A subject with alterations in gait regularity and symmetry (i.e., the “gait variability” marker linked to the occurrence of a poten-tial first fall 6–12 months), would have enough time to benefit from specific therapeutic actions (multi-localized actions leading to a more efficient adaptation). This suggestion is in agreement with a recent study byTrombetti et al. (2011), which showed the benefits of a 6-month exercise multitasking program (performed at the tempo dictated by piano music), on the recovery of gait variability at normal levels, associated with a significant reduction of falling risk in the elderly.
LIMITS AND CONCLUDING REMARKS
Some limitations of the present study need to be considered. First, it should be noted that the number of fallers group was relatively low for each subgroup: n= 20 for fallers (+0 to +6 months), n= 26 for fallers (+6 to +12 months) and fallers (+12 to +24 months), and the size of fallers sample should be increased to reinforce the predictive power of our first risk profile model. The possibility of over-fitting results needs to be con-sidered. It is worth reminding that each subject performed four gait tests. Thus each walking test was considered as “a subject”
that can be implemented into the PCA and subsequent statisti-cal analyses (Courtine et al., 2009; van den Brand et al., 2012). Accordingly, all the analyses have been performed by considering 748 nonfallers-related tests and 288 fallers-related tests (i.e., 1036 “walking tests”). When fallers have been splitted in subgroups, then the analyses have been performed with n= 80 fallers-related tests for 0–6 months, or n= 104 fallers-related tests for 6–12 months or>12 months. This validated methodological proce-dure provided the advantage to reinforce the internal validity of results. Secondly, the regular follow-up phone-calls did not allow for re-assessment of the participants, in particular with regard to the walking test, in order to check what parameters were altered after the fall. Lastly, this observational design did not allow for the control of the risk factors and events during the follow-up por-tion of the study. Even if there is a significant associapor-tion between gait parameters and future falls (with potential clinical impact in terms of recommendations for specific fall-prevention programs), no causal link between the currently observed indicators and the first fall onset can clearly be drawn.
In any event, for the first time, the alterations in global kinetics of gait pattern and gait regularity have been identified as locomo-tor markers in older people that had never fallen. We suggest that these two specific gait markers might help the medical profession to prescribe an intervention early enough to effectively prevent a fall in healthy elderly people. Within this context of effective pri-mary prevention, medical professionals could also recommend urgent changes in the patient’s environment and recommend structured safety programs that will target suboptimal practices for environmental and personal safety.
ACKNOWLEDGMENTS
The research was supported by grants from the Region of Pays de la Loire, France, for the project “RP3AP.” This study received also support from Research Mission of Directorate for Research Studies, Evaluation and Statistics (Direction de la recherche, des études, de l’évaluation et des statistiques—MiRe-DRESS) and IRePS (French public health research institute). The sponsors had no role in the design and conduct of the study, in the collec-tion, management, analysis, and interpretation of the data, or in the preparation, review, or approval of the manuscript. Special thanks to Olivier Lantéri and Claude Trichet, directors of the Institut inter Régional pour la Santé (IRSA), a French public health institute.
REFERENCES
Amiridis, I. G., Hatzitaki, V., and Arabatzi, F. (2003). Age-induced modifica-tions of static postural control in humans. Neurosci. Lett. 350, 137–140. doi: 10.1016/S0304-3940(03)00878-4
Annweiler, C., and Montero-Odasso, M. (2012). Vascular burden as a substrate for higher-level gait disorders in older adults. A review of brain mapping literature.
Panminerva Med. 54, 189–204.
Arfken, C. L., Lach, H. W., Birge, S. J., and Miller, J. P. (1994). The prevalence and correlates of fear of falling in elderly persons living in the community. Am.
J. Public Health 84, 565–570. doi: 10.2105/AJPH.84.4.565
Auvinet, B., Berrut, G., Touzard, C., Moutel, L., Collet, N., Chaleil, D., et al. (2002). Reference data for normal subjects obtained with an accelerometric device. Gait
Posture 16, 124–134. doi: 10.1016/S0966-6362(01)00203-X
Auvinet, B., Berrut, G., Touzard, C., Moutel, L., Collet, N., Chaleil, D., et al. (2003). Gait abnormalities in elderly fallers. J. Aging Phys. Act. 11, 40–52.
Auvinet, B., Chaleil, D., and Barrey, E. (1999). Accelerometric gait analysis for use in hospital outpatients. Rev. Rhum. Engl. Ed. 66, 389–397.
Auvinet, B., Chaleil, D., Cabane, J., Dumolard, A., Hatron, P., Juvin, R., et al. (2011). The interest of gait markers in the identification of subgroups among fibromyalgia patients. BMC Musculoskelet. Disord. 12:258. doi: 10.1186/1471-2474-12-258
Baloh, R. W., Corona, S., Jacobson, K. M., Enrietto, J. A., and Bell, T. (1998). A prospective study of posturography in normal older people. J. Am. Geriatr. Soc. 46, 438–443.
Barthélémy, I., Barrey, E., Aguilar, P., Uriarte, A., Le Chevoir, M., Thibaud, J. L., et al. (2011). Longitudinal ambulatory measurements of gait abnor-mality in dystrophin-deficient dogs. BMC Musculoskelet. Disord. 12:75. doi: 10.1186/1471-2474-12-75
Beauchet, O., Annweiler, C., Celle, S., Bartha, R., Barthélémy, J. C., and Roche, F. (2013). Higher gait variability is associated with decreased parietal gray matter volume among healthy older adults. Brain Topogr. 27, 293–295. doi: 10.1007/s10548-013-0293-y
Beauchet, O., Annweiler, C., Montero-Odasso, M., Fantino, B., Herrmann, F. R., and Allali, G. (2012). Gait control: a specific subdomain of executive function?
J. Neuroeng. Rehabil. 9, 12. doi: 10.1186/1743-0003-9-12
Bloch, F., Thibaud, M., Tournoux-Facon, C., Brèque, C., Rigaud, A. S., Dugué, B., et al. (2013). Estimation of the risk factors for falls in the elderly: can meta-analysis provide a valid answer? Geriatr. Gerontol. Int. 13, 250–263. doi: 10.1111/j.1447-0594.2012.00965.x
Borg, J. (1981). Properties of single motor units of the extensor digitorum brevis in elderly humans. Muscle Nerve 4, 429–434. doi: 10.1002/mus.880040513 Brach, J. S., Berlin, J. E., Van Swearingen, J. M., Newman, A. B., and Studenski, S.
A. (2005). Too much or too little step width variability is associated with a fall history in older persons who walk at or near normal gait speed. J. Neuroeng.
Rehabil. 2, 21. doi: 10.1186/1743-0003-2-21
Brach, J. S., and VanSwearingen, J. M. (2002). Physical impairment and disability: relationship to performance of activities of daily living in community-dwelling older men. Phys. Ther. 82, 752–761.
Buatois, S., Gueguen, R., Gauchard, G. C., Benetos, A., and Perrin, P. P. (2006). Posturography and risk of recurrent falls in healthy non-institutionalized persons aged over 65. Gerontology 52, 345–352. doi: 10.1159/000 094983
Camicioli, R., Howieson, D., Lehman, S., and Kaye, J. (1997). Talking while walking: the effect of a dual task in aging and Alzheimer’s disease. Neurology 48, 955–958. doi: 10.1212/WNL.48.4.955
Campbell, A. J., Borrie, M. J., and Spears, G. F. (1989). Risk factors for falls in a community-based prospective study of people 70 years and older. J. Gerontol. 44, 112–117. doi: 10.1093/geronj/44.5.M112
Capodaglio, P., Capodaglio, E. M., Ferri, A., Scaglioni, G., Marchi, A., and Saibene, F. (2005). Muscle function and functional ability improves more in community-dwelling older women with a mixed-strength training programme. Age Ageing 34, 141–147. doi: 10.1093/ageing/afi050
Carroll, C. C., Dickinson, J. M., Haus, J. M., Lee, G. A., Hollon, C. J., Aagaard, P., et al. (2008). Influence of aging on the in vivo properties of human patellar tendon. J. Appl. Physiol. 105, 1907–1915. doi: 10.1152/japplphysiol. 00059.2008
Courtine, G., Gerasimenko, Y., van den Brand, R., Yew, A., Musienko, P., Zhong, H., et al. (2009). Transformation of nonfunctional spinal circuits into func-tional states after the loss of brain input. Nat. Neurosci. 12, 1333–1342. doi: 10.1038/nn.2401
Cumming, R. G., Thomas, M., Szonyi, G., Salkeld, G., O’Neill, E., Westbury, C., et al. (1999). Home visits by an occupational therapist for assessment and mod-ification of environmental hazards: a randomized trial of falls prevention. J. Am.
Geriatr. Soc. 47, 1397–1402.
D’Antona, G., Pellegrino, M. A., Adami, R., Rossi, R., Carlizzi, C. N., Canepari, M., et al. (2003). The effect of ageing and immobilization on structure and function of human skeletal muscle fibres. J. Physiol. 552, 499–511. doi: 10.1113/jphysiol.2003.046276
Dargent-Molina, P., Favier, F., Grandjean, H., Baudoin, C., Schott, A. M., Hausherr, E., et al. (1996). Fall-related factors and risk of hip fracture: the EPIDOS prospective study. Lancet 348, 145–149. doi: 10.1016/S0140-6736(96) 01440-7
de Laat, K. F., Reid, A. T., Grim, D. C., Evans, A. C., Kötter, R., van Norden, A. G., et al. (2012). Cortical thickness is associated with gait
disturbances in cerebral small vessel disease. Neuroimage 59, 1478–1484. doi: 10.1016/j.neuroimage.2011.08.005
Dionne, I. J., Ades, P. A., and Poehlman, E. T. (2003). Impact of cardio-vascular fitness and physical activity level on health outcomes in older persons. Mech. Ageing Dev. 124, 259–267. doi: 10.1016/S0047-6374(02) 00193-8
Dumurgier, J., Crivello, F., Mazoyer, B., Ahmed, I., Tavernier, B., Grabli, D., et al. (2012). MRI atrophy of the caudate nucleus and slower walking speed in the elderly. Neuroimage 60, 871–878. doi: 10.1016/j.neuroimage.2012. 01.102
Fiatarone, M. A., O’Neill, E. F., Ryan, N. D., Clements, K. M., Solares, G. R., Nelson, M. E., et al. (1994). Exercise training and nutritional supplementation for physical frailty in very elderly people. N. Engl. J. Med. 330, 1769–1775. doi: 10.1056/NEJM199406233302501
Frontera, W. R., and Bigard, X. (2002). The benefits of strength training in the elderly. Sci. Sports 17, 109–116. doi: 10.1016/S0765-1597(02)00135-1 Gauchard, G. C., Gangloff, P., Jeandel, C., and Perrin, P. P. (2003). Physical activity
improves gaze and posture control in the elderly. Neurosci. Res. 45, 409–417. doi: 10.1016/S0168-0102(03)00008-7
Gillespie, L. D., Robertson, M. C., Gillespie, W. J., Sherrington, C., Gates, S., Clemson, L. M., et al. (2012). Interventions for preventing falls in older peo-ple living in the community. Cochrane Database Syst. Rev. 9, CD007146. doi: 10.1002/14651858.CD007146.pub3
Greiner, M., Pfeiffer, D., and Smith, R. D. (2000). Principals and practical appli-cation of the receiver operating characteristic analysis for diagnostic tests. Prev.
Vet. Med. 45, 23–41. doi: 10.1016/S0167-5877(00)00115-X
Hausdorff, J. M. (2005). Gait Variability, methods modelling and meaning.
J. Neuroeng. Rehabil. 2, 19. doi: 10.1186/1743-0003-2-19
Hausdorff, J. M., Purdon, P. L., Peng, C. K., Ladin, Z., Wei, J. Y., and Goldberger, A. L. (1996). Fractal dynamics of human gait: stability of long-range correlations in stride interval fluctuations. J. Appl. Physiol. 80, 1448–1457.
Hausdorff, J. M., Rios, D. A., and Edelberg, H. K. (2001). Gait variability and fall risk in community-living older adults: a 1-year prospective study. Arch. Phys.
Med. Rehabil. 82, 1050–1056. doi: 10.1053/apmr.2001.24893
Jordan, K., Challis, J. H., and Newell, K. M. (2007). Speed influences on the scaling behavior of gait cycle fluctuations during treadmill running. Hum. Mov. Sci. 26, 87–102. doi: 10.1016/j.humov.2006.10.001
Jung, S. H., Ostbye, T., and Park, K. O. (2006). A longitudinal study of the relation-ship between health behavior risk factors and dependence in activities of daily living. J. Prev. Med. Public Health 39, 221–228.
Lexell, J. (1997). Evidence for nervous system degeneration with advancing age. J.
Nutr. 127, 1011–1013.
Lord, S., Baker, K., Nieuwboer, A., Burn, D., and Rochester, L. (2011). Gait variability in Parkinson’s disease: an indicator of non-dopaminergic contrib-utors to gait dysfunction? J. Neurol. 258, 566–572. doi: 10.1007/s00415-010-5789-8
Lord, S. R., Sherrington, C., and Menz, H. B. (2000). Falls in Older People: Risk
Factors and Strategies for Prevention. New York, NY: Cambridge University Press.
Lundin-Olsson, L., Nyberg, L., and Gustafson, Y. (1997). “Stops walking when talk-ing” as a predictor of falls in elderly people. Lancet 349, 617. doi: 10.1016/S0140-6736(97)24009-2
Luukinen, H., Koski, K., Laippala, P., and Kivelä, S. L. (1995). Predictors for recur-rent falls among the home-dwelling elderly. Scandinavian J. Prim. Health Care 13, 294–299. doi: 10.3109/02813439508996778
Mahoney, J., Sager, M., Dunham, M. C., and Johnson, J. (1994). Risk of falls after hospital discharge. J. Am. Geriatr. So. 42, 269–274.
Maki, B. E. (1997). Gait changes in older adults: predictors of falls or indicator of fear ? J. Am. Geriatr. Soc. 45, 313–320.
Marquis, S., Moore, M. M., Howieson, D. B., Sexton, G., Payami, H., Kaye, J. A., et al. (2002). Independent predictors of cognitive decline in healthy elderly persons. Arch. Neurol. 59, 601–606. doi: 10.1001/archneur.59.4.601
Mirelman, A., Herman, T., Brozgol, M., Dorfman, M., Sprecher, E., Schweiger, A., et al. (2012). Executive function and falls in older adults: new findings from a five-year prospective study link fall risk to cognition. PLoS ONE 7:e40297. doi: 10.1371/journal.pone.0040297
Montero-Odasso, M., Casas, A., Hansen, K. T., Bilski, P., Gutmanis, I., Wells, J. L., et al. (2009). Quantitative gait analysis under dual-task in older people with mild cognitive impairment: a reliability study. J. Neuroeng. Rehabil. 6:35. doi: 10.1186/1743-0003-6-35
Musienko, P., van den Brand, R., Märzendorfer, O., Roy, R. R., Gerasimenko, Y., Edgerton, V. R., et al. (2011). Controlling specific locomotor behaviors through multidimensional monoaminergic modulation of spinal circuitries. J. Neurosci. 31, 9264–9278. doi: 10.1523/JNEUROSCI.5796-10.2011
Narici, M. V., and Maganaris, C. N. (2006). Adaptability of elderly human muscles and tendons to increased loading. J. Anat. 208, 433–443. doi: 10.1111/j.1469-7580.2006.00548.x
Nevitt, M. C., Cummings, S. R., Kidd, S., and Black, D. (1989). Risk factors for recurrent non syncopal falls. J. Am. Med. Assoc. 261, 2663–2668. doi: 10.1001/jama.1989.03420180087036
O’Loughlin, J. L., Robitaille, Y., Boivin, J. F., and Suissa, S. (1993). Incidence of and risk factors for falls and injurious falls among the community-dwelling elderly.
Am. J. Epidemiol. 137, 342–354.
Olafsdottir, H., Yoshida, N., Zatsiorsky, V. M., and Latash, M. L. (2007). Elderly show decreased adjustments of motor synergies in preparation to action. Clin. Biomech. 22, 44–51. doi: 10.1016/j.clinbiomech.2006. 08.005
Onambele, G. L., Narici, M. V., and Maganaris, C. N. (2006). Calf muscle-tendon properties and postural balance in old age. J. Appl. Physiol. 100, 2048–2056. doi: 10.1152/japplphysiol.01442.2005
Paillard, T., Lafont, C. Pérès, C., Costes-Salon, M. C., and Soulat, J. M. (2005). Is electrical stimulation with voluntary muscle contraction of phys-iologic interest in aging women? Ann. Readapt. Med. Phys. 48, 20–28. doi: 10.1016/j.annrmp.2004.08.005
Paquet, J. M., Auvinet, B., Chaleil, D., and Barrey, E. (2003). Analysis of gait disor-ders in Parkinson’s disease assessed with an accelerometer. Rev. Neurol. (Paris). 159, 786–789.
Paterson, D. H., and Warburton, D. E. (2010). Physical activity and functional limitations in older adults: a systematic review related to Canada’s Physical Activity Guidelines. Int. J. Behav. Nutr. Phys. Act. 7, 38. doi: 10.1186/1479-5868-7-38
Robinovitch, S. N., Feldman, F., Yang, Y., Schonnop, R., Leung, P. M., Sarraf, T., et al. (2013). Video capture of the circumstances of falls in elderly peo-ple residing in long-term care: an observational study. Lancet 381, 47–54. doi: 10.1016/S0140-6736(12)61263-X
Robinson, B. S., Gordon, J. M., Wallentine, S. W., and Visio, M. (2004). Relationship between lower-extremity joint torque and the risk for falls in a group of community dwelling older adults. Physiother. Theory Pract. 20, 155–173. doi: 10.1080/09593980490487500
Rosano, C., Studenski, S. A., Aizenstein, H. J., Boudreau, R. M., Longstreth, W. T., and Newman, A. B. (2012). Slower gait, slower information process-ing and smaller prefrontal area in older adults. Age Ageprocess-ing 41, 58–64. doi: 10.1093/ageing/afr113
Rubenstein, L. Z., and Josephson, K. R. (2002). The epidemiology of falls and syncope. Clin. Geriatr. Med. 18, 141–158. doi: 10.1016/S0749-0690(02)00002-2 Rubenstein, L. Z., Robbins, A. S., Schulman, B. L., Rosado, J., Osterweil, D., and Josephson, K. R. (1988). Falls and instability in the elderly. J. Am. Geriatr. Soc. 36, 266–278.
Scaglioni, G., Ferri, A., Minetti, A. E., Martin, A., Van Hoecke, J., Capodaglio, P., et al. (2002). Plantar flexor activation capacity and H reflex in older adults: adaptations to strength training. J. Appl. Physiol. 92, 2292–2302. doi: 10.1152/japplphysiol.00367.2001
Scheffer, A. C., Schuurmans, M. J., van Dijk, N., van der Hooft, T., and de Rooij, S. E. (2008). Fear of falling: measurement strategy, prevalence, risk factors and consequences among older persons. Age Ageing 37, 19–24. doi: 10.1093/ageing/afm169
Shapiro, D. E. (1999). The interpretation of diagnostic tests. Stat. Methods Med. Res. 8, 113–134. doi: 10.1191/096228099666928387
Sievänen, H., and Kannus, P. (2007). Physical activity reduces the risk of fragility fracture. PLoS Med. 4:e222. doi: 10.1371/journal.pmed.0040222
Stalenhoef, P. A., Diederiks, J. P., Knottnerus, J. A., Kester, A. D., and Crebolder, H. F. (2002). A risk model for the prediction of recurrent falls in community-dwelling elderly: a prospective cohort study. J. Clin. Epidemiol. 55, 1088–1094. doi: 10.1016/S0895-4356(02)00502-4
Stel, V. S., Pluijm, S. M., Deeg, D. J., Smit, J. H., Bouter, L. M., and Lips, P. (2003). A classification tree for predicting recurrent falling in community-dwelling older persons. J. Am. Geriatr. Soc. 51, 1356–1364. doi: 10.1046/j.1532-5415.2003.51452.x
Studenski, S., Perera, S., Patel, K., Rosano, C., Faulkner, K., Inzitari, M., et al. (2011). Gait speed and survival in older adults. JAMA 305, 50–58. doi: 10.1001/jama.2010.1923
Thapa, P. B., Gideon, P., Fought, R. L., and Ray, W. A. (1995). Psychotropic drugs and risk of recurrent falls in ambulatory nursing home residents. Am.
J. Epidemiol. 142, 202–211.
Tinetti, M. E., Baker, D. I., McAvay, G., Claus, E. B., Garrett, P., Gottschalk, M., et al. (1994b). A multifactorial intervention to reduce the risk of falling among elderly people living in the community. N. Engl. J. Med. 331, 821–827. doi: 10.1056/NEJM199409293311301
Tinetti, M. E., Mendes de Leon, C. F., Doucette, J. T., and Baker, D. I. (1994a). Fear of falling and fall related efficacy in relationship to func-tioning among community-living elders. J. Gerontol. 49, 140–147. doi: 10.1093/geronj/49.3.M140
Tinetti, M. E., and Williams, C. S. (1997). Falls, injuries due to falls, and the risk of admission to a nursing home. N. Engl. J. Med. 337, 1279–1284. doi: 10.1056/NEJM199710303371806
Tinetti, M., Speechley, M., and Ginter, S. F. (1988). Risk factors for falls among elderly persons living in the community. N. Engl. J. Med. 319, 1701–1707. doi: 10.1056/NEJM198812293192604
Toebes, M. J., Hoozemans, M. J., Furrer, R., Dekker, J., and van Dieën, J. H. (2012). Local dynamic stability and variability of gait are associated with fall his-tory in elderly subjects. Gait Posture 36, 527–531. doi: 10.1016/j.gaitpost.2012. 05.016
Tomlinson, B. E., and Irving, D. (1977). The numbers of limb motor neurons in the human lumbosacral cord throughout life. J. Neurol. Sci. 34, 213–219. doi: 10.1016/0022-510X(77)90069-7
Toulotte, C., Thévenon, A., and Fabre, C. (2004). Effects of training on static and dynamic balance in elderly subjects who have had a fall or not. Ann. Readapt.
Med. Phys. 47, 604–610. doi: 10.1016/S0168-6054(04)00179-5
Trombetti, A., Hars, M., Herrmann, F. R., Kressig, R. W., Ferrari, S., and Rizzoli, R. (2011). Effect of music-based multitask training on gait, balance, and fall risk in elderly people: a randomized controlled trial. Arch. Intern. Med. 171, 525–533. doi: 10.1001/archinternmed.2010.446
van den Brand, R., Heutschi, J., Barraud, Q., DiGiovanna, J., Bartholdi, K., Huerlimann, M., et al. (2012). Restoring voluntary control of locomotion after paralyzing spinal cord injury. Science 336, 1182–1185. doi: 10.1126/sci-ence.1217416
Vassallo, M., Sharma, J. C., Briggs, R. S., and Allen, S. C. (2003). Characteristics of early fallers on elderly patient rehabilitation wards. Age Ageing 32, 338–342. doi: 10.1093/ageing/32.3.338
Verghese, J., Holtzer, R., Lipton, R. B., and Wang, C. (2009). Quantitative gait mark-ers and incident fall risk in older adults. J. Gerontol. A. Biol. Sci. Med. Sci. 64, 896–901. doi: 10.1093/gerona/glp033
Wang, F. C., de Pasqua, V., and Delwaide, P. J. (1999). Age-related changes in fastest and slowest conducting axons of thenar motor units. Muscle Nerve 22, 1022–1029. doi: 10.1002/(SICI)1097-4598(199908)22:8%3C1022::AID-MUS3%3E3.3.CO;2-6
Weiss, A., Brozgol, M., Dorfman, M., Herman, T., Shema, S., Giladi, N., et al. (2013). Does the evaluation of gait quality during daily life pro-vide insight into fall risk? A novel approach using 3-day accelerometer recordings. Neurorehabil. Neural Repair 27, 742–52. doi: 10.1177/1545968313 491004
Wickham, C., Cooper, C., Margetts, B. M., and Barker, D. J. (1989). Muscle strength, activity, housing and the risk of falls in elderly people. Age Ageing 18, 47–51. doi: 10.1093/ageing/18.1.47
Wild, D., Nayak, U. S., and Isaacs, B. (1981). How dangerous are falls in old people at home? Br. Med. J. (Clin. Res. Ed.) 282, 266–268. doi: 10.1136/bmj.282.6260.266
Woollacott, M. H., Shumway-Cook, A., and Nashner, L. M. (1986). Aging and pos-ture control: changes in sensory organization and muscular coordination. Int. J.
Aging Hum. Dev. 23, 97–114. doi: 10.2190/VXN3-N3RT-54JB-X16X
WHO. (2007). World Health Organization Report. Global Report on Falls Prevention
in Older Age, 47p. Available online at:
http://www.who.int/ageing/publica-tions/Falls_prevention7March.pdf
Youden, W. J. (1950). Index for rating diagnostic tests. Cancer 3, 32–35. doi: 10.1002/1097-0142(1950)3:1%3C32::AID-CNCR2820030106%3E3.0. CO;2-3
Zimmerman, M. E., Lipton, R. B., Pan, J. W., Hetherington, H. P., and Verghese, J. (2009). MRI- and MRS-derived hippocampal correlates of quan-titative locomotor function in older adults. Brain. Res. 1291, 73–81. doi: 10.1016/j.brainres.2009.07.043
Zwergal, A., Linnb, J., Xiong, G., Brandt, T., Struppa, M., and Jahna, K. (2012). Aging of human supraspinal locomotor and postural control in fMRI.
Neurobiol. Aging 33, 1073–1084. doi: 10.1016/j.neurobiolaging.2010.09.022
Conflict of Interest Statement: Prof. Eric Barrey and Dr. Bernard Auvinet devel-oped and validated the gait analysis software Locometrix® for medical and sport applications. This device has been patented by INRA and is sold under exclu-sive license by the company Centaure Metrix. The other authors declare that the research was conducted in the absence of any commercial or financial relationships that could be construed as a potential conflict of interest.
Received: 30 August 2013; paper pending published: 29 September 2013; accepted: 06 February 2014; published online: 25 February 2014.
Citation: Mignardot J-B, Deschamps T, Barrey E, Auvinet B, Berrut G, Cornu C, Constans T and de Decker L (2014) Gait disturbances as specific predictive markers of the first fall onset in elderly people: a two-year prospective observational study. Front. Aging Neurosci. 6:22. doi: 10.3389/fnagi.2014.00022
This article was submitted to the journal Frontiers in Aging Neuroscience.
Copyright © 2014 Mignardot, Deschamps, Barrey, Auvinet, Berrut, Cornu, Constans and de Decker. This is an open-access article distributed under the terms of the Creative Commons Attribution License (CC BY). The use, distribution or reproduction in other forums is permitted, provided the original author(s) or licensor are credited and that the original publication in this journal is cited, in accordance with accepted academic practice. No use, distribution or reproduction is permitted which does not comply with these terms.