EVALUATING THE DEVELOPMENT OF LIFE AND PROGRESS OF HEAVY VEHICLES BASED ON ANALYTICAL HIERARCHY PROCESS (AHP) IN MAIN
SUBSYSTEMS
G. Soleimani1,*, M. Amiri1, S. M. A. K. Firouzabadi1, M. J. Esfahani2
1
Department of Industrial Management, Allameh Tabataba’i University, Tehran, Iran 2
PhD student Researchers and Elite Club, Naragh Branch, Islamic Azad University, Naragh, Iran
Received: 02 February 2016 / Accepted: 14 April 2016 / Published online: 01 September 2016 ABSTRACT
The development of automotive products considering product lifecycle is considered as one of the automotive strategic key issues. In this article, Analytical Hierarchy Process (AHP) is used to evaluate the lifetime of heavy vehicles. To do this research, subsystems of weighted Titan heavy vehicle and the position of desired vehicle compared to other vehicles in the various subsystems and in general by the technical standards, new technologies and aesthetic appearance is evaluated. Finally, the curve of progress and technology life of Titan vehicle is provided. The results show that technical standards in automotive technology growth curve has the greatest impact in comparison with other properties. About Titan vehicle according to the technology lifecycle should be considered this issue that the technology of this vehicle because spending their maturity era is in decline. Regarding the investigation of new technologies, we have to think to make changes in vehicle technology or finding alternative technology. According to the first priority, criteria and the weight of analytic hierarchy process, the technical criteria, first the action should be done in technical improvements of the vehicle, and also considering that the sub-criteria of engine performance assigned the highest weight to itself, most of the studies should be placed in order to improve Titan automotive technology in terms of vehicle performance.
Keywords: lifecycle, lifecycle of technology, heavy vehicles, subsystems, Analytical Hierarchy Process (AHP)
Author Correspondence, e-mail:g.soleimani@atu.ac.ir
doi:http://dx.doi.org/10.4314/jfas.v8i3.33 ISSN 1112-9867
Available online at http://www.jfas.info
Journal of Fundamental and Applied Sciences is licensed under aCreative Commons Attribution-NonCommercial 4.0 International License.Libraries Resource Directory. We are listed underResearch Associationscategory.
INTRODUCTION
Technology Lifecycle (TLC) describes the commercial benefits of a product at the expense of research and development stage and financial return as its "vital life". Some technologies, such as steel, paper and cement construction have high life expectancy (with less variety in the technology that is incorporated with time) while in other cases, such as machinery and electrical products, lifecycle can be very short. Four stages of the technology lifecycle, including: Research and development (R & D) stage, when revenues of inputs are negative and where predict the possibility of failure is high. Stage of development, when the costs are paid out of pocket and technology begins recovery gathers strength to go beyond the first stage by TLC. Maturity stage, when interest is high and constant and that the territory is saturated, marked by M. The decline stage, after this point, the enjoyment and use of the technology decreases. Increasing technological progress "was made at first slowly, then accelerated and continued to have gone into decline" (Ford, 1981) and thus corresponds to the general structure of S-curve (Schilling, 2016). The use of S-curve in literature it has not been very reliable and this is true particularly in relation to the scale that it implies. Common interpretation can be planned with a retractable acceptance of a technology over time which leads to a model that sometimes we call it propagation model. This model has drawn several phases such that it can be used in the early stages of growth, maturation and aging (Schilling, 2016). Consequently, it can be used for projecting changes in or implementation of technological progress over time (Dimitriades, 2005, Ford, 1981). Here this concept is depicted in progress that there was not much speed in the early stages and with the uncertainty about the underlying technology has been grappling, later by overcoming the difficulties in the way of accelerated and this has happened before when as a result of natural limitations of technology, again has been declining. Despite the widespread prevalence of this issue, empirical evidence has created many doubts about the reliability run against time and instead, S-curve compared with a moderate curve approximation suggests that the evolution of technology has been more of a stage performance and the distinct performance improvements occur after long periods of lack of progress. Other authors such as Lee (2005) on the y-axis in S-curve models are tagged with the release and implementation and researchers are still many interval on the x-axis with the amount of effort has been devoted to development (Ford, 1981) or by extension, public efforts engineering (Phaal, 2011, Unido et al, 1989). There have been numerous discussions around this investment in the development of a technology (for example, hours of work, budget allocations, the researchers used etc.) has been a most appropriate width x and a parallel effect on the time required for the technical implementation
is to improve. While it is said that the time factor is a very resulted in an error (Ford, 1981), but in practical research is often used as an alternative, because it is difficult to obtain the data necessary to establish the overall level of investment. In another form of the S-curve, a technology investment attractiveness is shown that this is done through the development of operational planning as usual. In fact, measuring the activity is the operation of each of the models predicted optimal deployment of technology (for example, Wong et al., 2012, Utterback, 1994). Dimitriades (1981) on this issue argued that the cumulative sales application created by all the preparations are done through technology because as an early indicator obvious and it is easy to measure using objective data base utilization data.
Fig.1. Conventional technology of S-curve
In this study, hierarchical approach is used for the lifetime of heavy vehicles. For this purpose, first, subsystems of weighted Titan heavy vehicle and the position of desired vehicle compared to other vehicles in the various subsystems and in general by the technical criteria, new technologies and aesthetic appearance is evaluated. Finally, the curve of progress and technology life of Titan vehicle is provided.
1- Technology Management
Technology management is an expression of technology management and guidance at social macro level or enterprise micro level. Technology management is a multidisciplinary or interdisciplinary activity that requires different expertise, including engineering, natural sciences, social sciences, business and industrial methods and theory together (Ahmad, 2010). From the perspective of technology management, technology is the ultimate source of wealth creation and wealth is more than money that could be factors such as knowledge, intellectual
capital, effective use of resources, conservation and other factors in raising the standard and quality of life will be included.
2-1- Technology components
According to some definitions, it can be considered four elements for technology in other words, technology as a set of four component or element has been established. The four components are: hardware, human ware, information ware and organization ware. Integrated hardware technology in a variety of tools and machinery used in the production of goods and services called technology ware that includes tools, equipment and machinery. Human ware is technology embodied in humans (workers, technicians, engineers and managers) who is said to have the same experiences, skills, knowledge and creativity and mental aspects. Information ware, say technology embodied in various information and documents required for use in the production of goods and services which is included procedures, opinions, observations and guidelines and process descriptions and software suite. Organization ware is technology embodied in institutions (workshops, factories and laboratories), which is used in the development and completion of the application and development of technology. All operations and management organization for institutions involved in technological tasks can be used in this range. In other words we can say that a combination of hardware and software technology hardware and software, including the means of production and the final product is including human ware, information ware and organization ware (Yousefpour, 1996) Figure 2 shows the relationship of technology with the production system.
Fig.2. The relationship of technology with the production system
Industries also have a lifecycle of such products. The degree of maturity of an industry and its stability and predictability is the result. The maturity of an industry cycle are:
Growth rate and growth potential Breadth of product line and Activities
The number of competitors and their structure Customer commitment
Distribution and stability of their market share Ease of entry into the industry
Focus technology and sustainability
In fact, as life goes on living beings from birth to death each technology also leave behind this process is like living the life of technology is as follows.
1. Infant (birth) 2. Growth 3. Maturity 4. Decline (death)
That it is displayed in a coordinate to S form and the curve in the time axis, X axis and characterization technology, Y axis in Figure 3 specifies the age of technology.
Fig.3. Technology lifecycle
1- Birth or infant stage: Slow technology associated with high investment. At this stage, technical problems must be resolved to reach commercial stage that at this stage
impossible to assess the probability of success in the market because at this stage there are significant problems in the product.
2- Growth stage: At this stage, the resolution of technical problems and performance technology and products, rapid growth, and will acquire a considerable amount of market. This is a great investment done by the competitors, in the process, reduce costs and increase product quality is the most cost due to fierce competition in the market, which makes at reduced prices.
3- Maturity stage: This stage is that the technology has reached the highest levels of performance and technical specifications and this stage where it must improve technology if it does not happen and do not meet customers' needs and market, this product is not competitive and will lose its place in the market. And consequently the product and product technology S-curve reduced to the decline.
It is noteworthy that with the technology lifecycle, PLC product lifecycle can also be not affectless somehow S-curve because customers are willing to pay to meet their needs in this curve, as follows:
1- Introduction stage: that 2.5% are clients who are usually innovativeness. 2- Growth stage: that 13.5% are clients who say they experts or reference group.
3- Maturity stage: that 68% of customers are actually buying the peak sales organization and customers.
4- Decline stage: that 16% are clients that after the purchase of the majority of customers, the customers are buying and are slow-loading out of the cycle.
3- RESEARCH METHODOLOGY
3-1- The concept of S-curve of technological progress (Twiss, 1992)
The following curves, which is called the S-curve of technological progress, show measurable performance a technological characteristics as compared with the passage of time. The technology can include: speed, strength, durability or any other characteristic of technology that developed over time and grows up to a limit of its growth. For example, the velocity is increased in the aircraft propeller has a limit, the limit with the arrival of jet aircraft.
Fig.4. Diagram of a biological system (lifecycle curve or S-curve)
Fig.5. Diagram of a biological system (lifecycle curve or S-curve)
Fig.6. lifecycle curve or S-curve
This research has been applied in terms of goal and the methodology in this research is library research and interviews with experts. In the present study, we investigated the extraction criteria and sub-criteria to compare heavy vehicles and also a number of heavy tractors vehicles were identified, then during interviews with experts and managers of military vehicles was carried out to check the candidate vehicles, derived criteria and sub-criteria that the cases referred to in the remainder of this season and the result was confirmed. The next
step is to compare between vehicles through interviews with experts were determined to multi-criteria decision methods to be used for this purpose. One of the methods of decision-making, AHP was selected and used. Then again, an interview was conducted with experts to the pair comparison matrix used in the Analytic Hierarchy Process with the opinion of the experts reviewed and completed. According to the pair-wise comparison matrix and hierarchical analysis method to prioritize candidate vehicles, was conducted to determine the number of heavy vehicles compared to vehicles with all the candidates, for this purpose, the software Expert Choice 11 was used. Finally, according to the rank of Titan in the midst of heavy vehicles was to predict the state of the technology curve graph of Titan vehicle and it was introduced the technology lifecycle of Titan vehicle.
3-2- Technology Lifecycle
With Titan vehicle reviews and technical characteristics and appearance of these powerful tractors, we need to look at the lifecycle of this tractors technology. As life goes on living beings from birth to death each technology also leave behind this process is like living the life of technology
3-3- Implementation of Analytical Hierarchy Process
We are going to use the analytic hierarchy process in the following steps: 3-3-1- Creating Analytical Hierarchy
Analytical hierarchy is proposed to prioritize lethal vehicles in accordance with the following diagram, please kindly confirm your comment about this proposed analytical hierarchy and used criteria and sub-criteria and if you need to remove or add items, please refer applying the necessary changes. (Due to the impossibility of sub-criteria display in the chart below in the following table, sub-criteria is displayed).
Fig.7. Chart of Analytical Hierarchy Process to choose the best heavy tractors vehicle
The studied vehicles include the following: Option 1: Titan Z4052
Option 2: Mercedes-Benz Actros 797B (308 tons) Option 3: Volvo F16 750 (120 tons)
Option 4: K E N W O R T H W900 (90 tons) Option 5: Mack Super-Liner MP10 (250 tons)
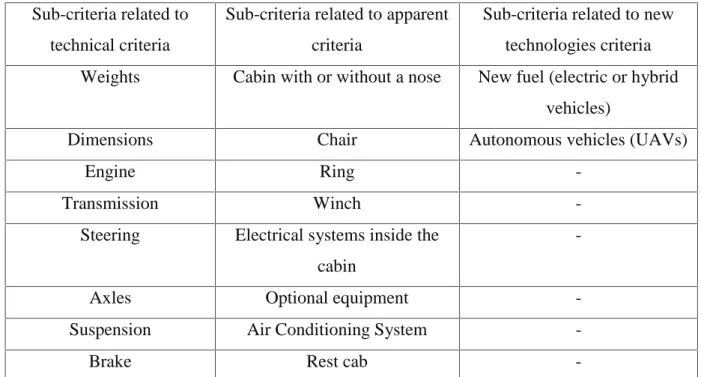
For each one of the vehicles, vehicle subsystems as the table (2) are considered as sub-criteria in Analytical Hierarchy method.
Table 2. Vehicle subsystems
Sub-criteria related to new technologies criteria Sub-criteria related to apparent
criteria Sub-criteria related to
technical criteria
New fuel (electric or hybrid vehicles)
Cabin with or without a nose Weights
Autonomous vehicles (UAVs) Chair Dimensions -Ring Engine -Winch Transmission -Electrical systems inside the
cabin Steering -Optional equipment Axles -Air Conditioning System
Suspension
-Rest cab
Brake
Now, using the criteria and sub-criteria that must be prepared weighting tables in each of tables according to the table of indicators than the target set preferences do pairwise comparisons and, please confirm your desired weight. Table (3) provides a weight factor to each of the subsystems.
Table 3. Preferred setting element compared to the other element Numerical
value Preferences (oral judgment)
9 Extremely preferred Extremely preferred 7 Very strongly preferred Very strongly preferred
5 Strongly preferred Strongly preferred 3 Moderately preferred Moderately preferred 1 Equally preferred Equally preferred
2,4,6,8 Strongly preferred between
intervals
4- RESULTS
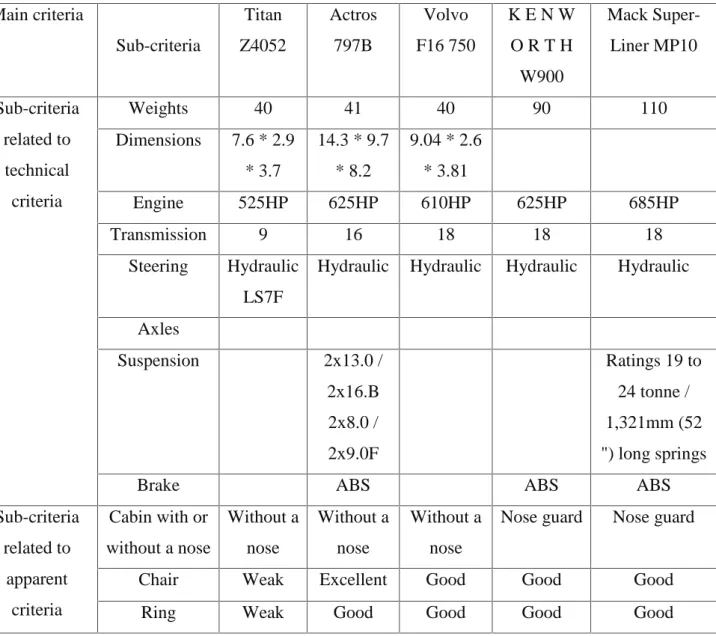
For weighing vehicles in pairwise comparisons need to verify the information given in this study. In Table 4 we have as information about the presented options.
Pairwise comparisons will be as follows:
Pairwise comparison of the main criteria compared to the target
Pairwise comparison of the sub-criteria compared to the related main criteria Pairwise comparison of the options compared to the sub-criteria
Table 4. Comparing vehicles according to the criteria and sub-criteria
Mack Super-Liner MP10 K E N W O R T H W900 Volvo F16 750 Actros 797B Titan Z4052 Sub-criteria Main criteria 110 90 40 41 40 Weights Sub-criteria related to technical criteria 9.04 * 2.6 * 3.81 14.3 * 9.7 * 8.2 7.6 * 2.9 * 3.7 Dimensions 685HP 625HP 610HP 625HP 525HP Engine 18 18 18 16 9 Transmission Hydraulic Hydraulic Hydraulic Hydraulic Hydraulic LS7F Steering Axles Ratings 19 to 24 tonne / 1,321mm (52 ") long springs 2x13.0 / 2x16.B 2x8.0 / 2x9.0F Suspension ABS ABS ABS Brake Nose guard Nose guard Without a nose Without a nose Without a nose Cabin with or without a nose Sub-criteria related to apparent criteria Good Good Good Excellent Weak Chair Good Good Good Good Weak Ring
Winch Average Average Good Excellent Weak Electrical systems inside the cabin Weak Weak Good Excellent Weak Optional equipment Average Average Good Excellent Weak Air Conditioning System Excellent Excellent Average Average Weak Rest cab
Does not have Does not have Does not have Does not have Does not have New fuel (electric or hybrid vehicles) Sub-criteria related to new technologies criteria
Does not have Does not have Does not have Does not have Does not have Autonomous vehicles (UAVs)
Table 5. Pairwise comparisons between sub-criteria related to technical criteria
Bra ke Wh eel Suspen sion Axl es Steeri ng Transmis sion Engi ne Operat ion Dimens ions Weig hts 3 3 1 1 1 1 1.3 1.3 1 1 Weights 3 1 1 1 1 1 1.3 1.3 1 1 Dimensi ons 5 5 3 3 3 3 1 1 3 3 Operatio n 5 5 3 3 5 3 1 1 3 3 Engine 3 1 1 1 3 1 1.3 1.3 1 1 Transmis sion 3 3 1.3 1 1 1.3 1.5 1.5 1 1 Steering 3 3 1 1 1 1 1.3 1.3 3 1 Axles 3 3 1 1 3 1 1.3 1.3 1 1 Suspensi on
1.3 1 1.3 1.3 1.3 1 1.5 1.5 1 1.3 Wheel 1 3 1.3 1.3 1.3 1.3 1.5 1.5 1.3 1.3 Brake
Table 6. Pairwise comparisons between sub-criteria related to apparent criteria
Rest cab Air Conditioning System Optional equipment Electrical systems inside the cabin Winch Ring Chair Cabin 9 5 9 3 5 7 7 1 Cabin 3 1.3 3 1.3 1 1 1 1.7 Chair 3 1.3 3 1.3 1.3 1 1 1.7 Ring 3 1 3 1.3 1 3 1 1.5 Winch 5 1 5 1 3 3 3 1.3 Electrical systems inside the cabin 3 1.5 1 1.5 1.3 1.3 1.3 1.9 Optional equipment 5 1 5 1 1 3 3 1.5 Air Conditioning System 1 1.5 1.3 1.5 1.3 1.3 1.3 1.9 Rest cab
Table 7. Pairwise comparisons between sub-criteria related to new technology criteria Autonomous vehicles
(UAVs) New fuel (electric or hybrid
vehicles)
3 1
New fuel (electric or hybrid vehicles)
1 1.3
Autonomous vehicles (UAVs)
New technologies criteria Apparent criteria Technical criteria 5 9 1 Technical criteria 1.5 1 1.9 Apparent criteria 1 5 1.5 New technologies criteria
Table 9. Pairwise comparison of vehicles compared to weights sub-criteria
Mack Super-Liner MP10 K E N W O R T H W900 Volvo F16 750 Actros 797B Titan Z4052 Weights sub-criteria 1.8 1.5 1 1 1 Titan Z4052 1.8 1.5 1 1 1 Actros 797B 1.8 1.5 1 1 1 Volvo F16 750 1.3 1 5 5 5 K E N W O R T H W900 1 3 8 8 8 Mack Super-Liner MP10
All the above weighted and pairwise comparisons were entered in Expert Choice software, which ultimately exit the application in accordance with the following order, prioritized options: 1- Mack Super-Liner MP1 2- Kenworth W900 3- Volvo F16 750 4- Mercedes-Benz Actros 5- Titan Z4052
As can be seen, Titan vehicle has the last rank among the vehicle and it suggested that Titan vehicle was weaker against other options. In the following diagrams also output image of software has been shown.
Fig.8. Output image of Expert Choice software
5-
RESULTS5-1- The results of Analytical Hierarchy Process
In this section the method of research and studies on the subject and AHP and technology curve of Titan vehicle, we pay to analyze the results of AHP to resolve the raised issue, then using the obtained results, we pay to investigate the position of Titan vehicle in its technology lifecycle curve. In each of computational steps, the software specifies the options mentioned weight relative to the target, the software of weight options proposed compared to the target, criteria or sub-criteria, the sub-criteria weight compared to the criteria, criteria weight compared to the target were calculated, during the following tables, we pay to state the weights.
Table 10. Weight of each criteria compared to the target Weight Criteria Row 0.735 Technical 1 0.058 Apparent 2 0.207 New technologies 3
As can be seen clearly from the chart above, technical criteria assigned the highest weight to itself.
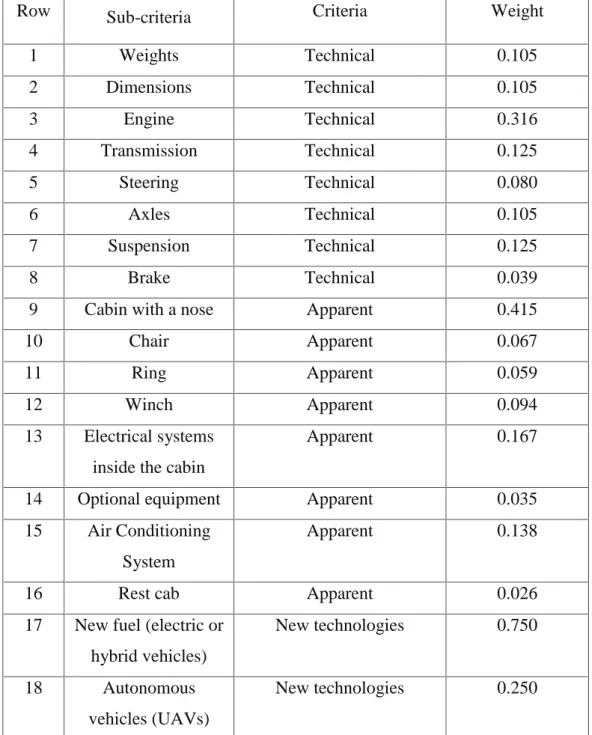
Table 11. Weight of each sub-criteria compared to the relevant criteria Weight Criteria Sub-criteria Row 0.105 Technical Weights 1 0.105 Technical Dimensions 2 0.316 Technical Engine 3 0.125 Technical Transmission 4 0.080 Technical Steering 5 0.105 Technical Axles 6 0.125 Technical Suspension 7 0.039 Technical Brake 8 0.415 Apparent
Cabin with a nose 9 0.067 Apparent Chair 10 0.059 Apparent Ring 11 0.094 Apparent Winch 12 0.167 Apparent Electrical systems inside the cabin 13 0.035 Apparent Optional equipment 14 0.138 Apparent Air Conditioning System 15 0.026 Apparent Rest cab 16 0.750 New technologies
New fuel (electric or hybrid vehicles) 17 0.250 New technologies Autonomous vehicles (UAVs) 18
As can be seen from the chart above, among the sub-criteria related to technical criteria, engine performance has the highest weight and brakes have the lowest weight and weight, dimensions and axles criteria have equal weight and importance. Similarly, among sub-criteria related to the apparent sub-criteria, cabin with or without a nose have the highest weight and importance, rest cab has the lowest weight and importance. The reason of this issue can be argued that the participating specialists in this study have completed pairwise comparison matrices according to the military vehicle with regard to the issue of weights and priorities are reasonable. Finally, the new fuels sub-criteria weighing 0.750 has more importance than the
autonomous vehicles sub-criteria. In this part of the sub-criteria weights expressed our options. In this section, we express the weights of options compared to the sub-criteria.
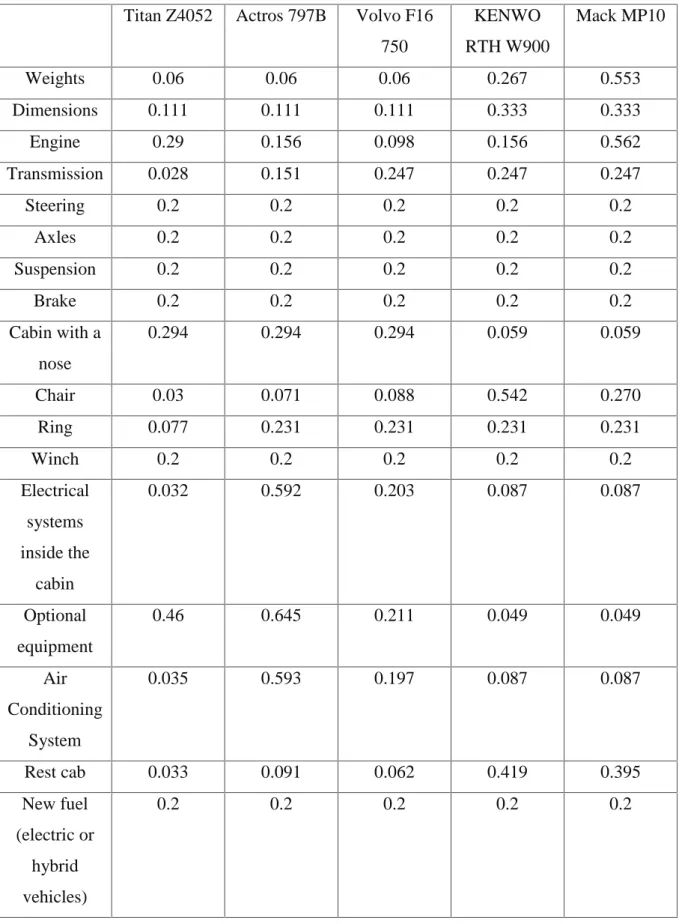
Table 12. Weight of each of the options compared to the sub-criteria
Mack MP10 KENWO RTH W900 Volvo F16 750 Actros 797B Titan Z4052 0.553 0.267 0.06 0.06 0.06 Weights 0.333 0.333 0.111 0.111 0.111 Dimensions 0.562 0.156 0.098 0.156 0.29 Engine 0.247 0.247 0.247 0.151 0.028 Transmission 0.2 0.2 0.2 0.2 0.2 Steering 0.2 0.2 0.2 0.2 0.2 Axles 0.2 0.2 0.2 0.2 0.2 Suspension 0.2 0.2 0.2 0.2 0.2 Brake 0.059 0.059 0.294 0.294 0.294 Cabin with a nose 0.270 0.542 0.088 0.071 0.03 Chair 0.231 0.231 0.231 0.231 0.077 Ring 0.2 0.2 0.2 0.2 0.2 Winch 0.087 0.087 0.203 0.592 0.032 Electrical systems inside the cabin 0.049 0.049 0.211 0.645 0.46 Optional equipment 0.087 0.087 0.197 0.593 0.035 Air Conditioning System 0.395 0.419 0.062 0.091 0.033 Rest cab 0.2 0.2 0.2 0.2 0.2 New fuel (electric or hybrid vehicles)
0.2 0.2 0.2 0.2 0.2 Autonomous vehicles (UAVs)
In the above table specify clearly that except where options have equal weights and except cabin with a nose sub-criteria, in all other cases, Titan vehicle has the lowest weight and importance. In engine performance sub-criteria that showed the most important sub-criteria of technical criteria according to Table 13, it can be seen that Mack MP1 vehicle has the highest weight and Titan vehicle assigned lowest weight to itself. In cabin with a nose sub-criteria that showed the most important sub-criteria of apparent criteria according to Table 13, Titan vehicle with equal weighting of the two other vehicles, has the highest weight. In all sub-criteria related to new technology sub-criteria, all options have equal weight because none of the options have not these sub-criteria.
Table 13. Weigh of options compared to the criteria
Mack MP10 KENWO RTH W900 Volvo F16 750 Actros 797B Titan Z4052 0.306 0.219 0.176 0.169 0.130 Technical 0.118 0.130 0.241 0.319 0.192 Apparent 0.2 0.2 0.2 0.2 0.2 New technologies
In Table 13 revealed that the technical criteria is the most important selection criterion, now we see in comparison of options compared to the technical criteria according to Table 14. Mack MP1 vehicle assigned the highest weight to itself and Titan assigned the lowest weight to itself. In the apparent criteria also Mercedes-Benz Actros 797B vehicle has the highest weight, it should be noted that Titan vehicle in apparent criteria has third rank. In new technologies criteria also because none of the vehicles have these technologies, all have equal criteria.
Table 14. Options weight compared to target Rank Weight Vehicle Row 5 0.153 Titan Z4052 1 4 0.185 Actros 797B 2 3 0.186 Volvo F16 750 3 2 0.210 KENWORTH W900 4 1 0.267 Mack MP10 5
As mentioned in the previous section, and is evident in Table 4-5, Titan vehicle has the last rank. This issue indicates that the technology of Titan vehicle behinds from many heavy tractors vehicles and is required to study in order to promote technology of this military tractors vehicles.
5-2- Technology lifecycle curve of Titan vehicle
By concluding the rank of Titan vehicle between heavy tractors vehicles, it can be concluded that if drawing technology lifecycle curve of Titan vehicle, this vehicle in its technology lifecycle curve is in its decline era.
Fig.9. Technology lifecycle curve of Titan vehicle
In the above curve, horizontal axis represents the time and vertical axis represents the Titan vehicle status in its lifecycle curve.
6-
CONCLUSIONAccording to the curve, Technology lifecycle of Titan vehicle that was displayed in previous chapter, it was concluded that Titan vehicle in its technology lifecycle curve is at the beginning of its decline era. Given that spending maturity era of technology can adopt different decisions but what is important is that, it should always pay attention to technology and new products offered by the leading manufacturers of heavy vehicles and examined them. Because the speed of technological progress is very fast. And whenever there is a possibility of the launch of products with new technologies. About Titan vehicle according to the technology lifecycle curve should be considered this issue that the technology of this vehicle because spending its maturity era is in decline era. Regarding the investigation of new technologies, we have to make changes in vehicle technology or finding alternative technology. As suggested in the decisions regarding technology of Titan vehicle, it can be argued that now due to the fact that the technology of this vehicle in terms of appearance, is declining, can be entered new technology both in terms of technical and appearance and new technologies and this new technology and products derived from them are used in the armed forces. In addition to the new products, studies need to be done on Titan vehicle and redesigned and produced in this vehicle in terms of appearance and with the same technical characteristics and also offered to the domestic market and markets of neighboring countries. It is worth noting that the study that will be done in the future to improve the technology of Titan vehicle, it is recommended that the weights of analytic hierarchy process, to be considered. In other words, according to the first priority of criteria, namely technical criteria, the vehicle should be taken to improve the technical, first, it must be action to improve technical improvements in vehicle, and also considering that the engine performance sub-criteria assigned the highest weight to itself, major studies must be done in order to improve Titan vehicle technology in terms of performance. For this purpose, it is necessary to check engine of heavy tractors to be selected the technology which can be used in Titan vehicle and leads to improvements in technology of Titan vehicle and was conducted in the near future we see the changes in technology lifecycle curve status of this vehicle.
7-
REFERENCESAhmad Bodla, Mahmood, Muhammad Musarrat Nawaz. "Comparative study of full range leadership model among faculty members in public and private sector higher education institutes and universities." International Journal of Business and Management 5.4 (2010): 208.
Dimitriades, Zoe S. "Creating strategic capabilities: organizational learning and knowledge management in the new economy." European Business Review 17.4 (2005): 314-324.
Ford, David, and Chris Ryan. "Taking technology to market." Harv. Bus. Rev.;(United States) 59.2 (1981).
Lee, Sungjoo, and Yongtae Park. "Customization of technology roadmaps according to roadmapping purposes: Overall process and detailed modules." Technological Forecasting and Social Change 72.5 (2005): 567-583.
Phaal, Robert, et al. "A framework for mapping industrial emergence." Technological Forecasting and Social Change 78.2 (2011): 217-230.
Schilling, Melissa A. "Mapping the Technological Landscape: Measuring Technology Distance, Technological Footprints, and Technology Evolution." (2016).
Twiss, Brian C. Forecasting for technologists and engineers: A practical guide for better decisions. No. 15. IET, 1992
Unido; Technology management in developing country, report, Vienna. Porter, Michael, E.(1985), competitive advantage, New York , free press, p.p. 166 – 169, 1989.
Yousefpour, G., 1996, Transfer of technology in the Third World and Iran, Tehran, Tandis publication, Tehran, Iran.
How to cite this article:
Soleimani G, Amiri M, Firouzabadi S M A K, Isfahani M J. Evaluating the development of life and progress of heavy vehicles based on analytical hierarchy process (AHP) in main subsystems. J. Fundam. Appl. Sci., 2016, 8(3), 1237-1257.