Contents lists available atScienceDirect
Environment International
journal homepage:www.elsevier.com/locate/envintPrenatal, concurrent, and sex-speci
fic associations between blood lead
concentrations and IQ in preschool Canadian children
☆
Mireille Desrochers-Couture
a,h, Youssef Oulhote
b, Tye E. Arbuckle
c, William D. Fraser
d,
Jean R. Séguin
e,f, Emmanuel Ouellet
a, Nadine Forget-Dubois
a,h, Pierre Ayotte
g, Michel Boivin
h,
Bruce P. Lanphear
i, Gina Muckle
a,h,⁎aCentre de recherche du Centre Hospitalier Universitaire de Québec, Québec, Canada
bDepartment of Environmental Health, Harvard T. H. Chan School of Public Health, Boston, MA, USA
cPopulation Studies Division, Environmental Health Science and Research Bureau, Healthy Environments and Consumer Safety Branch, Health Canada, Ottawa, Ontario,
Canada
dDepartment of Obstetrics and Gynecology, Université de Sherbrooke, Centre Hospitalier Universitaire de Sherbrooke, Québec, Canada eCHU Sainte-Justine Research Center, Mother and Child University Hospital Center, Montreal, Québec, Canada
fDepartment of Psychiatry, University of Montreal, Montreal, QC, Canada
gCentre de toxicologie du Québec, Institut national de santé publique du Québec, Québec City, Québec, Canada hÉcole de psychologie, Université Laval, Quebec, Québec, Canada
iFaculty of Health Sciences, Simon Fraser University, Vancouver, British Columbia, Canada
A R T I C L E I N F O
Handling Editor: Lesa Aylward Keywords:
Blood lead concentrations Sex differences Intelligence quotient Canadian children
A B S T R A C T
Background: Lead exposure predicts altered neurodevelopment and lower intelligence quotient (IQ) in children, but few studies have examined this association in children who have relatively low blood lead concentrations. Objectives: To test the associations between blood lead concentrations and cognitive function in Canadian preschoolers, with a possible moderation by sex.
Methods: The data were gathered from 609 mother-child pairs from the Maternal–Infant Research on Environmental Chemicals (MIREC) Study. Lead was measured in umbilical and maternal blood, and in children's venous blood at age 3–4 years. Cognitive function was measured with the Wechsler Preschool and Primary Scale of Intelligence (WPPSI-III) at 3–4 years. We tested the relationship between WPPSI-III scores and blood lead concentrations with multiple linear regression, adding child sex as a moderator.
Results: Median blood lead concentrations for the mother at 1st trimester and 3rd trimester of pregnancy, and for cord and child blood were 0.60μg/dL, 0.58 μg/dL, 0.79 μg/dL and 0.67 μg/dL, respectively. We found no as-sociation between cord blood lead concentrations and WPPSI-III scores in multivariable analyses. However, cord blood lead concentrations showed a negative association with Performance IQ in boys but not in girls (B = 3.44; SE = 1.62; 95% CI: 0.82, 5.98). No associations were found between WPPSI-III scores and prenatal maternal blood or concurrent child blood lead concentrations.
Conclusions: Prenatal blood lead concentrations below 5μg/dL were still associated with a decline in cognitive function in this Canadian cohort, but only for boys.
1. Introduction
Prenatal and postnatal blood lead concentrations have been asso-ciated with many developmental problems such as low birth weight,
intellectual deficits, diminished academic performance, attention defi-cits, and behavioral problems (NTP, 2012; Needleman and Gatsonis, 1990). Since 1970, the Canadian government has enforced rules aimed at reducing lead exposure from its main sources, (e.g. leaded gasoline,
https://doi.org/10.1016/j.envint.2018.10.043
Received 14 June 2018; Received in revised form 19 October 2018; Accepted 21 October 2018
☆The authors declare that they have no actual or potential competingfinancial or non-financial interests in the subject matter or materials discussed in this manuscript.
⁎Corresponding author at: School of Psychology, Laval University, 1050, Chemin Sainte-Foy, Local JS1-26, Québec G1S 4L8, Canada. E-mail addresses:Mireille.desrochers-couture@crchudequebec.ulaval.ca(M. Desrochers-Couture),youlhote@hsph.harvard.edu(Y. Oulhote), Tye.Arbuckle@canada.ca(T.E. Arbuckle),william.fraser@umontreal.ca(W.D. Fraser),jean.seguin@umontreal.ca(J.R. Séguin),
Emmanuel.Ouellet@crchudequebec.ulaval.ca(E. Ouellet),Nadine.Forget-Dubois@psy.ulaval.ca(N. Forget-Dubois),pierre.ayotte@inspq.qc.ca(P. Ayotte), Michel.Boivin@psy.ulaval.ca(M. Boivin),bpl3@sfu.ca(B.P. Lanphear),gina.muckle@crchudequebec.ulaval.ca(G. Muckle).
Available online 02 November 2018
0160-4120/ © 2018 Published by Elsevier Ltd.
water pipes, lead-based paints, solder in food cans; Health Canada, 2013a). These measures led to dramatic reductions in the average blood lead levels in Canadians over three decades. The Canada Health Survey, conducted in 1978 and 1979, showed a mean blood lead concentrations of 4.79μg/dL in people aged 6 to 79 years; by 2010, the mean blood lead concentrations had dropped to 1.34μg/dL (Bushnik et al., 2010). Today, the main sources of exposure in childhood are lead-con-taminated paint chips, house dust, and soil (Health Canada, 2013a).
Lead exposure reduction was a public health success, and yet a number of epidemiological studies have raised the alarm regarding developmental neurotoxicity at very low blood lead concentrations. A lower intelligence quotient (IQ) score in the presence of increasing blood lead levels has been observed even at low concentrations of < 5μg/dL (Hong et al., 2015;Huang et al., 2012;Jian et al., 2014; Jusko et al., 2008;Lanphear et al., 2000, 2005;Miranda et al., 2007; Skerfing et al. 2015). Negative associations with children's IQ were reported at concentrations of 2μg/dL or lower in children younger than 11 years (Canfield et al., 2003;Chiodo et al., 2007, 2004;Hong et al., 2015; Miranda et al., 2007), but not systematically (Surkan et al., 2007). Most importantly, scientists and many public health authorities recognize that no safe threshold for blood lead concentrations can be determined at this point (ATSDR, 2007;CDC, 2012;NTP, 2012).
The toxicity of blood lead concentrations during childhood is documented, although associations between prenatal blood lead con-centrations and later neurodevelopmental domains, such as IQ, atten-tion, and behavioral problems, are less well established. For example, only a few epidemiological studies include data that document the as-sociation of prenatal blood lead concentrations with any aspect of child development. Furthermore, timing of blood sampling in pregnancy is not consistent across studies: some measured maternal blood con-centrations as an indicator of prenatal exposure (Hu et al., 2006;Kim et al., 2013;Schnaas et al., 2006; Shah-Kulkarni et al., 2016; Taylor et al., 2017; Zhou et al., 2017), whereas others relied on cord blood (Boucher et al., 2014;Ethier et al., 2015;Jedrychowski et al., 2009b; Jian et al., 2014). Moreover, most of the studies were prospective and almost half bear on highly exposed groups, such as Inuit infants from Nunavik in Northern Canada (Boucher et al., 2014;Ethier et al., 2015), or children from Mexico City (Hu et al., 2006;Schnaas et al., 2006). It is thus hard to extrapolate these studies'findings to children with lower blood lead concentrations drawn from the general population of southern Canada.
In addition, recent epidemiological studies indicate sex differences in associations between neuropsychological development indicators and lead exposure. In prenatal exposure studies, boys were significantly more affected than girls for IQ, attention/concentration, and visuo-constructional skills (Jedrychowski et al., 2009a;Ris et al., 2004), or showed a similar trend (Taylor et al., 2017). Some childhood exposure studies have shown a heightened association in boys compared to girls in attention/concentration and in visual-motor performance (Ris et al., 2004; Vermeir et al., 2005), whereas others observed the reverse as-sociation, showing a more prominent IQ decline in girls (Baghurst et al., 1992;Tong et al., 2000). Furthermore, many of the studies looking at the potential effect of blood lead on childhood outcomes included sex as a control variable rather than as a moderation term. Consequently, sex differences in vulnerability remain largely unreported, even though male fetuses have frequently been recognized as more vulnerable (Dipietro and Voegtline, 2017).
Overall, the vulnerability of preschool children is clear, but the specific impact of postnatal blood lead concentrations < 5 μg/dL on child's cognitive function is not, and evidence is particularly scarce concerning the impact of prenatal exposures at concentrations found in a typical Western population. Furthermore, the scarce and contra-dictory evidence regarding sex differences in the association between cognitive development and lead exposure needs further investigation in preschool children exposed to the low levels experienced by the general Canadian population.
The aim of this paper was therefore to test the associations between gestational and early childhood blood lead concentrations with in-tellectual function in preschool Canadian children. We also tested for the moderation of these associations by sex of the child.
2. Methods
2.1. Study design and population
The Maternal–Infant Research on Environmental Chemicals (MIREC) Study, which follows longitudinally a pregnancy and birth cohort, was designed to investigate the negative health consequences of environmental contaminants on pregnancy and child health (Arbuckle et al., 2013). A total of 2001 women were recruited between 2008 and 2011 during theirfirst trimester of pregnancy at 10 study sites within Canada. An inability to communicate and consent in either French or English, having completed > 14 weeks of pregnancy, an age under 18, illegal drug consumption, a diagnosis of a fetal anomaly or a history of severe disease, or planning to deliver outside of the participating hos-pitals were exclusion criteria at recruitment. The subsample that is part of the present analyses was composed of the mothers who participated in MIREC-CD Plus; this follow-up study (N = 610 children) was con-ducted when the target child reached the age of 3 to 4 years. Data collection relied on one visit (at home or hospital at parents' con-venience) aimed at obtaining direct assessment of growth and neuro-behavioral development as well as child's blood and other biological samples. The mother also filled a questionnaire assessing socio-economic, educational, and lifestyle elements. Additional inclusion criteria for the present analyses were a singleton birth after 28 weeks of gestation or more, and the completion of the intellectual function tests. We excluded children who were born before 28 weeks gestation to minimize the confounding effect of extremely preterm birth (WHO, 2017), which can include neurodevelopmental delays.
Ethics approval for the study was obtained from Health Canada's Research Ethics Board and from the ethics committees of the hospitals and research centers involved in the study. All participants received information about the aims of the study, and signed an informed con-sent form.
2.2. Intellectual function
We administered the Wechsler Preschool and Primary Scale of Intelligence–3rd Edition, short version (WPPSI-III; Wechsler, 2002) designed for children aged between 2 years, 6 months and 3 years, 11 months. Completion of thefive subtests (Block Design, Object As-sembly, Receptive Vocabulary, Information, and Picture Naming) takes about 35 min and assesses verbal comprehension as well as perceptual organization abilities. A trained research assistant unaware of children's exposure to environmental contaminants administered the test either in English or in French. The age-standardized WPPSI-III Canadian norms were used to calculate the Composite Verbal, Performance, General Language and Full-Scale IQ scores.
2.3. Lead exposures
As the most appropriate prenatal blood lead measure to use in in-vestigating associations with child neurodevelopment is not clear (Baghurst et al., 1987;Hu et al., 2006;Schnaas et al., 2006), we ex-amined both maternal and cord blood lead concentrations in our study to document exposure during fetal development. Maternal blood lead concentrations were measured at the 1st trimester (6–13 weeks) and 3rd trimester (32–34 weeks; see Supplemental material, Tables S1 and S2. These tables are discussed in detail under Multivariable linear analysis), and an umbilical cord blood sample was collected at birth. Body burden at age 3–4 years was analyzed from a venous blood sample.
All blood samples were analyzed using inductively coupled plasma mass spectrometry (PerkinElmer ELAN ICP-MS DRC II) at the Centre de Toxicologie, Institut National de Santé Publique du Québec; (Quebec City, QC, Canada), which has an accreditation of the Standards Council of Canada. The limit of detection (LOD) for both 1st and 3rd trimester blood lead concentrations was 0.1μg/dL. The proportion of samples below the LOD for the 1st and for 3rd trimesters was 0% and 0.2%, respectively. The LOD for both child and cord blood lead concentrations using this method were 0.1μg/dL and 0.21 μg/dL, depending on available blood volume. The proportion of samples < LOD were re-spectively 1.6% and 0% for cord and child blood samples. Concentrations < LOD were replaced by the value LOD/√2 (Hornung and Reed, 1990).
2.4. Covariates and potential confounders
The mothers reported on her marital status, household income, education, parity, and ethnicity during the first-trimester visit inter-view. Current smoking and alcohol consumption were documented at first and third trimester of pregnancy. Prenatal and postnatal total mercury concentrations were considered as potential confounders based on previous associations with neurotoxic effects in prospective cohort in Northern Canada, Faroe Island and in the U.S. (Debes et al., 2016; Jacobson et al., 2015;Oken et al., 2008). Mercury blood con-centrations were analyzed using the same laboratory technique as lead concentrations (LOD for cord blood mercury = 0.012μg/dL; LODs for child blood mercury = 0.05μg/dL or 0.06 μg/dL depending on vo-lume). Birth weight, gestational age, pre-pregnancy BMI, and other perinatal characteristics were extracted from medical records. During a follow-up when the child was 6 months, breastfeeding and socio-demographic status were assessed by way of a self-administered ques-tionnaire to the mother. At the MIREC CD plus follow-up (3–4 years), the mother answered the Center for Epidemiological Studies Depression Scale (CES-D; Radloff, 1977), and the Parenting Stress Index (Short Form; Abidin, 1995). The latter assesses the parent's expectations, whether they are fulfilled as well as interactions with the child. The same research assistant who administered the WPPSI-III completed the Home Observation for Measurement of the Environment (HOME; Caldwell and Bradley, 2001), which assesses the quality of stimulation and support that the child enjoys at home.
We selected likely confounding factors according to their published association with neurodevelopment and lead exposure in children. We first retained covariates associated with either cord or child blood lead concentrations and with Full-Scale IQ at p < 0.20 (see Supplemental material, Table S3). Of these, all confounding factors considered outside of the hypothetical causal pathway and associated with each other at r≤ 0.30 were kept in the analyses. We included evaluation site as a covariate to control for any site variance, such as administration of the WPPSI-III by different examiners. Additionally, child sex and age at time of testing were included in all models.
2.5. Statistical analysis
Descriptive statistics and patterns of missing data analyses were done with IBM SPSS 23.0 for Windows (IBM, Chicago, IL, USA). Regression models were tested with Mplus 6.1 (Muthén and Muthén, 1998–2011). Significance level was set at p < 0.05 (two-tailed). Homoscedasticity and normality of residuals were investigated visually while variance inflation factor tests were used to assess multi-collinearity assumptions. Mahalanobis's distance was used to spot multivariate outliers. All models were run with and without multi-variate outliers, without any notable alteration of the results (data available upon request). The multivariate outliers were thus retained in all analyses.
2.5.1. Missing data
We explored the data using SPSS Missing Values Analysis (MVA) to assess potential patterns in missing values. The proportion of missing data ranged from 0% to 34.8% (blood lead concentrations at 3–4 years). Little's MCAR test (Little, 1988) showed that the values could not be considered missing completely at random (MCAR; χ2= 734.98, p = 0.002), but no suggestion of systematic bias emerged from the examination of missing data patterns (from corrected t-tests obtained in SPSS MVA that compared the missing vs available mean scores of each measure with all other measures). Therefore, we treated the data as missing at random (MAR). The proportion of missing data being rela-tively important, we chose to test the regression models with a full-information maximum likelihood (FIML) estimator. FIML, the default estimator in Mplus, let us keep all the available data instead of re-stricting the analyses to complete cases only (Graham, 2009), and re-quires only an assumption of MAR data.
2.5.2. Univariate and bivariate analysis
We investigated the means, variances, and distribution of each variable. All exposure variables were log2-transformed to reduce skewness. We then assessed bivariate associations between all the variables before their inclusion in the multivariable models, excluding the potential confounders that did not meet our criteria in the process. 2.5.3. Multivariable regression models
First, we tested multiple linear regressions with an FIML estimator to assess the associations between cord and child blood lead con-centrations and each WPPSI-III score separately. We adjusted for the corresponding confounders in each blood lead concentrations models (Table 3). Models using 1st and 3rd trimester blood lead concentrations included the same covariates as the one included in the cord blood lead model. Second, a moderation term (child sex × blood lead concentra-tions) was added to the corresponding model while controlling for the same covariates. Unstandardized regression coefficients were reported for both moderation tests and effect modifications by gender (Table 4). All models with 1st and 3rd trimester blood lead concentrations can be seen in Supplemental material, Tables S1 and S2.
3. Results
3.1. Child characteristics
We excluded one child who was born at gestational age < 28 weeks. Venous blood samples were unavailable for 212 children. The char-acteristics of the children and their mothers, and the sample size (N) for each variable, are presented in Table 1. Our sample included pre-dominantly white and non-smoking women and most (96.2%) were married or living with a partner. On average, mothers were age 32 years at delivery, and about 40% of the families reported an income at 1st trimester of $100,000 CAD or more per year, over the Canadian median of $84,080 (Statistics Canada, 2013). Cord and child blood lead con-centrations were well below the 2013 Canadian threshold of action (10μg/dL), with a median ranging from 0.67 μg/dL to 0.79 μg/dL. The mean of both cord and child blood lead concentrations did not differ between boys and girls (Table 2), and neither did the maternal blood lead concentrations at 1st or 3rd trimester (see Supplemental material, Table S4). The WPPSI-III score means ranged from 103 to 109.5. A significant difference was observed between boys' and girls' Full-Scale IQ average (104.2 points vs. 109.5 points, respectively; see Supple-mental material, Table S5).
3.2. Unadjusted associations between blood lead concentrations, IQ, and covariates
We computed Pearson correlations to document associations be-tween variables included in our analyses (results not shown). Full-Scale
IQ was not significantly associated with cord or child blood lead con-centrations (r =−0.036, p = 0.422 and r = −0.081, p = 0.108, re-spectively). As expected, the correlation between cord and concurrent blood lead concentrations was significant, but weak (r = 0.189,
p = 0.001). Mothers' educational achievement as well as the HOME score were positively associated with Full-Scale IQ. Children from poorer families had higher blood lead concentrations during childhood (see Supplemental material, Table S3). Concordantly with our con-founders selection method, gestational age was positively correlated with both the Full-Scale IQ and cord blood lead concentrations at p < 0.20 (r = 0.087, p = 0.033 and r = 0.059, p = 0.193, respec-tively) but was not included in the prenatal concentrations models since it was in the causal pathway. Additionally, only 2.8% of the mothers were smoking tobacco during their 1st trimester of pregnancy; maternal smoking was therefore excluded as a covariate for lack of variance. Pre-pregnancy BMI variable was associated with Full-Scale IQ, but not with both cord and child blood lead concentrations, and therefore not re-tained as a confounding factor. Overall, the bivariate associations ob-served within our sample are comparable with those found in other epidemiological studies conducted in a general population.
3.3. Multiple linear relationships between IQ and blood lead concentrations We tested the associations between both cord and child blood lead concentrations and WPPSI-III with confounder-adjusted multiple re-gression models. We found no significant association between cord blood or child blood lead concentrations and any of the WPPSI-III scores (Table 3), nor between the 1st or 3rd trimester blood lead con-centrations and the WPPSI-III scores (see Supplemental Material, Table S1).
3.4. Effect modification by sex
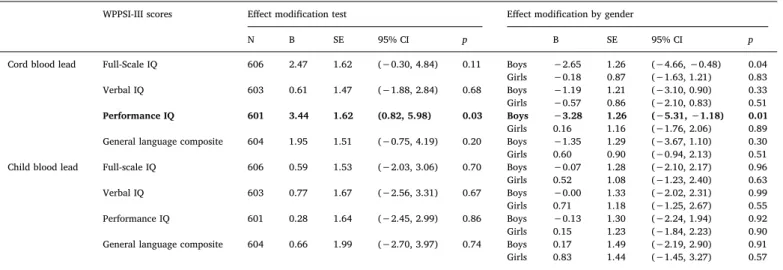
To assess a potential difference by sex in the association between both cord and child blood lead concentrations with IQ scores, we in-cluded a moderation term (child sex × blood lead concentrations) in the corresponding multiple regression models (Table 4). We observed a significant moderation by sex of the association between cord blood lead concentrations and Performance IQ score, indicating that a stronger association in boys than in girls (unstandardized B coeffi-cient = 3.44, SE = 1.62; 95% CI: 0.82, 5.98;Fig. 1). A significantly steeper negative slope was observed for boys (unstandardized B coef-ficient = −3.28, SE = 1.26; 95% CI: –5.31, −1.18) while a non-sig-nificant slope was observed for girls (unstandardized B coeffi-cient = 0.16, SE = 1.16; 95% CI:–1.76, 2.06). A significantly negative slope was observed for boys on the Full-Scale IQ, but the moderation by sex did not reach significance in the full model (Table 4). Additionally, a marginally significant moderation by sex was observed in the asso-ciation between 1st trimester blood lead concentrations and General Language Composite score (see Supplemental material, Table S2). However, neither the slope for boys or girls were significant (95% CI: –0.31, 3.68 and 95% CI: –3.14, 0.56, respectively), therefore not jus-tifying the interpretation of this result. No other differential association by sex was observed between either prenatal or concurrent blood lead concentrations and the WPPSI-III scores or 1st or 3rd trimester blood lead concentrations (see Supplemental material, Table S2). Therefore, child sex only moderated the association between cord blood lead concentrations and Performance IQ score, an association that was only significant in boys.
Table 1
Descriptive statistics.
Characteristics N Mean ± SD or n (%)
Median Range IQR
Children
Age (years) 609 3.4 ± 0.3 3.3 3.0–4.0 0.6 Sex (female) 609 312 (51.2)
Birth weight (kg) 609 3.5 ± 0.5 3.5 1.4–5.1 0.6 Gestational age (weeks) 609 39.5 ± 1.5 39.7 29.4–42.4 1.9 Breastfeeding status 551 No breastfeeding 47 Breastfeeding < 3 months 56 (10.2) Breastfeeding 3–6 months 80 (14.5) Breastfeeding > 6 months 415 (75.3) Family environment
Maternal age at delivery (years) 609 32.6 ± 4.6 32.0 18.0–46.0 6.0 Parity 609 0 265 (43.5) 1 252 (41.4) ≥2 92 (15.1)
Marital status at follow-up
609 Married/same partner
during previous year
586 (96.2) Other 23 (3.8) Maternal education at
follow-up
607 High school diploma or
less
54 (8.9) College or trade school 147 (24.2) University– undergraduate 243 (40.0) University– graduate 163 (26.9) Income at follow-up 589 ≤$50,000 92 (15.6) $50001–80,000 145 (24.6) $80001–100,000 117 (19.9) ≥$100,001 235 (39.9) Ethnicity (White) 609 521 (85.6)
HOME total score 591 47.3 ± 4.3 48.0 27.0–55.0 5.0 Parenting stress index at
follow-up
593 16.3 ± 4.6 15.0 12.0–47.0 5.0 ≥23 66 (11.1)
Lead and mercury exposures [geometric mean (GSD)] Lead (μg/dL) 1st trimester 598 0.62 ± 1.6 0.60 0.16–4.14 0.40 3rd trimester 556 0.59 ± 1.7 0.58 0.14–3.93 0.39 Cord blood 493 0.76 ± 1.7 0.79 0.08–3.52 0.46 Child blood 397 0.70 ± 1.7 0.67 0.14–5.49 0.51 Mercury (μg/dL) Cord blood 492 0.78 ± 2.4 0.77 0.09–8.83 1.16 Child blood 397 0.23 ± 2.9 0.20 0.07–5.82 0.44 Other prenatal exposures
Tobacco smoke 1st trimester (yes) 609 17 (2.8) Alcohol 1st trimester (yes) 608 261 (42.9) WPPSI-III Full-scale IQ 606 107.0 ± 13.5 108.0 51.0–143.0 19.0 Verbal IQ 603 109.5 ± 13.2 111.0 58.0–144.0 19.0 Performance IQ 601 103.0 ± 14.8 103.0 55.0–144.0 18.0 General language composite 604 108.5 ± 14.6 108.0 57.0–147.0 17.0
Abbreviations: GSD, geometric standard deviation; IQR, Interquartile range; HOME, Home Observation for Measurement of the Environment (Caldwell and Bradley, 2001); Parenting Stress Index (Abidin, 1995); WPPSI-III, Wechsler Preschool and Primary Scale of Intelligence– 3rd Edition (Wechsler, 2002).
Table 2
Sex difference for blood lead concentrations.
Blood lead measures Boys Girls M SE M SE df t p Cohen's d Cord 0.874 0.426 0.853 0.455 491 0.943 0.346 0.085 Child 0.853 0.593 0.801 0.499 395 1.013 0.312 0.102
4. Discussion
The main objective of this study was to test for associations between prenatal and postnatal blood lead concentrations and intellectual function in a Canadian cohort of 3- to 4-year-old children. We also tested for effect modification by sex of these associations. We observed no significant main effect of cord blood lead concentrations on in-tellectual function measures. However, we observed a sex-linked effect modification: cord blood lead concentrations were negatively and sig-nificantly associated with Performance IQ only for boys. No such as-sociations with any measure of cognitive functioning at 3–4 years were found for lead concentrations in maternal blood during the 1st or 3rd trimesters of pregnancy, or for concurrent child blood lead concentra-tions.
4.1. Postnatal lead exposures and sex differences
Currently, no safe level of blood lead concentrations can be inferred from study data regarding children's intellectual function or any other aspect of their development (Santa Maria et al., 2018). Associations between child blood lead concentrations as low as 1–2 μg/dL and poorer cognitive function were observed (Canfield et al., 2003;Chiodo et al., 2007, 2004;Hong et al., 2015;Miranda et al., 2007). However, uncertainty remains regarding associations observed at these levels (Health Canada, 2013b). The geometric mean blood lead concentra-tions in children aged 3 to 4 years in this paper was 0.7μg/dL, and ranged from 0.14 to 5.49μg/dL. When compared with France's 2.5 μg/ Table 3
Standardized regression coefficients of cord or child blood lead concentrations predicting preschoolers' intellectual function.
Cord blood lead concentrations Child blood lead concentrations
N β 95% CI p β 95% CI p
Full-scale IQ 606 −0.070 (−0.143, 0.003) 0.115 0.014 (−0.071, 0.098) 0.791 Verbal IQ 603 −0.048 (−0.119, 0.024) 0.272 0.021 (−0.066, 0.107) 0.695 Performance IQ 601 −0.068 (−0.142, 0.005) 0.128 0.001 (−0.081, 0.084) 0.979 General language composite 604 −0.013 (−0.085, 0.060) 0.775 0.027 (−0.057, 0.111) 0.601
Abbreviations:β, standardized regression coefficient; CI, confidence intervals. Cord blood model adjusted for child age, child sex, maternal education, evaluation site and cord blood mercury (log-2 scale). Child blood model adjusted for child age, child sex, evaluation site, marital status, familial income, HOME total score, Parenting Stress Index, and cord blood lead (log-2 scale).
R2[0.12–0.20].
Table 4
Effect modification between cord or child blood lead concentrations and child sex predicting preschoolers' intellectual function.
WPPSI-III scores Effect modification test Effect modification by gender
N B SE 95% CI p B SE 95% CI p
Cord blood lead Full-Scale IQ 606 2.47 1.62 (−0.30, 4.84) 0.11 Boys −2.65 1.26 (−4.66, −0.48) 0.04 Girls −0.18 0.87 (−1.63, 1.21) 0.83 Verbal IQ 603 0.61 1.47 (−1.88, 2.84) 0.68 Boys −1.19 1.21 (−3.10, 0.90) 0.33 Girls −0.57 0.86 (−2.10, 0.83) 0.51 Performance IQ 601 3.44 1.62 (0.82, 5.98) 0.03 Boys −3.28 1.26 (−5.31, −1.18) 0.01 Girls 0.16 1.16 (−1.76, 2.06) 0.89 General language composite 604 1.95 1.51 (−0.75, 4.19) 0.20 Boys −1.35 1.29 (−3.67, 1.10) 0.30 Girls 0.60 0.90 (−0.94, 2.13) 0.51 Child blood lead Full-scale IQ 606 0.59 1.53 (−2.03, 3.06) 0.70 Boys −0.07 1.28 (−2.10, 2.17) 0.96 Girls 0.52 1.08 (−1.23, 2.40) 0.63 Verbal IQ 603 0.77 1.67 (−2.56, 3.31) 0.67 Boys −0.00 1.33 (−2.02, 2.31) 0.99 Girls 0.71 1.18 (−1.25, 2.67) 0.55 Performance IQ 601 0.28 1.64 (−2.45, 2.99) 0.86 Boys −0.13 1.30 (−2.24, 1.94) 0.92 Girls 0.15 1.23 (−1.84, 2.23) 0.90 General language composite 604 0.66 1.99 (−2.70, 3.97) 0.74 Boys 0.17 1.49 (−2.19, 2.90) 0.91 Girls 0.83 1.44 (−1.45, 3.27) 0.57
Abbreviations: B, unstandardized regression coefficient; SE, standard error; CI, confidence intervals. Cord blood model adjusted for child age, child sex, maternal education, evaluation site and cord blood mercury (log-2 scale). Child blood model adjusted for child age, child sex, evaluation site, marital status, familial income, HOME total score, Parenting Stress Index, and cord blood lead (log-2 scale).
R2[0.22–0.29]; Bootstrap = 1000.
Fig. 1. Association of cord blood lead concentrations with Performance IQ score moderated by child sex.
Abbreviations: SD, standard error. IQ test performance as determined by the WPPSI-III is shown on the Y axis, while cord blood lead concentrations are shown on the x axis, on a log-2 scale. The results for boys are shown by the solid line, while those for girls are denoted by the dashed line. Model included the following confounders: child age, child sex, maternal education at 1st trimester, evaluation site, cord blood mercury (log-2 scale).
dL level of vigilance (HCSP, 2014), no more than 1.5% of children showed concentrations above this threshold. Further comparison with similar studies that reported significant associations with cognitive development confirmed that our study's children experienced com-paratively low lead exposure: the children's average blood lead con-centrations in these other studies ranged from 2.48μg/dL to 4.5 μg/dL (Huang et al., 2012;Jian et al., 2014;Miranda et al., 2007), and life-time average blood lead concentrations at age 3 and 5 were 7.2μg/dL and 7.7μg/dL, respectively (Canfield et al., 2003;Jusko et al., 2008). Associations between lead levels and children's cognitive function in our sample might therefore have been subtler than we could detect.
In addition to studying children with higher blood lead concentra-tions, previous studies have assessed cognitive function or academic achievement later in childhood (Hong et al., 2015;Huang et al., 2012; Jusko et al., 2008; Lanphear et al., 2000; Miranda et al., 2007; Skerfving et al., 2015); only two reported significant associations with cognitive function in children aged < 5 years and blood lead con-centrations below 5μg/dL (Canfield et al., 2003; Jian et al., 2014). However, both of them reported blood lead concentrations over four times higher than those in the MIREC cohort, and one of them had a sample of low socioeconomic status and measured IQs lower than the national average (Canfield et al., 2003). Higher concentrations of lead in poorer neighborhoods make it harder to untangle the effects of each on child cognitive development (Beckley et al., 2017). In the same way, animal-model studies have shown that lead exposure effects are di-minished or absent among rodents in an enriched and stimulating en-vironment (Guilarte et al., 2003;Schneider et al., 2001). Knowing that the MIREC cohort includes children from predominantly middle- to upper middle-class families, the associations with lead exposure in our study may have been attenuated by the high-quality stimulation at home demonstrated by the high HOME scores reported (Table 1). These divergences in sample characteristics could therefore explain the in-consistencies in different studies' results.
Moreover, previous studies published inconsistent results regarding sex effect modification of lead exposure. Some studies have shown stronger associations with postnatal lead exposure in boys for atten-tion/concentration and for visual-motor performance (Ris et al., 2004; Vermeir et al., 2005), whereas others found a more marked IQ decline in girls (Baghurst et al., 1992; Tong et al., 2000). In our study, the association between concurrent blood lead concentrations and the WPPSI-III scores did not vary as a function of the children's sex. Con-tradictory results could be explained by several factors (Llop et al., 2013), such as the timing of blood lead measures and child age at testing, the heterogeneity in the neurodevelopmental domains eval-uated (IQ, attention and concentration, executive function, and memory), and publication biases against the publication of studies with statistically non-significant results.
4.2. Prenatal lead exposures and sex differences
We initially observed no main effect of maternal or cord blood lead concentrations on children's cognitive function. Three studies with median blood lead concentrations comparable with ours– ranging from 0.93 to 3.41μg/dL – and that had similar sample size found significant associations between at least one measure of prenatal blood lead con-centrations and children's IQ during infancy (Jedrychowski et al., 2009b;Kim et al., 2013;Shah-Kulkarni et al., 2016) while one did not (Taylor et al., 2017). However,Taylor et al. (2017)found a significant effect modification by sex, showing evidence of a significant positive association for IQ at age 8 years in girls and a negative trend in boys, therefore not significant. Effect modification by sex was not in-vestigated in the three others, or not reported.
In spite of the absence of main effect, a negative association be-tween cord blood lead concentrations and Performance IQ score was observed in boys, but not in girls, suggesting that boys could be more vulnerable than girls. A similar sex modification was marginally
significant for the Full-Scale IQ, which could be due to the inclusion of Performance IQ in the Full-Scale IQ score. Our result are consistent with earlier studies that have examined sex effect modification between prenatal lead exposures and children's development, by showing an increased negative association in boys (Jedrychowski et al., 2009a;Ris et al., 2004) or a similar trend (Taylor et al., 2017). There is indeed converging evidence that male fetuses are more vulnerable than female ones (Dipietro and Voegtline, 2017). Stronger associations in males were reported in animal studies between prenatal lead concentrations and various abilities, such as observed impaired spatial learning (Yang et al., 2003), emotional reactivity (de Souza Lisboa et al., 2005), and reduced motor responses (Leasure et al., 2008). These sex-related dif-ferences in susceptibility could arise from different developmental trajectories, different timing of exposure over gestation, and different hormonal milieu (Brummelte, 2017; Dipietro and Voegtline, 2017; Vahter et al., 2007). One possible explanation involves the protective effect of estrogen and its interaction with other neurotransmitters (Vahter et al., 2007). The female fetus shows a larger distribution of estrogen receptors; therefore, the smaller distribution and lower density of estrogen receptors in male fetuses might result in a lessened pro-tective effect (Jedrychowski et al., 2009a;Vahter et al., 2007).
Recently,Chau et al. (2017)have suggested differences in genetics and epigenetics as possible explanation for these effects modification by sex, but the underlying mechanisms remain largely unknown. More-over, several previous studies have found associations with maternal blood lead concentrations and not with cord blood concentrations, and there is still no consensus about the best biomarker of prenatal ex-posure; a specific association with cord rather than maternal blood lead concentrations could reflect the negative influence of lead on the transfer of essential elements such as calcium to the fetus (Lafond et al., 2004). However, why male fetuses should be more affected remains unclear. Further epidemiological studies considering sex as a modera-tion factor instead of as a covariate are needed to untangle the results presently observed in prenatal studies investigating blood lead con-centrations and children's development (Brummelte, 2017;Dipietro and Voegtline, 2017).
4.3. Limitations
One of the key limitations of our study is the short duration of follow-up. Several studies observed significant lead association with child development only later, at school age. A 3- or 4-year follow-up might not be sufficient to show the adverse consequences of lead ex-posure (Lanphear, 2015). Second, although we could account for many confounders in our analyses, we were not able to control for maternal IQ, which is a strong predictor of child IQ. Instead, we used maternal education and familial income as surrogate measures. Overall, observed discrepancies with other studies of concurrent blood lead concentra-tions and child IQ are likely attributable to substantial differences in the distribution of blood lead concentrations, as well as relatively privi-leged participants in the MIREC cohort. Thus, our results may not be generalizable to vulnerable groups.
4.4. Strengths
The main strengths of this paper are its longitudinal design that allowed for the finding of an association between prenatal lead ex-posure and cognitive function in preschool boys, its extensive data on potential confounders, multiple lead exposure metrics, and its relatively large sample size in comparison to other investigations. Data on mo-thers and children were collected from thefirst trimester of pregnancy throughout the child preschool years. Furthermore, the WPPSI-III is considered as one of the best assessment of intellectual function avail-able for children.
5. Conclusion
Our study highlights that Canadian preschoolers from mainly middle- to upper-middle class families are exposed to particularly low levels of lead, and that their IQ was not associated with concurrent blood lead concentrations. However, prenatal lead concentrations (as measured in cord blood) were negatively associated with Performance IQ, although thisfinding applied only to boys. To our knowledge, this is thefirst study reporting that cord lead concentrations below < 5 μg/dL is associated with IQ in middle-to upper-middle class family preschool children. Further studies should aim to clarify sex-related differences. Acknowledgments
The authors thank the MIREC participants, the site investigators and the staff at the coordinating center and each recruitment site for their contributions to the MIREC Studies.
Funding sources
This work was supported by the Chemicals Management Plan of Health Canada, with funding from the Canadian Institutes of Health Research (grant # MOP–81285) and the Ontario Ministry of the Environment.
Appendix A. Supplementary data
Supplementary data to this article can be found online athttps:// doi.org/10.1016/j.envint.2018.10.043.
References
Abidin, R.R., 1995. Parenting Stress Index, 3rd ed. Psychological Assessment Resources, Inc., Odessa, FL.
Arbuckle, T.E., Fraser, W.D., Fisher, M., Davis, K., Lian, C.L., Lupien, N., et al., 2013. Cohort profile: the maternal-infant research on environmental chemicals research platform. Paediatr. Perinat. Epidemiol. 27, 415–425.https://doi.org/10.1111/ppe. 12061.
ATSDR (Agency for Toxic Substances and Disease Registry), 2007. Toxicological profile for lead. Available.http://www.atsdr.cdc.gov/toxprofiles/tp.asp?id=96&tid=22, Accessed date: 6 April 2017.
Baghurst, P.A., McMichael, A.J., Vimpani, G.V., Robertson, E.F., Clark, P.D., Wigg, N.R., 1987. Determinants of blood lead concentrations of pregnant women living in Port Pirie and surrounding areas. Med. J. Aust. 146 (2), 69–73.https://doi.org/10.1056/ NEJM19 9210293271805.
Baghurst, P.A., McMichael, A.J., Wigg, N.R., Vimpani, G.V., Robertson, E.F., Roberts, R.J., et al., 1992. Environmental exposure to lead and children's intelligence at the age of seven years: the Port Pirie Cohort Study. N. Engl. J. Med. 327, 1279–1284.https:// doi.org/10.1056/NEJM199210293271805.
Beckley, A.L., Caspi, A., Broadbent, J., Harrington, H., Houts, R.M., Poulton, R., et al., 2017. Association of childhood blood lead levels with criminal offending. JAMA Pediatr. 172 (2), 166–173.https://doi.org/10.1001/jamapediatrics.2017.4005. Boucher, O., Muckle, G., Jacobson, J.L., Carter, R.C., Kaplan-Estrin, M., Ayotte, P., et al.,
2014. Domain-specific effects of prenatal exposure to PCBs, mercury, and lead on infant cognition: results from the environmental contaminants and child develop-ment study in Nunavik. Environ. Health Perspect. 122, 310–316.https://doi.org/10. 1289/ehp.1206323.
Brummelte, S., 2017. Introduction: early adversity and brain development. Neuroscience 342, 1–3.https://doi.org/10.1016/j.neuroscience.2016.09.041.
Bushnik, T., Haines, D., Levallois, P., Levesque, J., Van Oostdam, J., Viau, C., 2010. Lead and bisphenol A concentrations in the Canadian population. In: Health Reports, Statistics Canada. 21. pp. 7–18 (Catalogue no. 82-003-XPE).
Caldwell, B.M., Bradley, R.H., 2001. HOME Inventory and Administration Manual, 3rd ed. University of Arkansas for Medical Sciences and University of Arkansas at Little Rock.
Canfield, R.L., Henderson, C.R., Cory-Slechta, D.A., Cox, C., Jusko, T.A., Lanphear, B.P., 2003. Intellectual impartment in children with blood lead concentrations below 10μg per deciliter. N. Engl. J. Med. 348, 1517–1526.https://doi.org/10.1056/ NEJMoa1407764.
CDC (Centers for Disease Control), 2012. Low Level Lead Exposure Harms Children: A Renewed Call for Primary Prevention. US Department of Health and Human Services, Atlanta, GA Available. https://www.cdc.gov/nceh/lead/ACCLPP/Final_Document_ 030712.pdf, Accessed date: 4 January 2018.
Chau, C.M.Y., Cepeda, I.L., Devlin, A.M., Weinberg, J., Grunau, R.E., 2017. The Val66Met
brain-derived neurotrophic factor gene variant interacts with early pain exposure to predict cortisol dysregulation in 7-year-old children born very preterm: implications for cognition. Neuroscience 342, 188–199.https://doi.org/10.1016/j.neuroscience. 2015.08.044.
Chiodo, L.M., Jacobson, S.W., Jacobson, J.L., 2004. Neurodevelopmental effects of postnatal lead exposure at very low levels. Neurotoxicol. Teratol. 26, 359–371.
https://doi.org/10.1016/j.ntt.2004.01.010.
Chiodo, L.M., Covington, C., Sokol, R.J., Hannigan, J.H., Jannise, J., Ager, J., et al., 2007. Blood lead levels and specific attention effects in young children. Neurotoxicol. Teratol. 29, 538–546.https://doi.org/10.1016/j.ntt.2007.04.001.
Debes, F., Weihe, P., Grandjean, P., 2016. Cognitive deficits at age 22 years associated with prenatal exposure to methylmercury. Cortex 74, 358–369.https://doi.org/10. 1016/j.cortex.2015.05.017.
Dipietro, J.A., Voegtline, K.M., 2017. The gestational foundation of sex differences in development and vulnerability. Neuroscience 342, 4–20.https://doi.org/10.1016/j. neuroscience.2015.07.068.
Ethier, A.-A., Muckle, G., Jacobson, S.W., Ayotte, P., Jacobson, J.L., Saint-Amour, D., 2015. Assessing new dimensions of attentional functions in children prenatally ex-posed to environmental contaminants using an adapted Posner paradigm. Neurotoxicol. Teratol. 51, 27–34.https://doi.org/10.1016/j.ntt.2015.07.005. Graham, J.W., 2009. Missing data analysis: making it work in the real world. Annu. Rev.
Psychol. 60, 549–576.https://doi.org/10.1146/annurev.psych.58.110405.085530. Guilarte, T.R., Toscano, C.D., McGlothan, J.L., Weaver, S.A., 2003. Environmental
en-richment reverses cognitive and molecular deficits induced by developmental lead exposure. Ann. Neurol. 53, 50–56.https://doi.org/10.1002/ana.10399.
HCSP (Haut Conseil de la Santé Publique), 2014. Détermination de nouveaux objectifs de gestion des expositions au plomb– Synthèse et recommandations. Available.http:// www.hcsp.fr/explore.cgi/avisrapportsdomaine?clefr=444, Accessed date: 13 December 2017.
Health Canada, 2013a. Final human health state of the science report on lead (publication no H144-4/2012F-PDF). Available.http://www.hc-sc.gc.ca/ewh-semt/alt_formats/ pdf/pubs/contaminants/dhhssrl-rpecscepsh/dhhssrl-rpecscepsh-fra.pdf, Accessed date: 6 April 2017.
Health Canada, 2013b. Risk management strategy for Lead, February 2013. (publication no H144-5/2012E-PDF). Available.https://www.canada.ca/content/dam/hc-sc/ migration/hc-sc/ewh-semt/alt_formats/pdf/pubs/contaminants/prms_lead-psgr_ plomb/prms_lead-psgr_plomb-eng.pdf, Accessed date: 12 February 2018. Hong, S.-B., Im, M.-H., Kim, J.-W., Park, E.J., Shin, M.-S., Kim, B.-N., et al., 2015.
Environmental lead exposure and attention deficit/hyperactivity disorder symptom domains in a community sample of South Korean school-age children. Environ. Health Perspect. 123, 271–276.https://doi.org/10.1289/ehp.1307420.
Hornung, R.W., Reed, L.D., 1990. Estimation of average concentration in the presence of nondetectable values. Appl. Occup. Environ. Hyg. 5, 46–51.https://doi.org/10. 1080/1047322X.1990.10389587.
Hu, H., Téllez-Rojo, M.M., Bellinger, D., Smith, D., Ettinger, A.S., Lamadrid-Figueroa, H., et al., 2006. Fetal lead exposure at each stage of pregnancy as a predictor of infant mental development. Environ. Health Perspect. 114, 1730–1735.https://doi.org/10. 1289/ehp.9067.
Huang, P., Su, P., Chen, H., Huang, H., Tsai, J., Huang, H.-I., et al., 2012. Childhood blood lead levels and intellectual development after ban of leaded gasoline in Taiwan: a 9-year prospective study. Environ. Int. 40, 88–96.https://doi.org/10.1016/j.envint. 2011.10.011.
Jacobson, J.L., Muckle, G., Ayotte, P., Dewailly, E., Jacobson, S.W., 2015. Relation of prenatal methylmercury exposure from environmental sources to childhood IQ. Environ. Health Perspect. 123, 827–833.https://doi.org/10.1289/ehp.1408554. Jedrychowski, W., Perera, F., Jankowski, J., Mrozek-Budzyn, D., Mroz, E., Flak, E., et al.,
2009a. Gender specific differences in neurodevelopmental effects of prenatal ex-posure to very low-lead levels: the prospective cohort study in three-year olds. Early Hum. Dev. 85, 503–510.https://doi.org/10.1016/j.earlhumdev.2009.04.006. Jedrychowski, W., Perera, F.P., Jankowski, J., Mrozek-Budzyn, D., Mroz, E., Flak, E.,
et al., 2009b. Very low prenatal exposure to lead and mental development of children in infancy and early childhood. Neuroepidemiology 32, 270–278.https://doi.org/10. 1159/000203075.
Jian, L., Yajun, C., Dingguo, G., Jin, J., Qiansheng, H., 2014. Prenatal and postnatal lead exposure and cognitive development of infants followed over thefirst three years of life: a prospective birth study in the Pearl River Delta region, China. Neurotoxicology 44, 326–334.https://doi.org/10.1016/j.neuro.2014.07.001.
Jusko, T.A., Henderson, C.R., Lanphear, B.P., Cory-Slechta, D.A., Parsons, P.J., Canfield, R.L., 2008. Blood lead concentrations < 10μg/dL and child intelligence at 6 years of age. Environ. Health Perspect. 116, 243–248.https://doi.org/10.1289/ehp.10424. Kim, Y., Ha, E.-H., Park, H., Ha, M., Kim, Y., Hong, Y.C., et al., 2013. Prenatal lead and
cadmium co-exposure and infant neurodevelopment at 6 months of age: the Mothers and Children's Environmental Health (MOCEH) study. Neurotoxicology 35, 15–22.
https://doi.org/10.1016/j.neuro.2012.11.006.
Lafond, J., Hamel, A., Takser, L., Vaillancourt, C., Mergler, D., 2004. Low environmental contamination by lead in pregnant women: effect on calcium transfer in human placental syncytiotrophoblasts. J. Toxic. Environ. Health A 67, 1069–1079.https:// doi.org/10.1080/15287390490452263.
Lanphear, B.P., 2015. The impact of toxins on the developing brain. Annu. Rev. Public Health 18, 211–230.https://doi.org/10.1146/annurev-pubhealth-031912-114413. Lanphear, B.P., Dietrich, K., Auinger, P., Cox, C., 2000. Cognitive deficits associated with
blood lead concentrations < 10μg/dL in US children and adolescents. Public Health Rep. 115, 521–529.https://doi.org/10.1093/phr/115.6.521.
Lanphear, B.P., Hornung, R., Khoury, J., Yolton, K., Baghurst, P., Bellinger, D.C., et al., 2005. Low-level environmental lead exposure and children's intellectual function: an international pooled analysis. Environ. Health Perspect. 113, 894–899.https://doi.
org/10.1289/ehp.7688.
Leasure, J.L., Giddabasappa, A., Chaney, S., Johnson Jr., J.E., Pothakos, K., Lau, Y.S., et al., 2008. Low-level human equivalent gestational lead exposure produces sex-specific motor and coordination abnormalities and late-onset obesity in year-old mice. Environ. Health Perspect. 116, 355–361.https://doi.org/10.1289/ehp.l0862. Little, R.J.A., 1988. A test of missing completely at random for multivariate data with
missing values. J. Am. Stat. Assoc. 83, 1198–1201.https://doi.org/10.1080/ 01621459.1988.10478722.
Llop, S., Lopez-Espinosa, M.J., Rebagliato, M., Ballester, F., 2013. Gender differences in the neurotoxicity of metals in children. Toxicology 311, 3–12.https://doi.org/10. 1016/j.tox.2013.04.015.
Miranda, M.L., Kim, D., Galeano, M.A.O., Paul, C.J., Hull, A.P., Morgan, S.P., 2007. The relationship between early childhood blood lead levels and performance on end-of-grade tests. Environ. Health Perspect. 115, 1242–1247.https://doi.org/10.1289/ehp. 9994.
Muthén, L.K., Muthén, B.O., 1998–2011. Mplus User's Guide, Sixth edition. Muthén & Muthén, Los Angeles, CA.
Needleman, H., Gatsonis, C., 1990. Low-level lead exposure and the IQ of children. A meta-analysis of modern studies. JAMA 263, 673–678.https://doi.org/10.1001/ jama.263.5.673.
NTP (National Toxicology Program), 2012. Monograph on health effects of low-level lead. Available.https://ntp.niehs.nih.gov/pubhealth/hat/noms/lead/index.html, Accessed date: 28 November 2017.
Oken, E., Radesky, J.S., Wright, R.O., Bellinger, D.C., Amarasiriwardena, C.J., Kleinman, K.P., et al., 2008. Maternalfish intake during pregnancy, blood mercury levels, and child cognition at age 3 years in a US cohort. Am. J. Epidemiol. 167, 1171–1181.
https://doi.org/10.1093/aje/kwn034.
Radloff, J.S., 1977. The CES-D scale: a self-report depression scale for research in the general population. Appl. Psychol. Meas. 1, 385–401.https://doi.org/10.1177/ 014662167700100306.
Ris, M.D., Dietrich, K.N., Succop, P.A., Berger, O.G., Bornschein, R.L., 2004. Early ex-posure to lead and neuropsychological outcome in adolescence. J. Int. Neuropsychol. Soc. 10, 261–270.https://doi.org/10.1017/S1355617704102154.
Santa Maria, M.P., Hill, B.D., Kline, J., 2018. Lead (Pb) neurotoxicology and cognition. Appl. Neuropsychol. Child.https://doi.org/10.1080/21622965.2018.1428803. Schnaas, L., Rothenberg, S.J., Flores, M.-F., Martinez, S., Hernandez, C., Osorio, E., et al.,
2006. Reduced intellectual development in children with prenatal lead exposure. Environ. Health Perspect. 114, 791–797.https://doi.org/10.1289/ehp.8552. Schneider, J.S., Lee, M.H., Anderson, D.W., Zuck, L., Lidsky, T.I., 2001. Enriched
en-vironment during development is protective against lead-induced neurotoxicity. Brain Res. 896, 48–55.https://doi.org/10.1016/S0006-8993(00)03249-2.
Shah-Kulkarni, S., Ha, M., Kim, B.-M., Kim, E., Hong, Y.-C., Park, H., et al., 2016. Neurodevelopment in early childhood affected by prenatal lead exposure and iron intake. Medicine 95, e2508.https://doi.org/10.1097/MD.0000000000002508. Skerfving, S., Löfmark, L., Lundh, T., Mikoczy, Z., Strömberg, U., 2015. Late effects of low
blood lead concentrations in children on school performance and cognitive functions. Neurotoxicology 49, 114–120.https://doi.org/10.1016/j.neuro.2015.05.009. de Souza Lisboa, S.F., Gonçalves, G., Komatsu, F., Salci Queiroz, C.A., Aparecido Almeida,
A., Gastaldello Moreira, E., 2005. Developmental lead exposure induces depressive-like behavior in female rats. Drug Chem. Toxicol. 1, 67–77.https://doi.org/10.1081/ DCT-39696.
Statistics Canada, 2013. Table 111-0012 - characteristics of families, distribution of total income by census family type and age of older partner, parent or individual, annual CANSIM (database). Available.http://www.statcan.gc.ca/tables-tableaux/sum-som/ l02/cst01/famil106a-fra.htm, Accessed date: 30 January 2018.
Surkan, P., Zhang, A., Trachtenberg, F., Daniel, D., Mckinlay, S., Bellinger, D., 2007. Neuropsychological function in children with blood lead levels < 10μg/dL. Neurotoxicology 28, 1170–1177.https://doi.org/10.1016/j.neuro.2007.07.007. Taylor, C.M., Kordas, K., Golding, J., Emond, A.M., 2017. Effects of low-level prenatal
lead exposure on child IQ at 4 and 8 years in a UK birth cohort study. Neurotoxicology 62, 162–169.https://doi.org/10.1016/j.neuro.2017.07.003. Tong, S., McMichael, A.J., Baghurst, P.A., 2000. Interactions between environmental lead
exposure and sociodemographic factors on cognitive development. Arch. Environ. Health 55, 330–335.https://doi.org/10.1080/00039890009604025.
Vahter, M., Gochfeld, M., Casati, B., Thiruchelvam, M., Falk-Filippson, A., Kavlock, R., et al., 2007. Implications of gender differences for human health risk assessment and toxicology. Environ. Res. 104, 70–84.https://doi.org/10.1016/j.envres.2006.10. 001.
Vermeir, G., Viaene, M., Staessen, J., Den Hond, E., Roels, H.A., 2005. Neurobehavioural investigations in adolescents exposed to environmental pollutants. Environ. Toxicol. Pharmacol. 19, 707–713.https://doi.org/10.1016/j.etap.2004.12.041.
Wechsler, D., 2002. Wechsler Preschool and Primary Scale of Intelligence– Third Edition: Canadian. Pearson Clinical Assessment Canada, Toronto, ON.
WHO (World Health Organization), 2017. Preterm birth (Fact sheet n°363). Available.
http://www.who.int/mediacentre/factsheets/fs363/en/, Accessed date: 31 January 2018.
Yang, Y., Ma, Y., Ni, L., Zhao, S., Li, L., Zhang, J., et al., 2003. Lead exposure through gestation-only caused long-term learning/memory deficits in young adult offspring. Exp. Neurol. 184, 489–495.https://doi.org/10.1016/S0014-4886(03)00272-3. Zhou, L., Xu, J., Zhang, J., Yan, C., Lin, Y., Jia, Y., et al., 2017. Prenatal maternal stress in
relation to the effects of prenatal lead exposure on toddler cognitive development. Neurotoxicology 59, 71–78.https://doi.org/10.1016/j.neuro.2017.01.00.