HAL Id: hal-01611996
https://hal.archives-ouvertes.fr/hal-01611996
Submitted on 5 Sep 2018
HAL is a multi-disciplinary open access
archive for the deposit and dissemination of
sci-entific research documents, whether they are
pub-lished or not. The documents may come from
teaching and research institutions in France or
abroad, or from public or private research centers.
L’archive ouverte pluridisciplinaire HAL, est
destinée au dépôt et à la diffusion de documents
scientifiques de niveau recherche, publiés ou non,
émanant des établissements d’enseignement et de
recherche français ou étrangers, des laboratoires
publics ou privés.
Physicochemical characterization of D-mannitol
polymorphs: The challenging surface energy
determination by inverse gas chromatography in the
infinite dilution region
María Graciela Cares Pacheco, G. Vaca-Medina, Rachel Calvet, Fabienne
Espitalier, Jean-jacques Letourneau, A. Rouilly, Élisabeth Rodier
To cite this version:
María Graciela Cares Pacheco, G. Vaca-Medina, Rachel Calvet, Fabienne Espitalier, Jean-jacques
Letourneau, et al.. Physicochemical characterization of D-mannitol polymorphs: The challenging
surface energy determination by inverse gas chromatography in the infinite dilution region.
Interna-tional Journal of Pharmaceutics, Elsevier, 2014, 475 (1-2), p. 69-81. �10.1016/j.ijpharm.2014.08.029�.
�hal-01611996�
Physicochemical
characterization
of
D
-mannitol
polymorphs:
The
challenging
surface
energy
determination
by
inverse
gas
chromatography
in
the
infinite
dilution
region
M.G.
Cares-Pacheco
a,*
,
G.
Vaca-Medina
b,c,
R.
Calvet
a,
F.
Espitalier
a,
J.–J.
Letourneau
a,
A.
Rouilly
b,c,
E.
Rodier
aaUniversitédeToulouse,MinesAlbi,UMRCNRS5302,CentreRAPSODEE,CampusJarlard,Albicedex09F-81013,France bUniversitédeToulouse,INP-ENSIACET,LCA,Toulouse310130,France
cINRA,UMR1010CAI,Toulouse310130,France
Keywords: D-Mannitol Crystallization Polymorphism
Solid-stateanalyticaltechniques Surfaceenergy
Inversegaschromatography ABSTRACT
Nowadays,itiswellknownthatsurfaceinteractionsplayapreponderantroleinmechanicaloperations, whicharefundamentalinpharmaceuticalprocessingandformulation.Nevertheless,itisdifficultto correlate surface behaviour in processes to physical properties measurement. Indeed, most pharmaceutical solidshave multiple surface energies because of varyingforms, crystal faces and impuritiescontentsorphysicaldefects,amongothers.
Inthispaper,D-mannitolpolymorphs(a,bandd)werestudiedthroughdifferentcharacterization techniqueshighlightingbulkandsurfacebehaviourdifferences.Duetothelowadsorptionbehaviourofb
and d polymorphs, special emphasis has been paid to surface energy analysis by inverse gas chromatography,IGC.SurfaceenergybehaviourhasbeenstudiedinHenry’sdomainshowingthat,for someorganicsolids,theclassicalIGCinfinitedilutionzoneisneverreached.IGCstudieshighlighted, withoutprecedentinliterature,dispersivesurfaceenergydifferencesbetweenaandbmannitol,witha mostenergeticallyactiveaformwithagd
sof74.9mJ!m"2.Surfaceheterogeneitystudiesshowedahighly heterogeneousamannitolwithamorehomogeneousb(40.0mJ.m"2)anddmannitol(40.3mJ!m"2). Moreover, these last two forms behaved similarly considering surface energy at different probe concentrations.
1.Introduction
Active pharmaceutical ingredients, APIs, must comply with well-definedspecificationsin terms ofbioavailability, stability, toxicity, purity, morphology, stability, size, etc. Most of these substances can exist in several solid-state forms: polymorphs, pseudo-polymorphs, solvates/hydrates or amorphous forms depending on the generation, growth and formulation con-ditions. This diversity of solid forms requires a thorough understanding of solid-state phenomena that may occur in pharmaceuticalengineering.Eachoftheseformshasadifferent crystalline structure, and hence, different physicochemical properties. In the pharmaceutical field, the consequences related to polymorphism, habitus, surface state and particle size distribution does not relate only to APIs but also to
excipients.Moreover,excipientsplayakeyrolein manufactur-ability but also in API’s dissolution and bioavailability. Solid surfaceproperties suchas size, shapeandpowder agglomera-tionare alsoknowntoimpact dissolutionbehaviour, compact-ability, aerosol performance and surface energetics among others(Ho et al., 2012;Tang et al., 2009).
Thus, toensure a highquality to these organic solids, it is essentialcharacterizingthesolid-stateforms,bothinqualitative andquantitativeways.Characterizationcanbeapproachedbya wide varietyofanalytical techniques. Overthelast decade, the most frequently used solid-state techniques have been in decreasing order, X-ray powder diffraction (XRPD), differential scanning calorimetry (DSC), infrared spectroscopy (IR) and microscopy(Chienget al.,2011).Mostauthorsuseatleasttwo characterization techniques; however, all these methods give informationatdifferentlevelsordifferentdepthswithinthesolid andnotespeciallyonthesurface.Thesedays,itiswellknownthat surface interactions play a fundamental role in mechanical operationssuch as grinding, millingand compaction,processes
* Correspondingauthor.Tel.:+33563493226;fax:+33563493025. E-mailaddress:gcares@mines-albi.fr(M.G. Cares-Pacheco).
commonlyusedinpharmaceuticalformulationsbutalsoinstorage stability.Indeed,animportantphysicochemicalpropertyofsolids is thesurface energy because it reflects interfacialinteractions betweenthe solid and its environment. It seems,therefore, of utmostimportancetoexamineandquantifythesurfaceproperties ofasolid.
Organicsolidsaredefinitelycomplexsystems.Thecomplexity isrelatedtotheanisotropicnatureofcrystallinesolids.Infact,it has been demonstrated that each face of a crystal or defects present in the solid structure has different surface properties generally attributed to different proportions of the functional groupsexposedonit(Hengetal.,2006;Hoetal.,2010).Thus,a singlevaluethatrepresentsthesurfaceenergyofapowdermaybe atbest,ameanvalue.
A quite large number of methods have been used in the literaturetodeterminesurfaceenergyonpharmaceuticalssolids; contact angle, vapour adsorption techniques and atomic force microscopy (AFM). The most common methods are those that relate,directlyorindirectly,surfaceenergytothecontactangle formedbetween a liquid and a solid: spreading, capillary rise, Wilhelmyplateandheatofimmersion.Thelimitationsofthese methodshavebeenwellreviewedbut,evenifthesurfaceenergy valuesobtainedfromcontactanglemeasurementsaresomewhat inaccurate, the mean values obtained have been successfully correlatedtofunctionalityorend-useproperties(Buckton,1995;
BucktonandGill,2007).
Nowadays,thestudyoftheanisotropicsurfacepropertiesofa solidgoesthroughtheinvestigationofsolid–vapourinteractions. In fact, wettabilitymeasurements are based onthe interaction betweenaliquidandasolidsurface.Thisleadstoamacroscopic average of the surface energy, which is sensitive to surface roughness,porosity,packingstructureandtortuosityoftheporous material. On the contrary,gas–solid interactions give access to microscopicvariationsofthesurfacestructure.Indeed,thestudyof theinteractionsbetweenisolatedgasmoleculesandthesolidof interest willbe sensitive tolocalvariations of thesurface at a molecularscale.Differentcharacterizationtechniquesare imple-mentedbasedonvapouradsorption–desorptiononto/fromasolid, which are aimed to give information on specific surface area, porousstructure and distribution (Rouquerol et al.,1999).The mechanisms of surface coverage and/or pore filling can be describedbythestudyofasorptionisotherm.Indeed,theoverall shapeoftheisothermisgovernedbythegas–solidinteractions,the solid’sporestructureandtemperature.Asorptionisothermrelates the adsorbed vapour amount to the vapour concentration surroundingthesolidinequilibriumconditions.Different param-eterscanbemeasuredtodetermineanadsorptionisotherm:the vapourpressure,thesamplemassandtheretentiontime.Eachof these properties gives rise to a class of analytical techniques; manometric,gravimetricorchromatographic.However,veryfew are exploited to give surface energetic information; for that purpose,thetwomaintechniquescommonlyusedaredynamic vapoursorption(DVS)(Storeyand Ymén,2011)andinversegas chromatography(IGC)(HoandHeng,2013;Mohammadi-Jamand
Waters,2014).
Nomenclature
A(m2) Surfaceareaofsolidincontactwiththe adsorbedphase
Aads(J) Helmholtzfreeenergyoftheadsorbed
phase
ag(m2/molecule) Area occupied by an adsorbed probe
molecule
as(m2/g) Specificsurfaceareaofthesolid
Fads(J) Freeenergyoftheadsorbedphase
Fs(cm3STP/min) Carriergas flowrateattheexitof the
columnat273.15–Kandstandard pres-sure
D
Gads(J) Gibbsfreeenergyvariationforisother-maladsorptionofnadsmolesofprobe
fromngmolesingasphaseinitially
D
gads(J/mol) Molar free energy variation for anisothermaladsorptionof probe mole-cules
D
gCH2 (J/mol) Molar free energy variation for an isothermaladsorptionof a methylene groupj(") James–Martincorrectionfactor
K(m) Henry’sconstant
m(g) Samplemass
nads(mole) Adsorbedmolenumber
Na(molecules/mol) Avogadronumber
ng(moles) Numberofgasmoles
nm(moles) Monolayer capacity or number of
adsorbed moles corresponding to a monolayer
nsol(moles) Solidmolenumber
P(Pa) Vapourpressure
P2(Pa) Vapourpressureofa purecomponent
inequilibriumwithitsadsorbedphase ataspreadingpressure
p
2R Perfect gas law constant, 8314JK"1
mol"1
Sads(J/K) Entropyoftheadsorbedphase
T(K) Temperature
Tc(K) Columntemperature
tN(min) Netretentiontime
t0(min) Deadtime
tR(min) Retentiontime
Vads(m3) Volumeoftheadsorbedphase
VN(cm3/g) Netretentionvolume
Wadh(J/m2) Work of adhesion when adsorption
occurs Greeksymbols
g
c(J/m2orN/m) Criticalsurfaceenergyofasolid(usedinZismantheory)
g
dl (J/m2orN/m) Liquid surface energy (or surface
ten-sion)
g
ds(J/m2orN/m) Dispersivecomponent of solid surface
energy
g
s(J/m2orN/m) Totalsurfaceenergyofasolidg
ps(J/m2orN/m) Polarcomponentofsolidsurfaceenergyg
dCH2 (J/m
2orN/m) Dispersivecomponentofsurfaceenergy
ofamethylenegroup
u
(#) Cangleofaliquidonasolidu
s(") Surfacecoveragem
ads(J/mol) Chemical potential of the adsorbedphase
m
g(J/mol) Chemicalpotentialofthegasphasep
(J/m2) Spreadingpressureoftheadsorbateperunitsurfaceareaofsolid
p
2(J/m2) SpreadingpressureoftheadsorbateinequilibriumwithitsvapourphaseatP2
’
(J/mol) Changeininternalenergypermoleunit of adsorbent due to the spreading of adsorbateObjectofawidenumberofpublicationsoverthelastdecade, IGCappearstobeapowerfultechniquetocharacterizethesurface properties of divided solids (Ho and Heng, 2013). In general, chromatographyis a separationtechniquebasedontheaffinity betweentwophases,stationaryandmobileone.Developedinthe latest50s,IGCisbasedonthephysicaladsorptionofgasmolecules on a solid surface. Unlike analytical gas chromatography (GC), whereaknownstationaryphaseisusedtoseparateandidentifyan unknownmixture,inIGCthestudiedsolidisthestationaryphase, andwellidentifiedvapourmolecules,calledprobes,areusedto determine the interaction capacities of the unknown material packedintothecolumn.Theproberetentionistheresultofsurface interactionsbetweenthesegasmoleculesandthesolid(Conder
andYoung,1977).Thesephysicalinteractionsaredominatedby
van der Waalsforces, whose magnitudedepends on theprobe nature for a fixed solid, allowing then both chemical and morphologicalstudiesof dividedsolids. Inaddition, IGCallows tostudytheinfluenceonsolidsurfaceoffactorssuchashumidity
(Buckton and Gill, 2007), physical (Heng et al., 2006) and/or
chemicaltreatments(Hoetal.,2010).
As we already noticed, it is well known that solids are anisotropicsystems.Literature devotedtothesurface heteroge-neityassessmentfromadsorptionmeasurementsisexhaustively reviewedintheworksofJaroniecandMadey(1988)andRudzinski
andEverett(1992).Torepresenttheexistenceofadistributionof
energy siteson a solid surface exploiting IGC data,the energy distributionfunction,
x
(2),isgenerallyused.Thisphysicalmodelsupposesanenergeticallyheterogeneous surface with a continuous distribution of adsorption energies, which can be described as a sumof homogeneousadsorption patches.ThisapproachhasbeenwellreviewedbyBalard(1997)
whohasfocusedhisworkonthestudyofinorganicsolids(Balard
et al., 2008; Papirer et al.,1991,1999; Boudriche et al., 2011).
Anotherwaytostudysurfaceheterogeneityhasbeenproposedby
Fafardetal.(1994)usingIGCininfinitedilutionconditions;this
willbedescribednext.
The firstapplications of IGC in thefield of pharmaceuticals began in thelatest 80s.The firstapproach was focusedonthe determinationofHansensolubilityparametersoflactose,caffeine, theophylline and methyl hydroxybenzoate (Phuoc et al., 1987, 1986).Ithadnotbeenuntil1994thatthetechniquewasusedfor thesurfaceenergycharacterizationofpharmaceuticalsolids.The studies conducted by (Ticehurst et al., 1994) on salbutamol sulphate and
a
-lactose put in evidence the sensitivity of the technique to detect small differences in crystallinity between batches,differencesundetectedbyothertechniquessuchasDSC(Ticehurst et al., 1996). Nowadays, polymorphism remains a
challengingissueforIGC, maybeduetotheupstreamdifficulty obtainingthedifferentpurecrystallineformsofapharmaceutical solidand/orbecauseoftheinstabilityofthepolymorphicsystem duringanalysis.Inspiteofsuchdifficulties,amorphous pharma-ceuticals, which are of great interest because of their better solubility,andthus,betterbioavailability,havebeenthesubjectof severalstudies(BrumandBurnett,2011; Miyanishietal.,2013;
Suranaetal.,2003).
Mannitolhasbeenchosenforthecurrentstudy,inparticular because of the kinetic and thermodynamic stability of its polymorphicsystem. D-Mannitol, or
(2R–5R)-hexane-1,2,3,4,5,6-hexolaccordingtoIUPACnomenclature,is apolyhydric alcohol withthechemicalformulaC6H14O6.Itisoneofthemostcommon
excipientsinpharmaceuticalproductsduetoitschemicalstability andnon-hygroscopicity.Asanactiveingredient,ithasbeenused fortreatingrenalfailureandintracranialhypertensionandmore recently as a bronchoconstrictor (Tang et al., 2009). Several publicationsinrelationtoD-mannitolpolymorphscanbefound;
however, they are somewhat confusing and sometimes even
contradictory. D-Mannitol can exist as four crystalline forms,
threeanhydrousformsnamely
a
,b
andd
andahemihydrateone. Thed
formisenantiotropicallyrelatedtoa
andb
forms.Themost stable form isb
-mannitol, and the less stable at ambient conditions is thed
form. Nevertheless, it has been observed thattheunstableform,d
,canbestableforaperiodofatleast 5yearsatroomtemperature,ifstoredindryenvironment(Burgeretal.,2000).
Bothphysicochemicalpropertiesandpolymorphic transforma-tionbetweencrystallineforms ofD-mannitol thatmayoccurin
crystallization,mechanicalmillingandthermaltreatmentstudies have been successfully characterized by multiple solid-state analyticalmethods(Brunietal.,2009;Burgeretal.,2000;Caron etal.,2007).SurfaceenergyanalysesbyIGChavehighlightedthe acidic natureof the
b
form, attributed to the high density of hydroxyl groups at mannitol surface (Saxena et al., 2007). In addition,IGChasbeenusedtodifferentiatetwoopticalformsof mannitol,theracemic mixtureDLand D-mannitolcomposed ofonlyonestereoisomerinitsanhydrous
b
.Grimseyetal.(1999)found that the dispersive interactions were stronger for the racemic mixture DL-mannitol. Using molecular modelling, the authors attributed this different behaviour to the different densities of the dispersive and acidic sites. More recently, investigationsconcerningD-mannitol havebeenfocused onthe
effect of milling or/and surface heterogeneity (Ho et al., 2010, 2012).Despiteitswidespreaduseinpharmaceuticalformulations, studies on the surface energetic properties of mannitol poly-morphshavebeenrarelyreported.
The current study focuses on the surface energetics of D
-mannitol polymorphsthroughdynamic contact angle measure-ments,DVSandIGCimplementation.Finally,thesolidanisotropyis studiedtoevaluatesurfaceheterogeneityatlowsurfacecoverage. Thedualaimofthisworkistohighlightthedifferencesbetween surfaceandbulkpropertiesofanhydrousformsofD-mannitoland
tocomparethesurfaceenergydeterminationtechniquesusedfor pointingouttheirrelevanceconsideringthephysicalsenseofthe measure.
2. Polymorphsgenerationandcharacterization 2.1.Polymorphsgeneration
2.1.1.Materials
Analytical grade organic solvents, acetone and methanol (MeOH),werepurchasedfromFlukaandAcrossOrganic respec-tively,bothwithamassfractionpurityhigherthan99.5%.High puritydeionizedwater(18M
V
)wasobtainedfromalaboratory purificationsystem.D-MannitolandsorbitolweregenerouslysuppliedbyRoquette.
Thebatch,Pearlitol160C,iscomposedof99%of
b
mannitolmass percentageandonly1%ofsorbitol.Thebatch,Pearlitol200SD,is composed of a mixture ofb
anda
mannitol while the batch NeosorbP100Tiscomposedofsorbitolbutnoinformationabout polymorphic composition has been given. The solubility of D-mannitolwasdeterminedforeachdissolutionmedium.Duetothe highsensitivityoftheHPLCHi-Plexcolumntoorganicsolvents,the solubilityvaluesweredeterminedbytwodifferentways.HPLCwas usedonlywhenthesolvent waspurewater,andclassicsolvent evaporation(dryextractmethod)wasimplementedwhensolvent waswater/acetoneormethanol.Thesolubilityofthecommercial batchPearlitol160C in waterwas foundtobe157mg pergof solutionat20#C.For themixturewater/acetonewitha volume
ratioof1:1,thesolubilityat20#Cwasfoundtobe34mgpergof
solution.Forpuremethanolat60#C,thesolubilitywasfoundtobe
5mg per g of solution.It has tobe notedthat the dry extract method is less precise than the HPLC quantification method,
becauseitdoesnotallowtoquantifysorbitolinfluence,butitwas theonlyonefeasible.
2.1.2.Protocols
Therecrystallizationofpure
b
andd
polymorphswasobtained throughcrystallizationofanaqueoussolutionofD-mannitolusingacetoneasanantisolventaccordingtothefollowingsteps:
$Dissolutionof9gofD-mannitolin50gofwaterunderstirringat
roomtemperatureforatleast2h.
$FiltrationofthesuspensionusingaBüchnerfilterequippedwith a2
m
mpolyethylenemembrane.$Additionof50mlofacetoneatroomtemperature,maintaininga vigorousstirring.
To obtainthe
d
form,thecrystalswereallowed togrow for maximum4min.Fortheb
form,longertimeperiodswereused, allowingthepolymorphictransformation.Forthe
a
mannitolgeneration,acrystallizationprocedureby seedingandfastcoolingwasusedaccordingto:$Dissolution of D-mannitol in methanolat 60#C for 2hunder
stirring(2gin250mlofMeOH).
$FiltrationofthesuspensionusingaBüchnerfilterequippedwith a2
m
mpolyethylenemembrane.$Seedingwithapurephysical
a
formobtainedbyDSC,asfollow:-Firstcycle:heatingrateof20#Cmin"1from20to200#Cfollowed
byacoolingcyclewitharateof5#Cmin"1until20#C. -Second cycle: heating rate of 20#Cmin"1 from 20 to 160#C
followedbyacoolingcyclewitharateof5#Cmin"1until20#C. $Fastcoolingofthefiltrateinanice–ethanolbathundervigorous
stirringfor30min.
For all samples, the same filtration, drying and storage conditions were used,that is a Büchnerfiltrationwitha 2
m
m polyethylene membranefollowedbyadrying inanovenunder vacuum,at30#Cand200mbarforatleast3days.Finally,allsolidsampleswerestoredinadessiccatorundervacuum(6%relative humidity). In order to remove the sorbitol impurity from the commercial powder, at least two consecutive recrystallization processeshavebeenperformedperorganicsolid.
2.2.Characterizationtechniques
Thedifferentcrystallineformsofanhydrousmannitol
a
,b
andd
werecharacterizedbyHPLCtoquantifychemicalimpuritiesand bysolid-stateanalyticalmethodssuchasDSC,XRPD,TGA,SEM,IR, confocalRamanspectroscopy,DVSandIGCtoquantifyandqualify physicalproperties.2.2.1.Polymorphsfingerprints
X-ray diffractograms were obtained using a PANanalytical X’Pert ProMPDdiffractometer(set-upBragg–Brentano). Diffrac-tiondataareacquiredbyexposingthepowderssamplestoCu-K
a
radiation,whichhasawavelengthof1.5418Å.Thegeneratorwas setto45kVandtoacurrentof40mA.Thedatawerecollectedover arangeof8–50#2
u
withastepsizeof0.03#2u
andanominaltimeper stepof39.9s, usingthescanningX’Celeratordetector. Data analysiswasperformedusingX’PertDataCollectorsoftwareand phaseidentificationwascarriedoutbymeansofPANalyticalHigh Score Plus software in conjunction with the ICDD Powder DiffractionFile2databaseandtheCrystallographyOpenDatabase. Ramanspectroscopyanalyseswereperformedwithanatomic force microscope equipped with a confocal Raman imaging
upgrade,Alpha300fromWITec.Thepositioningaccuracyofthe scantableis 1.5nminXYdirection and0.3nminZdirection.A magnificationof50%andawavelengthof532nmwasusedasthe excitationsource,Nd:YAGlaser.TheRamandatawereacquired usingWITecProjectPlussoftwarethathasa16bitsresolutionand asamplingrateof250Hz.
InfraredspectrawerecollectedonaThermoScientificNicolet 5700 FT-IR spectrometer equipped with an attenuated total reflectionmodule(ATR).
DSCmeasurementswereperformedwithaDSCQ200fromTA Instrument.Measurementswereperformedonsamplesof3–5mg placed in non-hermetic aluminium panels, in the temperature range of 20–200#C at a heating rate of 5#Cmin"1. All data
measurementsareaveragesofat leastthreemeasuresonthree differentsamples. Thermogravimetric analyses wereperformed usinganTGA-DSC111fromSetaramonsamplesof5–20mgplaced innon-hermeticaluminiumpanels,performingcyclesfrom25to 250#Cataheatingrateof5#Cmin"1.
2.2.2.Sizeandparticleshapeanalysis
Particleshape analyseswereperformedbyscanningelectron microscopy,usingaXL30FEGfromPhilips.Particlesizeanalyses fortheanhydrousformsofD-mannitolweredeterminedbyimage
analysisusingaPharmaVisionSystem830(PVS830)fromMalvern Instruments.Theparticlesdispersionpressurewassetat6bar.The numberofanalysedobjectswasfixedat70,000.
2.3.Characterizationresults,polymorphsscreening 2.3.1.Powdercrystallinityandpurity
ThechemicalpurityofeachpolymorphwascheckedbyHPLC using a Hi-Plex Ca ligand exchange column coupled with a refractiveindexdetector(analysisconditions:mobilephaseHPLC gradewater,flowrate0.3mlmin"1,columntemperature45#C).
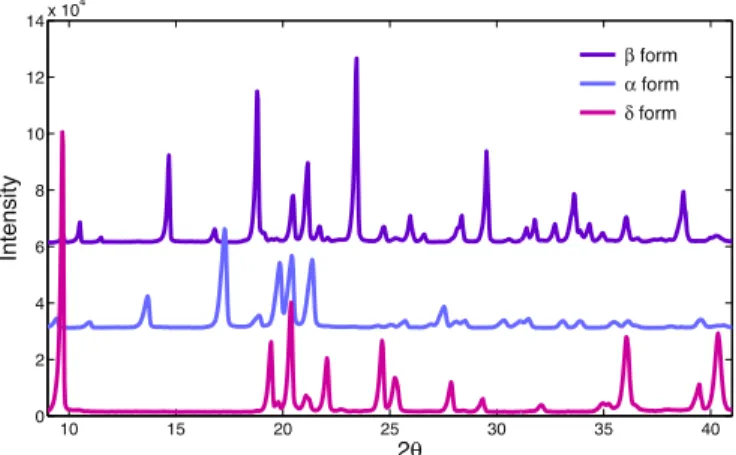
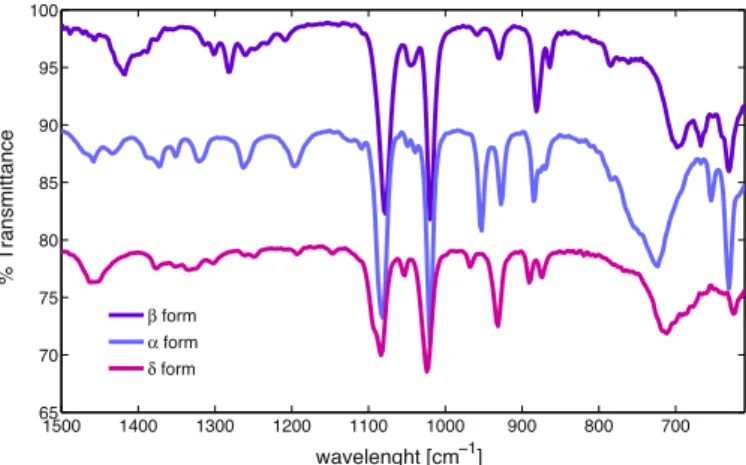
XRdiffractogramsofD-mannitolpureformsareshowninFig.1
andtheIRspectra inFig.2.Bothresultsareinagreement with thosepublishedintheliterature(Burgeretal.,2000),evenifno informationonchemicalpuritywasgiven.Despitethefactthat eachtechniqueprovidesmeaningfulinformation,andnosample preparation is required, both techniques may not be sensitive enough and have their own limitations. Indeed, no significant differencesbetweenthecommercialpowder(1%of
a
-sorbitol)and the recrystallizedb
formwere detected. Anyway, detection of smallquantitiesis complexand maydependonthelocationof sorbitolwithinthepowder,nearto(at)thesurfaceorwithinthe bulkofthecrystals.TheRaman spectra of D-mannitol polymorphsare shown in
Fig.3.Theseareinexcellentagreementwiththosepublishedinthe
literature(Burgeretal.,2000;Haoetal.,2010).ConfocalRaman spectroscopyseemstobeasensitivecharacterizationtechnique, andithasbeenusedtostudypolymorphmixtures.Nevertheless, noqualitativeorquantitativeanalysisofthesorbitolpresencein thecommercialpowderhasbeenrelevant,maybeduetothefact that D-mannitol and its isomer, sorbitol, differ only by the
stereochemistry of one hydroxyl group (inducing subtle intra-and inter-molecular behaviour differences) or due to the low samplemassusedintheanalysis(somemicrograms).Finally,the chemical purity of the samples was confirmed by thermal methods.
ThermogravimetricanalysesbyTGAwereusedtoensurethat no residual solvent was present in the samples. DSC analyses allowed differentiating the commercial powder Pearlitol 160C fromthe
b
pureform.Indeed,sorbitolpresenceinthecommercial powder decreases both heat of fusion and melting point ofb
polymorph.Thefirstendothermicpeakat81.4#C,foundduringthe
analysisofthecommercialpowder,isconsistentwiththemelting point of
a
sorbitol (Nezzal et al., 2009). The endothermic/ exothermic event observed ind
form was attributed to a transformationofthiscrystallineformintoamorestableb
form. Closevaluesofmeltingpointsbetweena
andb
mannitolindicate smallvolumeenergeticdifferences.AlltheseresultspresentedinTable1areinagreementwiththosefoundintheliterature(Bruni
etal.,2009;Burgeretal.,2000).
Forthedeterminationsoftheheatoffusion,usingasigmoid baseline,astandarddeviationoflessthan5%wasestimatedwhile
meltingpointsvaluesaremoreaccuratewithastandarddeviation oflessthan0.5%(sixmeasuresaverage).
2.3.2.Particlesizeandmorphology
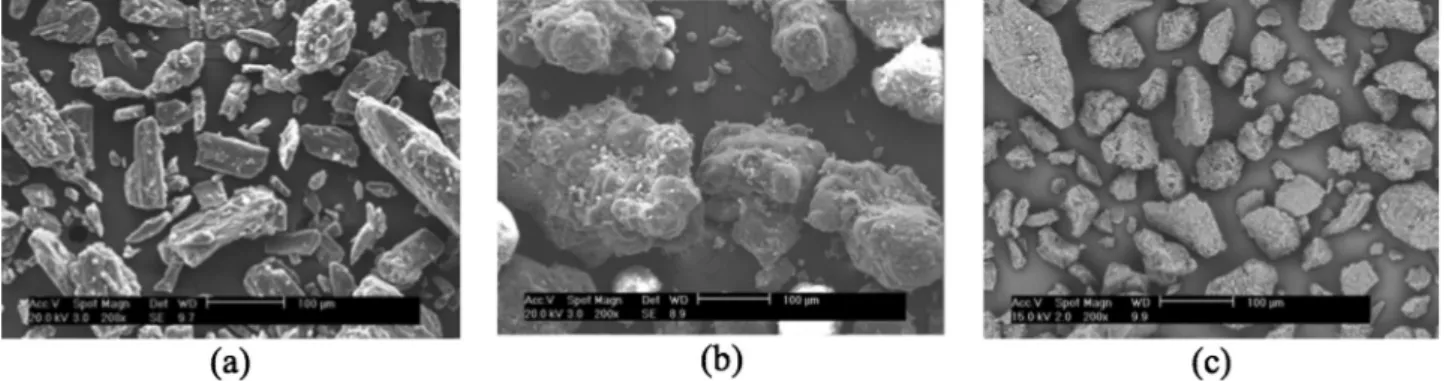
AsshowninFigs.4and5,themorphologyofeachpolymorph andthecommercialsamplesisdifferent.Importantdifferencescan bealsofoundintheliterature,mostlyattributedtothedifferences inrecrystallizationprocedures(Brunietal.,2009;Hoetal.,2012). Asexpected,since
b
andd
mannitolaregeneratedbythesame method,bothformsarealikewiththinnersticksford
mannitol. Sizedifferencesarelinkedtocrystalgrowthduration.Thea
formis thefinestonewithaneedle-shapemorphologyandaD[v
,0.5]of 25.3m
mandD[v,0.9]of42.4m
m(Fig.4b).Thecommercialsample Pearlitol160Cisformedbyirregularstickswithamedianvolume diameterD[v,0.5]of64m
mandaD[v,0.9]of250m
m(Fig.5a).b
Mannitol is composed of better defined sticks with smoother surfaces(Fig.4a),andithasaD[v,0.5]of26.7
m
mandaD[v,0.9]of 81.7m
m.Inbothcases,itseemsthatsmallparticlesgetstuckon thesurfaceoflargerones.3. Surfacebehaviour
Thesurfaceenergyofasolid,
g
s,canbedefinedasthehalfoftheenergyofcohesion,whichistheenergyrequiredtoseparateand thencreatetwointerfacesofunitofsurfaceareafromaprimarily monolithic material and furtherdisplaceone separated partto infinity(inadiabatic,reversibleconditions)(Lee,1991).Thisenergy ofcohesionisalsotheenergyofinteractionbetweenmolecules and atoms under consideration. The surface energy can be approached through the interactions of the solid with its environment,andthenthroughthenatureoftheintermolecular forces involved in the physisorption process. Indeed, surface energy can be divided into dispersive,
g
ds, and non-dispersive
components,
g
ps.Thestudyofnon-polarmoleculesasn-alkaneswillgiveaccess to
g
ds valuewhile thestudy ofmolecules withpermanent dipolemoments, electricalcharges,which maygive risetoacid–base,ionicormetallicinteractionsamongothers,will giveaccessto
g
psvalues.Whatever the system probe–solid, dispersive interactions alwaysoccur,theyarethefocusofthepresentwork.
3.1.Theoreticalbasis
Thisstudyislimitedtothemostwidespreadtechniquesand specificattentionwillbepaidtotheisothermsectionexploitation. Gravimetricadsorptiontechniques suchasDVS (dynamicvapor sorption) are based on the gravimetric measurement of the amountofvapouradsorbedonthesurfaceofasolid.Thistechnique allowstodetermineameanvalueofthesurfaceenergyofapowder basedonthewholeisotherminformation(StoreyandYmén,2011). Indeed,duringDVSanalysisacompletesurfacecoveragecanbe reached.
While wettabilityand DVS measurements providea macro-scopic average of the surface, techniques such as inverse gas chromatography, IGC, can be sensitive to local microscopic variations of the surface structure depending on the injection size. In practice, IGC experiments are generally performed accordingtotwoimplementations, whichdiffer bytheamount of probe molecules injected. The first implementation, called infinitedilution,IGC-ID,isdefinedbytheinjectionofverysmall quantities of molecules. Experimentally, is expected that the retention time or volume remains constant in function of the injection size; thus, probe molecules behaves independently (condition of linear chromatography). The second one, called finite concentration,IGC-FC, is based on higher solute concen-trations (non-linear chromatography), and some degree of
Fig.2.IRspectraofD-mannitolpolymorphs.
500 1000 1500 2000 2500 3000 3500 200 300 400 500 600 700 800 Raman shift [cm−1] Intensity β form α form δ form
interaction betweenprobe molecules is expected (Conder and
Young,1977).
However,whilestudyingD-mannitolpolymorphsthatarelow
specificsurfaceareaorganicsolids,someconcernsandquestions had arisen to actually differentiate these two domains of implementation: at which relativepressure, P/Psat, rangeis the
IGC-IDzone limited?Howsmallshouldbetheinjectionsizeto actuallyobtainretentiontimesindependentofthegasmolecules concentration? Moreover, is the linear part of the adsorption isothermdefinedbysymmetricorslightlyasymmetrical chroma-togramsasadmittedinliterature?
Totrytoanswerthesequestions,surfaceenergyvalueswere estimated exploiting only the linear part of the adsorption isothermatverylowsurfacecoverage.Thiswillbepresentednext but, above all, preliminary bases of IGC theory need to be presented.Inparticular,thermodynamicapproachof physisorp-tion on a solid surface is reminded so as to point out the specificities of solid-adsorbed vapour system underlying the classicalresultsusedwheninterpretingIGCresults.
3.1.1.BasicIGCtheory
The time spent for a probe molecule to pass through the column,tR,reflectstheinteractionsbetweenthevapourmolecules
and the solid;it is then the key measure in IGC analysis. The strength of theseinteractions depends onthesolid nature and structure(surfaceheterogeneities),thenatureandquantityofthe probemolecules.
AsshowninFig.6,afractionofthisresidencetime,calleddead time,t0,correspondsonlytothetimeforaprobemoleculetoflow
throughthesolidwithoutanyinteractionandcanbedetermined
byanon-adsorbedmoleculesuchasmethane.Then,netretention timeisdefinedas:
tN¼tR"t0 (1)
Takingintoaccountthepressuredropalongthecolumnusing theJames–Martincorrectionfactor,j,itispossibletorelatetNto
thenetretentionvolumepersamplemassunit,VN,through:
VN¼mjFstN273:15Tc (2)
wheremisthesolidmass,Fsisthecarriergasexitflowrateat
standard temperature and pressure, and Tc is the column
temperature.
Relatingaretentiontimeorvolume,toasurfaceenergyvalue needs to introduce some additional concepts. First of all, it is assumed that thesolid onwhich adsorptionoccurs, adsorbent, remainsunchangedinstructureandischemicallyinert.Theprobe moleculesintheadsorbedstatecalledadsorbatemayberegarded as a distinct phase whose volume is considered negligible comparedtotheprobemoleculesinthevapourphase,alsocalled adsorptive. The diminution of the surface tension, due to physisorption, is called the spreading pressure,
p
, and is the intensivevariablethatcharacterizestheadsorbedphase. Accord-ing to Ruthven approach (Ruthven, 1984), a new free energy thermodynamicfunctioncanbedefinedas:Fads¼Aadsþ
’
nsol (3)wherensolisthemolenumberofadsorbentwhile
’
representsthechange in internal energy per mole unit of adsorbent due to thespreadingoftheadsorbateovertheadsorbentsurface,Aadsis
theHelmholtzfreeenergyofthesystemadsorbate–adsorbent.
Fig.4.SEMmicrographsofD-mannitolpolymorphs;(a)bform,(b)/formand(c)dform. Table1
Summaryofphysicalsolid-statecharacterizationobtainedbyDSC.
Pearlitol160C NeosorbP100T Pearlitol200SD b-Form a-Form d-Form
Heatoffusion[Jg"1] 300.20.4 179.7 292.10.2 304.5 294.4 0.9/"2.1Melting/recrystallization Meltingpoint[#C](onset) 165.681.4 96.8 165.168.6 166.7 165.3 146.8/156.2Melting/recrystallization
Foradsorptiononatwo-dimensionalsurface,thesurfaceareaAin contactwiththeadsorbedmoleculesisdirectlyproportionaltonsol.
Sotheproduct
’
nsolisequivalenttop
A.Hence,Eq.(3)turnsinto:Fads¼Aadsþ
p
A (4)Incaseofgasadsorption,thegastransferwilloccurlowering thefreeenergyofthesystemuntilequilibriumisreached(Fadsis
minimum).Theequilibriumoftheadsorbateisrepresentedbythe followingfundamentalthermodynamicequation,whichcombines thefirstandsecondlaws:
dFads¼"SadsdT"PdVadsþAd
p
"mads
dnads (5)ThankstotheEuler’shomogeneousfunctiontheorem,Fadscan
alsobeintegratedas:
Fads¼"PVadsþ
mads
nads (6)SubtractingEq.(5)tothedifferentialofthefunctionsixleadsto anequilibriumrelationliketheGibbs–Duhemone:
"SadsdT"VadsdPþAd
p
"nadsdmads
¼0 (7)Giventhattheadsorbedphasevolumeisgenerallynegligible,the relationthatlinksvariablesalonganisothermaladsorptionisthen: A
@p
@
P ! " T" nads@mads
@
P ! " T¼ 0 (8)Equilibriumconditionsbetweentheadsorbedphase andthe adsorptiveoneimplytheequalityoftheirchemicalpotentials.In addition,adsorptivephaseisassumedtobehaveasanidealgas.In thiscase,Eq.(8)leadstotheGibbsadsorptionisotherm: A
@p
@
P ! " T¼ nads@mg
@
P ! " T¼ RT Pnads (9)Dependingontheprobemoleculesconcentration,theadsorbed phase may obey to different equations of state. At very low concentrations, it is supposed to obey an equation of state equivalenttoidealgaslawaccordingto:
p
A¼nadsRT (10)Inthiscase,theGibbsadsorptionisothermbecomes:
@p
@
P ! " T¼p
P (11)IntegrationofEq.(11)leadstotheHenry’slaw,thatisalinear relation between adsorptive pressure and adsorbate spreading pressurethroughaconstantK:
K¼
p
Por nads A ¼K P RT (12)Weconsidernowtheisothermaladsorptionofnadsmolesof
adsorbateataspreadingpressure
p
2inequilibriumwithng"nadsmoles of gas phase at a pressure P2 from a gaseous phase
comprisinginitiallyngmolesatapressureP1.Thevariationoffree
enthalpyofadsorptioncanbeexpressedas:
D
Gads¼nadsmadsðT;p2
Þþðng"nadsÞmg
ðT;P2Þ"ngmgðT;P1Þ (13)where
p
2istheequilibriumspreadingpressureatP2,bothbeingrelatedbyK=
p
2/P2.Finalconditionsofthis adsorptionareequilibriumones.The chemicalpotentialoftheadsorbedphasecanthenbeexpressedas thatadsorptiveidealgasone.Eq.(13)turnsinto:
D
gads¼D
Gnads g ¼RTln P2 P1¼"RTln P1Kp2
(14)Asit wasalreadyenlightened,themeasuredvaluethatgives accesstotheequilibriumconditionsistheretentionvolumeVN,
anditcanbedirectlyrelatedtotheequilibriumconstantKfrom Eq.(12):
VN¼nadsPRT¼KA¼Kasm (15)
Takingintoaccount, allthehypothesespreviouslydescribed andrelatingEqs.(14)and(15),thevolumeVNcanberelatedtothe
changeinmolarfreeenergyofadsorptionby:
Fig.6.Principleofinversegaschromatography.
D
gads¼"RTlnP1VNp2
asm (16)Experimentally,Tistakentobethecolumntemperature,Tc.
Thefirstapproachtoquantifysurfaceenergyovercomingthe unknownarbitraryvalues,
p
2andP1dilemma,wassuggestedbyDorrisandGrayin1979.Theirmodelisbasedontheobservation
thatinachemicalfamilyofhomologues,theretentiontimeisan exponentialfunctionofthenumberofcarbonatoms(Derminot, 1981).Experimentally,itisnecessarytoinjectaseriesofn-alkanes andplotthevariationoftheterm"RTlnVNversusthenumberof
carbon atoms.Theslope ofthis lineisthevariationof thefree energyofthesystemduringtheadsorptionofamethylenegroup,
D
gCH2;D
gCH2¼"RTln VNþ1VN (17)
In addition,the changein free energy of adsorption canbe understoodastheadhesionoftwophasesduetotheinteraction forcesbetweenthemanddescribedbytheenergyofinteractionor itsopposite,theworkofadhesion(thatistheworknecessaryto overcometheinteractionsforces).Iftheprobemoleculesare n-alkanesandtheadsorptiontakesplaceonanon-polarsolid,the interaction forces are dominated by dispersive interactions (London type). Applying the model of Fowkes for Lifshitz-van derWaalsinteractionsrepresentingtheworkofadhesion,Wadh,
theGibbs freeenergy ofadsorption,
D
gads,canbeexpressedasfollows:
D
gads¼NaagWadh¼Naag2 ffiffiffiffiffiffiffiffiffiffiffig
d lg
ds q (18) FinallyEqs.(17)and(18)leadsto:D
gCH2¼NaaCH22 ffiffiffiffiffiffiffiffiffiffiffiffiffiffiffiffig
d CH2g
d s q ¼"RTlnVVNþ1 N (19)whereaCH2isthesurfacearea,6%10"18m
2,and
g
dCH2isthesurface energyofamethylenegroup,(35.6mJm"2at20#C).
3.1.2.Surfaceenergyprofile
The SEA analysis software, Cirrus Plus from SMS company, proposestostudysurfaceheterogeneityusingIGC-IDbasis,andit istheoneusedinthisresearchwork.Surfaceheterogeneitystudies usingIGC-IDbasishavebeenproposedbyFafardetal.(1994)and describedbyYlä-Mäihäniemietal.(2008).Ascanbedepictedfrom
Fig.7,the
g
dsprofileisdeterminedbyinjectingaseriesofalkanesat
differentconcentrations.
Theaimistorelatedifferentprobemoleculesconcentrationsto a surfacecoverage of thesemolecules over thesolid, tofinally correlatethesurfacecoveragetoasurfaceenergyvalue.
In our case, first order method (FM) was used to study adsorptionisothermsfromIGCelutionchromatograms.IntheFM
method as in the peak maximum method (PM), different
concentrationsofprobemolecules(correspondingtodifferentP/ Psat)areinjectedintothecolumn(Fig.7–step1).
The net retention volume, VN, can be determined for each
injectionconcentrationusingthenetretentiontimeobtainedfrom firstordermoment(Eq.(2))oftheelutionpeak.TorelateVNto
surface coverage, n/nm, the software calculates the desorbed
amount,n,frompeakareaanalysis.Sincemonolayercapacity,nm,
for each alkane is calculated from the BET adsorption model, surfacecoveragecanbecalculatedfromthedesorbedamount,n,at eachprobeconcentration(Fig.7–step2).AsillustratedinFig.7, foreachalkaneataparticularsurfacecoverage
g
dscanbecalculated
classically using IGC-ID theory via Dorris–Gray and/or Schultz approaches. Finally, each
g
ds value can be related to a surface
coveragevalue(Fig.7–step4). 3.2.Surfaceanalysestechniques 3.2.1.Materials
Analytical grade organic solvents such as ethanol, toluene, dichloromethane,diiodomethane,formamide,ethyleneglycol33% and1,4-dioxanewerepurchasedfromFlukaorAcrossOrganicallof themwithamassfractionpurityhigherthan99.5%.Thenon-polar probesoctane,nonane,decaneandundecanewerepurchasedfrom Sigma,assay>99%.
3.2.2.Protocols
DynamiccontactangleswereobtainedwithaKrüssprocessor tensiometerK12in combinationwithaKsoftware.Thepowder sampleswereplacedinastainlesssteelholderwithholesinits bottomsmallenoughtoavoidthepowderflowingthroughthem. The samples, previouslypacked with a centrifuge at 1000rpm during5min,weresuspendedfromthemicrobalanceplacedinthe processortensiometerjustabovethesurfaceofthetestliquid.The liquidreservoirwaskeptat20#C(293K)withathermostatedbath
(HaakK20/DC5).
Gas adsorption manometry was performed in an ASAP
2010instrumentfromMicromeritics.Eachsamplewasdegassed undervacuumat50#C(323K)duringatleast72h.Forcomparison
purpose,argonwasusedastheadsorptiongas.Theanalyseswere carriedoutatatemperatureof"196#C(77K)(liquidnitrogen).
Gasadsorptionanalyses bygravimetrywerecarriedoutin a dynamic vapour sorption (DVS-2) instrument from surface
measurement systems SMS. The DVS measures sample mass
evolution using a Cahn microbalance with a resolution
experimentallydeterminedat5
m
g.Duringtheanalyses,avapour flowconstitutedofamixtureofprobe-saturatedanddrycarrier gas(nitrogen)surroundsthesample.Thepartialpressureofthe probe iscontrolled using mass flowcontrollers, and thewhole systemiskeptisothermalbyanenclosedcabinetfixedat25.0#C(297K).Isothermsweremeasuredusinganalyticalgraden-nonane asnon-polarprobeanddifferentpolarprobessuchasisopropanol andethanolwerealsotested.Thesamplesizewastypically70mg, and atleast onecycleof adsorption–desorptionwas studied: a cycleconsistsofmassmeasurementsversustimeuntilequilibrium isreached, performedatfixed increasing(decreasing)valuesof partial pressure vapour probe (P/Psat). The sorption isotherms
valuescalculatedarethen,theequilibriummassvaluesobtainedat each partial pressure with an equilibrium criterion of mass variationlowerthan5
m
gduring5min.SpecificsurfaceareaandsurfaceenergyanalysesofD-mannitol
polymorphs were carried out using the IGC-surface energy analyser(IGC-SEA)fromSMS.Eachpolymorphsamplewaspacked intopre-silanisedcolumnsof300mmlengthand4mminternal diameter,pluggedwithsilanisedglasswool.Priortoanalysis,each columnwasconditionedat50#Cfor2hat0%RH.Heliumwasused
asacarriergasat10sccm,andthecolumntemperaturewasfixed at 30#C (303K) during the analysis, all experiences were
undertaken in identical conditions. Due to the progressive spreadingof theprobe molecules withthemigration time,the adsorption isotherms and the net retention volume, VN, were
determinedusingpeakcenterofmass,whichcorrespondstothe FM method (Giddings, 1965). The retention times of probe moleculesandmethaneweredeterminedusingaflameionization
detector (FID). Dead volume was determined by methane
injections and dispersive surface energy determination by a homologousseriesofvapourn-alkanes(undecane,decane,nonane and octane).Dispersive surface energy profiles werecalculated usingCirrusPlussoftware(version1.2.3.2SMS,London)following Dorris–GrayandSchultzapproaches.
Forallspecificsurfaceareaandsurfaceenergydeterminations, astandarddeviationoflessthan5%wasestimated.Forcomparison purposes, all columns were filled with a mass of powder correspondingtoasurfaceareaof0.5m2.Theideawastostudy
similarsurfacecoveragevaluesobtainedexperimentally. UnlikeothersIGCequipments,IGC-SEAhasaninjectiondevice thatallows tocontroltheinjection size,and soit worksfixing specific surface coverage values. The corresponding surface coverage,
u
s,ateachinjectionconcentrationistheratiobetweenthe desorbed amount, n, determined from peak area and the monolayercapacityofthesolid,nm(
u
s=n/nm).Inourexperiments,nmwasdeterminedfromthespecificsurfaceareavalueobtained
byIGC-SEAusingn-nonaneasprobemolecule. 3.3.Resultsanddiscussion
3.3.1.Surfaceenergeticscharacterizationbywettingforce:capillary penetrationmethod
Thefirstapproach todetermine surfaceenergy wasthrough dynamic contact angle studies. The aim was on one hand, to evaluate the wettability of mannitol using different liquids, allowingustodeterminewhichsolventsshouldbeusedforDVS analyses,ontheotherhandtotestthesurfaceenergyestimationby thisapproach.To undertakethis, twocommercialbatcheswere used. In fact, this type of analysis involves high quantities of powder, so the batch Pearlitol 160C was used to evaluated
b
mannitol,andthebatchPearlitol200SDwasusedtoevaluate
a
mannitol behaviour. Contact angle measurements on bulk powdersusingthecapillarypenetrationarepresentedinTable2. The geometric factor C, linked to packing characteristics, was determinedusing n-hexane, and theerrorassociated toallthe
measures was evaluated as the standard deviation of four measurements.
Severaltheoriescanbeusedtoconvertcontactangledatainto surfaceenergyvalues.Theobjectiveistofindapropercombination oftestsolventsknowingthatthesurfaceenergyvaluedependson theliquidsthatareusedandthetheorythatischosen.Thesurface energyresultsobtainedbycapillaryrise,usingOwens–Wendtand Fowkesmodels,aregatheredinTable3.
ThemodelproposedbyOwens,Wendt,RabelandKaelbledefines surfaceenergyasa sumof a dispersivecomponentanda polar component(OwensandWendt,1969).Thesurfaceenergyvalues were evaluatedwithout usingwaterand ethanolassolventsfor improvingthefitconfidence(R2160C=0.956andR2200SD=0.909).For
water,itseemsthatthehydrophiliccharacterofmannitoldoesnot ensurethatthemechanismofliquiduptakeisonly adsorption,anda partialdissolutionofthepowdercouldoccur.Fowkesmodelhas similar basis as the model above but determines the two components,dispersiveand non-dispersive,takingintoaccount the spreading pressure,
p
(Fowkes, 1964). In contact angle measurements,Fowkesmodelisgenerallyappliedonlywithtwo liquids, wateranddiiodomethane. Inourcase, weused diiodo-methanetoevaluateddispersiveinteractionsandethyleneglycol 33%ratherthanwatertoevaluatedpolarinteractions.Contactangleanalysisallowstochoosethesolventsneededfor DVS studieshighlightingthedifficultiesof solvent choicefor
b
mannitol analysis, for which acceptable wettability behaviour (
u
!0)islimitedton-hexane.Fora
mannitol,n-nonanewasused asprobemoleculetostudyg
ds andpolarmoleculesas
dichloro-methaneandethanol,tostudy
g
pscomponent.As a conclusion, capillary rise measurements give a global approachofthesolidsurfaceenergy,beingawareofthelimitations and therelativityof theaccuracy(lowR2 results)ofthevalues
gatheredinTable2,wehaveshownconsistencybetweenOwens– WendtandFowkesmodels.
3.3.2.Surfaceenergeticscharacterizationbyadsorptiontechniques: solid–vapourinteractions
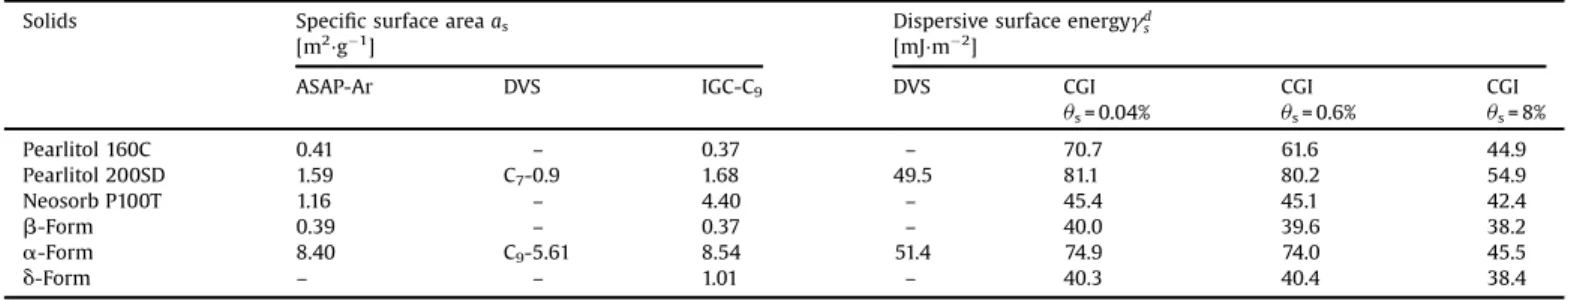
Alltheresultsobtainedfromsolid–vapouradsorption techni-quesare gatheredinTable 4.Specific surfaceareavalues were determined by three different techniques such as manometry
Table2
DynamiccontactanglemeasurementsonD-mannitolcommercialpowdersby capillaryrise.
Solvant Contactangleu[#] Pearlitol160C C=3.4%10"5[cm5] PearlitolC=1.75%10200SD"5[cm5] n-Hexane 0.0 0.0 n-Octane 38.0*4.0 – n-Nonane 38.6*3.2 0.0 Ethanol 43.1*4.1 26.1*2.5 Toluene 41.5*2.8 0.0 Dichloromethane 43.1*4.1 21.0*2.0 1,4-Dioxane 47.3*1.6 0.0 Diiodomethane 76.4*0.7 55.7*2.3 Formamide – 58.5*2.6 Ethyleneglycol33% 84.2*1.5 75.6*1.7 Water 79.1*0.3 61.3*3.4 Table3
Surfaceenergy[mJm"2]analysisdeterminedbycapillaryriseanddifferentmodels approach.
Solid/model OwensandWendt Fowkes
gd
s gps gs gds gps gs Pearlitol160C 18.7 4.8 23.5 19.5 4.7 24.2 Pearlitol200SD 27.6 6.1 33.7 31.1 4.2 35.3
usingargon(ASAP),gravimetryusingDVSandIGCwithalkanesas probemoleculesforbothlastones.Alldataexploitationisbasedon theBETadsorptionmodel.
For the DVS analysis, the baseline instrument stability was especially important due tothefact thatthe absolutelevelsof vapouruptakewereinthedetectionlimitsatlowP/Psat.Infact,the
absolutevapouruptakeswerelow,typicallylessthan0.3%.Asan exampleforthecommercialform,Pearlitol160C,anadsorptionof 0.025% at P/Psat close to one was obtained, while for
b
andd
-mannitolamassuptakesmallerthan0.3%wasobtainedatthe samepressureratio.Tostudysurfaceenergyfromagravimetrictechniquesuchas DVS,thesurfacetensionofthesolventhastobetakenintoaccount tohaveaccuratevalues(n-hexane
g
ds= 18.4mJm"2andn-nonane
g
ds= 22.7mJm"2). Indeed, the probe molecules must have a
surfacetensionlowerthanthesolidsurfaceenergy(i.e.liquidmust wet thesurfacesolid,
u
!0#).Also, thevapouruptake mustbeadsorptionandthermodynamicequilibriumatallpartialpressures must be reached. So, as expected from dynamic contact angle results(Table2),DVSstudieshavebeensuccessfullyperformedfor the batch 200SD and the pure
a
form. Moreover, despite the physicalcompositiondifferences,theobtainedisothermsshowed aclassictypeIIBETshaperevellingsimilaradsorptionbehaviour (+50mJm"2).For allIGCexperiences,anexperimentalvalueoftNfor each
probemolecule,ateachsurfacecoveragevalue,wasfundamental inordertoavoidanymeaninglessextrapolation.Thus,duetothe limitations of SEAinjection system,n-heptanewas not usedas probe molecule because it cannot be injected at low surface coveragevalues(
u
s<0.01).Concerningn-undecane,itcannotbeinjected at
u
s>0.01,but,even ifitcanbeinjectedat reallylowu
s+0.0001,noisysignalswereobtained,andproblemsofreturntothebaselineafterinjectionwereobserved.Also,forn-undecane, strong differencesbetweenpeak maximum and peak center of
mass werefound, showingimportant asymmetryof theoutlet pulsepeaks,whichinducedagreaterrorintheR2valuesobtained
forthealkanesline(step3onFig.7).Thus,tostudysurfaceenergy of D-mannitol polymorphs, C8, C9 and C10 were used as probe
molecules.Nevertheless,forC8,alinearapproximationwasusedto
obtainlowsurfacecoveragevaluessinceitcannotbeinjectedat
u
s<0.001.Incaseofpolarinteractionsstudies,allvapourprobescouldnot be injected at low surface coverage values (
u
s<0.02), andasymmetrical chromatograms were obtained. As it was not possibletodetermineHenry’sregion,onlyn-alkanesarethefocus ofthiswork.
InIGC-ID,averylowconcentrationofvapourprobeisinjected. Thus, no probe-probe molecular interactions are expected to occur and the adsorption follows Henry’s law. The chromato-grams have a Gaussian shape, and the retention time is independentoftheamountofprobeinjected.Forsomeorganic solids,thisregionmaybedifficulttoobserve,thespecificsurface areaandtheintensityoftheinteractionsseemtoplayakeyrole. Indeed,in thecaseoflowsurfaceareasamples,themonolayer capacityofthesolidiseasilyreached(
u
s=1).Thereby,aprecisecontroloftheinjectedamountiscrucialtostudysurfaceenergyat the“zeroconcentrationregion”.
MostauthorsdefinetheIGC-ID zoneat lowvapour concen-trations, typically for P/Psat<0.03. To verify this statement for
organicsolids,inourexperiments,theHenryregionwasdefined foreachprobemolecule.Thechosencriterionwaslinearityofthe adsorptionisotherm,withacorrelationcoefficientR2>0.999.For
almostallsolidsstudied,thesodefinedHenry’sregionrevealedto becomposed of two zones. Thefirst onewas characterized by chromatogramshavingaGaussianshapeandbythefactthatthe retentiontimewasindependentoftheamountofprobemolecules injected,asshowninFig.8a.ThisIGC-IDregionwasfoundtobe limitedtoreallylowsurfacecoveragevalues:for
b
,d
mannitolandTable4
SpecificsurfaceareasanddispersivesurfaceenergiesofD-mannitolpolymorphs. Solids Specificsurfaceareaas
[m2!g"1]
Dispersivesurfaceenergygd s [mJ!m"2]
ASAP-Ar DVS IGC-C9 DVS CGI
us=0.04% CGI us=0.6% CGI us=8% Pearlitol160C 0.41 – 0.37 – 70.7 61.6 44.9 Pearlitol200SD 1.59 C7-0.9 1.68 49.5 81.1 80.2 54.9 NeosorbP100T 1.16 – 4.40 – 45.4 45.1 42.4 b-Form 0.39 – 0.37 – 40.0 39.6 38.2 a-Form 8.40 C9-5.61 8.54 51.4 74.9 74.0 45.5 d-Form – – 1.01 – 40.3 40.4 38.4
Pearlitol160C,thiszonewaslimitedto
u
s<0.001.Thesecondzonewascharacterized byadecrease ofthenetretentiontime with increasingsurfacecoverage(Fig.8b).For
a
,mannitoltNwasneverindependentoftheinjectedamount,sothefirstzonewasnever reached. Thisdifference canbe attributedtohighsolid surface heterogeneity (Fig. 9) and to the strength of the interactions involved.
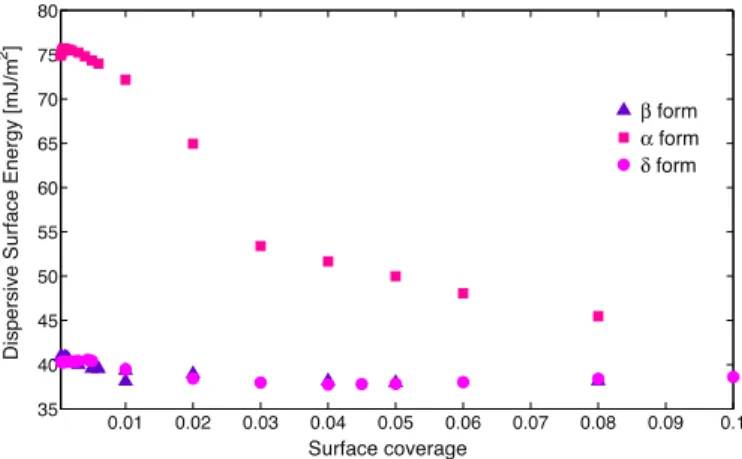
AsshowninTable4,the
a
formisthemostenergeticallyactive formwithg
dsof74.9mJm"2at
u
s=0.04%.Thesefoundinghighlightthepotentialof pure
a
polymorphin drypowderinhaler(DPI) formulations.Nowadays,itiswellknownthatsurfaceproperties playafundamentalroleinthedrug-carrierinteraction.Tangetal.(2009)studiedsurfaceenergyofdifferentD-mannitolbatchesto
explainaerosolperformance.Theauthorsconcludedthathigher surface energy powders can lead to an improvement of the respirablefractionoftheactiveingredient.Ithastobenotedthat surface energy analysis must to be performed together with particles dynamics studies (packing, contact area and detach-ment).Indeed,particlesshape is animportantfactorin aerosol performance.Itseemsthatneedle-likeparticlesreacheasierdeep lungsdepositionwithoptimumtherapeuticbenefit(Tangetal., 2009).Thehighersurfaceenergybatchobtainedbytheauthorsis composedofamixtureof
a
andb
mannitol.Fromourresults,this highvalueisattributedtothepresenceofa
form,whichgenerates morecohesiveandadhesivepowders.Indeed,thepresenceofa
mannitol in the commercial powder 200SD seems to highly influencethemixturebehaviour(Table4).
Themostcommonlyusedcarrieris
a
lactosemonohydratewith ag
dsof+40mJm"2atP/Psat+0.04(Hengetal.,2006).Nevertheless,ithasbeenshownthatlactosecanpromotechemicaldegradation of some active pharmaceutical ingredients when used in formulations as an excipient (Guenette et al., 2009). Thus,
a
mannitolhavingahighsurfaceenergy,stabilityandwelldefined needle-shape morphology is a possible candidate for useas a bronchoconstrictorinDPIformulations.
Thestable
b
formislessactivewithg
dsof40.0mJm"2andnot
muchdifferentof
d
formwithg
dsof40.3mJm"2.AfterDVSanalysis,
wherevapour uptakelevelswerein thedetectionlimitsrange, doubtsaboutisothermtype(IIor III)havearisenforthesetwo forms.Unfortunately,theadsorptionbehaviourcannotbestudied at
u
s>1withIGC-SEAequipmenttoconfirm(disconfirm)isothermtype.Besides,significantdifferenceshavebeenfoundbetweenthe commercialpowderandthe
b
pureformobtainedby crystalliza-tion. These differences could be mostly attributed to particles morphology; the recrystallizedb
mannitol seems to be more “homogeneous”(Fig.4a)thanthecommercialpowder(Fig.5a). Anisotropiesinthemorphologyofthecommercialformcanbeseenashighenergeticsitesthatinfluencethesurfaceenergyvalue obtainedatlowsurfacecoverage.
Sorbitolinfluenceon
b
mannitol,throughPearlitol160Cbatch, was not quantified. Indeed, sorbitol surface behaviour was evaluatedviathecommercialbatchNeosorbP100T.Nevertheless, DSCanalysishighlightedthatthisbatchisconstitutedmostlyofg
-sorbitol(45mJm"2)whilethepolymorphicformpresentinthebatch Pearlitol160C may mostlikely be
a
-sorbitol, which is a metastableformnot availablepurecommercially(Nezzaletal.,2009).
Thesurfaceenergyvalueobtainedforthestable
b
formisin agreement, but lower,withthose obtainedinthe literature via contactangleonasinglemacroscopiccrystalusingOwens–Wendt model(Hoetal.,2010).Indeed,crystallineb
mannitolobtainedin thisresearchisclosertothelessenergeticallyactivefacet(011) thantothemoreenergeticallyactiveone(010)determinedbythe authors(44.0mJm"2).Saxenaetal.(2007)studiedsurfaceenergybydynamicmolecularmodellinganddetermineda
g
dsof56.2mJ
m"2fortheplan(020)anda
g
dsof55.3mJm"2fortheplan(110).
Nevertheless, these high values were never obtained in this researchwork.
The results obtainedvia IGC at
u
s= 3% for the commercialpowderPearlitol160CaresimilartothoseobtainedbyHoetal.
(2010)witha
g
ds of49.5mJm"2.Moreover,thesevaluesarealso
similar tothose obtainedby Saxena et al.(2007) using IGC-ID classicalapproach(P/Psat+0.03),witha
g
ds of48.2mJm"2.Dorris–GrayandSchultzmodelshavebeenusedtodetermine
g
ds.Nevertheless,SchultzmodelshowedslightlylowerR2values
foralmostallpolymorphsatalmostallsurfacecoveragevalues. TheseresultsareinagreementwiththeresultsofYlä-Mäihäniemi
etal.(2008).Theauthorsattributedthisfacttotheuncertaintyof
thecross-sectionalareaofmoleculesinvolvedinSchultzequation (influence of molecular shape and temperature). Nevertheless, thesedifferenceswerenotthatcriticalinthiswork.
The surface energetics profiles obtained using Dorris–Gray approachareshowninFig.9.AcriterionofthefitR2>0.999forthe
lineformedbythealkaneswasusedtoensurethequalityofthe data(Fig7–step3).Thisrestrictioncorrelatesquitewellwiththe Henry’szone determined byisotherms analysis, but itwas not exclusive.Indeed,itwasfoundthatforsomesolidsthiscriterion couldbecheckedforlargersurfacecoveragevalues,whichwere not related toisotherm linearity. As an example, in case of
b
mannitol, Henry’s domain is limited to
u
s<10% while a fit ofR2>0.999wereobtainedfor
u
s<40%.It seemsimportanttohighlightthedifficultiestodetermine Henry’sdomain.Indeed,forsolidswithhighsurfaceinteractions, as
a
mannitol, isotherm shape can be quite well described atu
s<30%. For solids with low surface interaction, asb
andd
mannitol,ahighprecisionandcontroloftheinjectedamountis fundamental to determinelinearity domain; so is an adequate numberofexperimentalpoints.
AsitcanbenotedfromFig.9,
b
andd
formsseemtobemore energetically homogeneous than thea
form. Moreover non-significantdifferencesbetweenb
andd
havebeenfound.These resultscanbeinagreementwiththestatementsofHoetal.(2012), wheretheauthorspropose thatthesurfaceenergy distribution does not depend on total surface area of the sample but is dependentonthecontributionofenergeticsitespresentonthe solid.DifferencesobtainedbetweenDVSandIGC-IDanalysesfor
a
mannitol are attributed to the physical sense of each surface energydetermination.TheDVSresultrepresentstheaverageofall energeticssites present in thesolid. Indeed, in DVS analyses a complete coverage of thesolid surfacewas reached and so an averagevalueofthesurfaceenergeticsisexpected.Contrariwise,in IGC-IDstudiesthedispersivesurfaceenergyisgenerallyattributed
0.01 0.02 0.03 0.04 0.05 0.06 0.07 0.08 0.09 0.1 35 40 45 50 55 60 65 70 75 80 Surface coverage Dispersive Surface Energy [mJ/m 2] β form α form δ form
Fig.9.SurfaceheterogeneityanalysisofD-mannitolpolymorphsusingDorrisang Graymodel.
tothehigherenergeticsitesofthesurface.Ifthestudiedsolidis homogeneous, energeticallyspeaking,bothtechniquesare com-parable.Whenthesurfaceheterogeneityisstudied(Fig.9)using IGC-IDtheoryintheHenry’sdomain,wecanseethatthesurface energeticsof
a
mannitolgoesfrom75.7to45.5mJm"2.Thislastvalue is closer but lower than the results obtained by DVS, 51.4*2.9mNm"1.TheseresultsaredifficulttoexplainbecauseIGC analyses were made at really low surface coverage,
u
s<12%,showing a highly heterogeneous surface, for which energetics profile is more influenced by the higher energy sites. Indeed, retentiontimedistributioncanbedescribedas:
tN¼
X
niti¼Xinit0eEi=RTc
with
t
i the residence time on the site i,Ei interaction energybetweentheprobeandthesitei,and
t
0aconstant.Thus,IGCvaluesshouldneverbesmallerthanthoseobtained by DVS. To get more conclusivesurface analysis, heterogeneity should be studied by IGC-FC using the adsorption energy distribution model (Balard, 1997)or/and by contact angle in a macroscopiccrystal.
Fromacriticalpointofview,theinjectionsystemoftheIGC-SEA equipment allows to control the injected amount of vapour molecules, andmoreover,allowstoinjectsmallquantitiesof it. Theseassetshavebeenextremelyimportantinthisworkbecause theywerethekeytodetermineHenry’sdomaininlowspecific surfaceareasolids.However,therearesomepointsthatcannotbe neglectedwhile usingtheSEAequipment todetermine surface energy.Thefirstoneisthatthesurfacecoverageratiodefinedby SMS,n/nm,isameanvaluebasedonthehypothesisthatmolecules
areequallydistributedoverthesurfacesolid.Thisdoesnotreflect reality because of the nature of the chromatographic elution process(Giddings,1965).
ThesecondoneisthattheDorris–GrayorSchultzapproaches have to be applied in the Henry’s law region where lateral molecular interactions arenegligible,andthe thermodynamics functionsdependonlyonadsorbate–adsorbentinteractions(for isothermstypeII,IVandV).Hence,thedeterminationofHenry’s region of the adsorption isotherm should be performed with care, experimental data points should be numerous enough (Fig.7–step1).Anotherpointthatshouldbetakenintoaccount is thatthese methodsare also based on surface homogeneity assumption,soonlyoneenergysiteisexpected.Assumingthat solids are heterogeneous and that the variation of the net retentiontimeinHenry’sregionisduetoamulti-sitessurface,it seems necessary tonoticethatthe
g
ds valueattributedtoeach
surfacecoveragedoesnotcorrespondtoanaverageenergyvalueof thesites“visited”bytheprobesmoleculesandisspecifictoagiven surfacecoverage.Carefulinterpretationofthesenumericalvalues hastobemade.
4. Conclusions
The results obtained enlightened significant differences be-tween bulk and surface properties of D-mannitol polymorphic
system. As each technique provides specificinformation of the solid, the combination of these techniques allows a good understanding of the solid-state form. The combined set DSC and IGC solid-state techniques highlight both surface-bulk energetic differences. Moreover, DSC solid-state analyses were found tobea reliable techniquetodetermineboth polymorph physicalpurityandsorbitoldetectionwithinthesamples.
Surfaceenergyanalysisthroughdynamiccontactanglestudies gives a global idea of solids wettabilityand sohelps todefine solvents of interest for studies by DVS and IGC. Nevertheless, surface energy valuesobtainedfor thecommercialpowdersby
dynamic contact angle were substantially lower than those obtainedbyDVSandIGC.Thesedifferencescanbeattributedto thelowerfitconfidencevalues,R2<0.96,obtainedforallmodels studiedOwens–WendtandFowkes.
DVSanalysiswasnonexploitableformostofthestudiedsolids. Infact,duetothelowadsorptionatlowpressures,
b
andd
forms wereinthedetectionlimits,anditwasnotpossibletoanalyses them.ItseemsthatDVSanalysisisnotsuitablefortheanalysisof solids with low specific surface area and weak adsorbent– adsorbate interactions (adsorption behaviour). Nevertheless, it givesa globalviewof theadsorptionbehaviourbetweenprobe moleculeandthesolid,allowingtodetermineisothermtypeandto quantifythespreadingpressure.IGCstudieshighlighted,withnoprecedentinliterature,surface energy differences between the forms
a
andb
mannitol:a
mannitolrevealed tobemoreenergeticallyactive witha
g
d s of74.9mJm"2(
u
s!0)while
b
mannitolshowedavalueof40.0mJm"2 (
u
s!0) similarto
d
mannitol (40.3mJm"2). These resultsexplainandcorroboratedtheuseof
a
polymorphasadrypowder inhaler(DPI),increasedbyitsneedle-shapemorphology.To study surface heterogeneity by IGC-ID basis, it seems fundamentaltodeterminethezonewhereHenry’slawholds,due tothe fact that all thermodynamics assumptions are based on linear chromatography. Indeed, it seems that for low specific surface areasolids this region is almost not observable,so for reliablesurfaceenergyestimation,aprecisecontroloftheinjected amountiscrucialinordertoobtainverylowsurfacecoverage.It shouldtobenotedthatlowspecificsurfaceareaseemsnottobe theonlyrestrictiontothelimitedHenry'sregion;theinteractions strengthandsurfaceheterogeneityseemtohaveamoresignificant impact.
Thewell-knowninfinitedilution,orlinearchromatography,is definedbyHenry’sregion.IncaseofD-mannitol,thewordlinearin
thesensethat theHenry’scoefficient, K, is independentof the probeconcentrationwasneverobtainedforthe
a
form.Inpractice, theobservedpeaksarequiteasymmetricalanddependentofthe injection size (forboth peak maxima and firstorder moment). Thus,inthewholesenseofitsdefinition,thissodefinedIDregion revealstobeabsentoralmostnon-observable.Surfaceheterogeneityanalysis, in Henry'sdomain,showed a highly heterogeneous
a
mannitol (74.9 to 45.5mJm"2) with aquitehomogeneous
b
andd
mannitol.Moreover,nosignificant differences between these last two forms have been detected (+40–38mJm"2).The influence of size and morphology in surface energy behaviourof D-mannitol polymorphs is the subject of separate
papercurrentlyinpreparation. Acknowledgments
The authorswould like toacknowledge Sylvie delConfetto, Severine Patry and Veronique Nallet for technical support. GratefullyacknowledgestoRoquetteFrancefortheprovisionof thepharmaceuticalssolidsusedinthiswork.
References
Balard, H., Maafa, D., Santini, A., Donnet, J.B., 2008. Study by inverse gas chromatographyofthesurfacepropertiesofmilledgraphites.J.Chromatogr. A1198–1199,173–180.
Balard,H.,1997.Estimationofthesurfaceenergeticheterogeneityofasolidby inversegaschromatography.Langmuir13,1260–1269.
Boudriche,L.,Calvet,R.,Hamdi,B.,Balard,H.,2011.Effectofacidtreatmenton surfacepropertiesevolutionofattapulgiteclay:anapplicationofinversegas chromatography.ColloidsSurf.A392,45–54.
Brum,J.,Burnett,D.,2011.Quantification ofsurfaceamorphouscontentusing dispersivesurfaceenergy:theconceptofeffectiveamorphoussurfacearea. AAPSPharmSciTechnol.12,887–892.
Bruni,G.,Berbenni,V.,Milanese,C.,Girella,A.,Cofrancesco,P.,Bellazzi,G.,Marini,A., 2009.Physico-chemicalcharacterization ofanhydrous-mannitol.J. Therm. Anal.Calorim.95,871–876.
Buckton,G.,Gill,H.,2007.Theimportanceofsurfaceenergeticsofpowdersfordrug deliveryandthe establishmentofinverse gaschromatography. Adv.Drug DeliveryRev.59,1474–1479.
Buckton,G.,1995.InterfacialPhenomenainDrugDeliveryandTargeting.Harwood Academic.
Burger,A.,Hetz,J.,Rollinger,S.,Weissnicht,J.M.,2000.Energy/temperaturediagram andcompressionbehaviorofthepolymorphsof-mannitol.Int.J.Pharm.Sci.89, 457–468.
Caron,V.,Willart,J.F.,Danède,F.,Descamps,M.,2007.Theimplicationoftheglass transitionintheformationoftrehalose/mannitol molecularalloys byball milling.SolidStateCommun.144,288–292.
Chieng,N.,Rades,T.,Aaltonen,J.,2011.Anoverviewofrecentstudiesontheanalysis ofpharmaceuticalpolymorphs.J.Pharm.Biomed.Anal.55,618–644.
Conder,J.R.,Young,C.L.,1977.PhysicochemicalMesuarementsbyGas Chromatog-raphy.JohnWiley,Chichester.
Derminot,J.,1981.Physicochimiedespolymèresetsurfaceparchromatographieen phasegazeuse.Techniqueetdocumentation,Paris.
Dorris,G.,Gray,D.,1979.Adsorptionofn-alkanesatzerosurfacecoverageon cellulosepaperandwoodfibers.J.ColloidInterfaceSci.77,353––362.
Fafard,M.,El-Kindi,M.,Schreiber,H.P., Dipaola-Baranyid,G.,Hore,A.M.,1994. Estimatingsurfaceenergyvariationsofsolidsbyinversegaschromatography.J. Adhes.Sci.Technol.8,1383–1394.
Fowkes,F.M.,1964.Attractiveforcesatinterfaces.Ind.Eng.Chem.56,40–52.
Giddings,C.J.,1965.DynamicofChromatography.MarcelDekkerEditor,London.
Grimsey,I.M.,Sunkersett,M.,Osborn,J.C.,York,P.,Rowe,R.C.,1999.Interpretationof thedifferencesinthesurfaceenergeticsoftwoopticalformsofmannitolby inversegaschromatographyandmolecularmodelling.Int.J.Pharm.Sci.191,43– 50.
Guenette,E.,Barretta,A.,Krausa,D.,Brodya,R.,Hardinga,L.,Mageea,G.,2009. Understandingtheeffectoflactoseparticlesizeonthe propertiesofDPI formulationsusingexperimentaldesign.Int.J.Pharm.380,80–88.
Hao,H.,Su,W.,Barret,M.,Caron,V.,Healy,A.M.,Glenon,B.,2010.Acalibration-free applicationoframanspectroscopytothemonitoringofmannitolcrystallization anditspolymorphictransformation.Org.ProcessRes.Dev.14,1209–1214.
Heng,J.Y.,Thielmann,F.,Williams,D.,2006.Theeffectsofmillingonthesurface propertiesofformIparacetamolcrystals.Pharm.Res.8,1918–1927.
Ho,R.,Heng,R.,2013.Areviewofinversegaschromatographyanditsdevelopment asatooltocharacterizeanisotropicsurfacepropertiesofpharmaceuticalsolids. KonaPowderPart.J.30,164–178.
Ho,R.,Hinder,S.,Watts,J.,Dilworth,S.,Williams,D.,Heng,J.,2010.Determinationof surfaceheterogeneityofmannitolbysessiledropcontactangleandfinite concentrationinversegaschromatography.Int.J.Pharm.387,79–86.
Ho,R.,Naderi,M.,Heng,J.,Williams,D.,Thielmann,F.,Bouza,P.,Keith,A.R.,Thiele, G., Burnett, D., 2012. Effect of milling on particle shape and surface heterogeneityofneedle-shapedcrystals.Pharm.Res.29,2806–2816.
Jaroniec,M.,Madey,R.,1988.PhysicalAdsorptiononHeterogeneousSolids,Studies inPhysicalandTheoreticalChemistry.Ed.Elsevier,Amsterdam,NL.
Lee,L.-H.,1991.FundamentalofAdhesion.PlenumPress,NewYork.
Miyanishi,H.,Nemoto,T.,Mizuno,M.,Mimura,H.,Kitamura,S.,Iwao,Y.,Noguchi,S., Itai,S.,2013.Evaluationofcrystallizationbehavioronthesurfaceofnifedipine soliddispersionpowderusinginversegaschromatography.Pharm.Res.30, 502–511.
Mohammadi-Jam,S.,Waters,K.E.,2014.Inversegaschromatographyapplications:a review. Adv. Colloid Interface Sci. doi:http://dx.doi.org/10.1016/j. cis.2014.07.002.
Nezzal,A.,Aerts,L.,Verspaille,M.,Henderickx,G.,Rendl,A.,2009.Polymorphismof sorbitol.J.Cryst.Growth311,3863–3870.
Owens,D.K.,Wendt,R.C.,1969.Estimationofthesurfacefreeenergyofpolymers.J. Appl.Polym.Sci.13,1742–1747.
Papirer,E.,Li,S.,Balard,H.,Jagiello,J.,1991.Surface-energyandadsorption energy-distributionmeasurementsonsomecarbon-blacks.Carbon29,1135–1143.
Papirer,E.,Brendle,E.,Ozil,F.,Balard,H.,1999.Comparisonofthesurfaceproperties ofgraphite,carbonblackandfullerenesamples:measuredbyinversegas chromatography.Carbon37,1265–1274.
Phuoc,N.H.,PhanTanLuu,R.,Munafo,A.,Ruelle,P.,Nam-Tran,H.,Buchmann,M., Kesselring,U.W.,1986.Determinationofpartialsolubilityoflactosebygas–solid chromatography.J.Pharm.Sci.75,68–72.
Phuoc,N.H.,PhanTanLuu,R.,Munafo,A.,Ruelle,P.,Nam-Tran,H.,Buchmann,M., Kesselring,U.W.,1987.Determinationofpartialandtotalcohesionparameters of caffeine, theophylline, and methyl p-hydroxybenzoate by gas–solid chromatography.J.Pharm.Sci.76,406–410.
Rouquerol,F.,Rouquerol,J.,Sing,K., 1999.AdsorptionbyPowdersandPorousSolids; Principles,MethodologyandApplications.AcademicPress,London.
Rudzinski,W.,Everett,D.H.,1992.AdsorptionofGasesonHeterogeneousSurfaces. Ed.AcademicPressInc.,SanDiego,pp.92101.
Ruthven,D.M.,1984.PrinciplesofAdsorptionandAdsorptionProcesses.JohnWiley &Sons,NewYork.
Saxena,A.,Kendrick,J.,Grimsey,I.,Mackint,L.,2007.Applicationofmolecular modellingtodeterminethesurfaceenergyofmannitol.Int.J.Pharm.343,173– 180.
Storey,R.,Ymén,I.,2011.SolidStateCharacterizationofPharmaceuticals,firsted. Wiley,KingdomUnited.
Surana,R.,Randall,L.,Pyne,A.,Vemuri,M.,Suryanarayanan,R.,2003. Determina-tionofglasstransitiontemperatureandinsitustudyofplasticizingeffectof waterbyinversegaschromatography.Pharm.Res.20,1647–1654.
Tang, P., Chan, H., ChiouOgawa, K., Jones,M.D., Adi,H., Buckton, G., 2009. Characterisationandaerosolisationofmannitolparticlesproducedviaconfined liquidimpingingjets.Int.J.Pharm.367,51–57.
Ticehurst,M.D.,Rowe,R.,York,P.,1994.Determinationofthesurfacepropertiesof twobatchesofsalbutamolsulphate byinversegaschromatography.Int.J. Pharm.111,241–249.
Ticehurst,M.D.,York,P.,Rowe,R.C.,Dwivedi,S.K.,1996.Characterisationofthe surfacepropertiesofa-lactosemonohydratewithinversegaschromatography, usedtodetectbatchvariation.Int.J.Pharm.141,93–99.
Ylä-Mäihäniemi, P., Heng, J., Thielmann, F., Williams, D., 2008. Inverse gas chromatographyc method for measuring the dispersive surface energy distributionforparticulates.Langmuir24,9551–9557.