HAL Id: hal-00845310
https://hal.archives-ouvertes.fr/hal-00845310
Submitted on 29 Jul 2013
HAL is a multi-disciplinary open access
archive for the deposit and dissemination of
sci-entific research documents, whether they are
pub-lished or not. The documents may come from
teaching and research institutions in France or
abroad, or from public or private research centers.
L’archive ouverte pluridisciplinaire HAL, est
destinée au dépôt et à la diffusion de documents
scientifiques de niveau recherche, publiés ou non,
émanant des établissements d’enseignement et de
recherche français ou étrangers, des laboratoires
publics ou privés.
Efficient second harmonic generation in nanophotonic
waveguides for optical signal processing
Kevin Lenglé, Laurent Bramerie, Mathilde Gay, Jean-Claude Simon, Sylvain
Combrié, Gaëlle Lehoucq, Alfredo de Rossi
To cite this version:
Kevin Lenglé, Laurent Bramerie, Mathilde Gay, Jean-Claude Simon, Sylvain Combrié, et al.. Efficient
second harmonic generation in nanophotonic waveguides for optical signal processing. Applied Physics
Letters, American Institute of Physics, 2013, 102, pp.151114. �10.1063/1.4802790�. �hal-00845310�
Optical Signal Processing
K. Lengl´e,1, 2 L. Bramerie,1, 2 M. Gay,1, 2 J-C. Simon,1, 2 S. Combri´e,3 G. Lehoucq,3 and A. De Rossi3,a)1)Universit´e Europ´eenne de Bretagne (UEB), 5 Bld. Laennec, 35000 Rennes,
France
2)CNRS-Foton Laboratory (UMR 6082), Enssat, BP 80518, 22305 Lannion, France 3)THALES Research and Technology, 1 Av. A. Fresnel, 91767 Palaiseau, France
(Dated: 10 April 2013)
We report very efficient second harmonic generation in membrane photonic crystal waveguide. The combina-tion of absorpcombina-tion-free material and slow-light enhancement enables a large harmonic generacombina-tion efficiency. A peak pump power of about 450 mW generates up to 45 µW peak second harmonic power over a broad spectral range. The signal is exploited to demonstrate optical performance monitoring of data at 42 Gb/s.
Harmonic generation and, in particular, Second Har-monic Generation (SHG) is a very important nonlinear effect in optics. Because of their large intrinsic nonlin-ear susceptibility, semiconductor waveguides have been proposed for efficient frequency conversion and harmonic generation1. Furthermore, semiconductors offer a
pow-erful technological platform, enabling the integration of photonic circuits. However, SHG is only possible in non-centrosymmetric materials, such as III-Vs or strained silicon2. More recently, two-dimensional air-cladded
Photonic Crystals (PhC) have emerged as ideal materi-als for enhancing the light-matter interaction, hence the nonlinear response, owing to their remarkable light con-fining capability. In particular, Third Harmonic Genera-tion (THG) has been demonstrated in Silicon PhCs3and,
later, exploited to perform optical signal monitoring4.
SHG has first been observed in InP PhC cavities5and, more recently, in Silicon PhC, where the much weaker second order susceptibility at the semiconductor surface is enhanced resonantly in suitably designed cavities6,
however the SHG power is in the pW range. Efficient SHG is possible in waveguides7, however this is only true
if the phase matching between the fundamental and the second harmonic is ensured, which is notoriously difficult in semiconductors. Indeed, phase-matched optical para-metric interactions (including SHG) have been demon-strated owing to the so-called form-birefringence in al-ternating layers of GaAlAs and oxidized AlAs1, or, more recently, multi-layers of III-V alloys serving as vertical Bragg mirror8 or photonic wires9. It must however be
pointed out that, as in any resonant interaction, phase matching implies a much reduced bandwidth, depend-ing on the length of the interaction. PhCs only support leaky modes at the second harmonic (SH) with short life-time, compared to the fundamental mode. As a conse-quence, the interaction length is much shorter and this tends to reduce the efficiency, with respect to a prop-erly phase matched second harmonic generation process entailing properly waveguided modes. Second harmonic
a)Electronic mail:[email protected]
generation has been demonstrated in short (L=17µm) GaP waveguides10, but, despite the slow-light
enhance-ment, the efficiency was limited to 5 × 10⁻⁷W−1. We demonstrate that the choice of a long waveguide (1.2 mm) enables a larger SHG efficiency 2 × 10⁻⁴W−1, compared to (hence more than two orders of magnitude larger, roughly scaling with the device length), which we exploit to monitor the quality of high-rate data signals (up to 42.5 Gb/s).
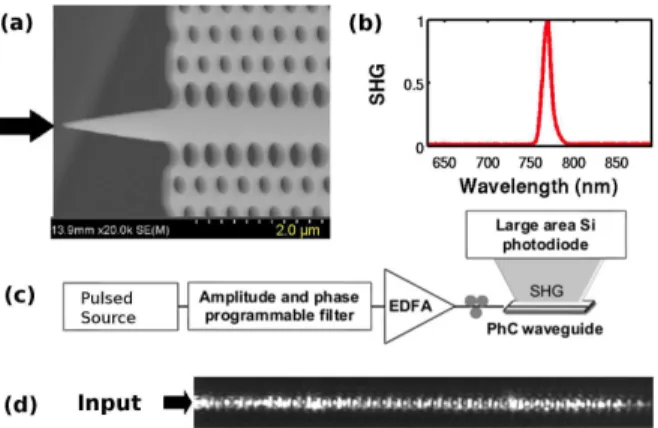
The device is a 1.2 mm-long PhC waveguide made of a self-standing, 180 nm thick membrane of Indium Gal-lium Phoshpide, which is transparent up to photon en-ergy of 1.9eV (λ ≈ 650nm). The waveguide consist in a missing line defect in the regular triangular lattice of holes; the size and the position of the first row of holes have been modified in order to change the dispersion, as shown in ref.11. The input and output fibre are coupled
using tapers12, shown in Fig. 1a. As a result, the total
insertion loss (from the input to the output fibre, hence including coupling and waveguide propagation losses) are reduced to a minimum of about 8 dB, away from the slow light regime, with fluctuations from waveguide to waveg-uide of about 1 dB. Taking into account coupling loss of about 3 dB/facet, we estimate the minimum
propaga-FIG. 1. (a) SEM image of the PhC waveguide with taper at the input; (b) detected SHG spectrum; (c) experimental set-up; (d) Optical image of the entire waveguide using a Silicon-CCD, revealing the SHG emission.
2 tion loss to less than 2 dB/mm. Thus, in this regime,
the pump intensity is weakly attenuated constant over the whole device length.
The optical input are 100 ps pulses generated from a continuous-wave tunable diode laser and a Mach-Zenhder (MZI) modulator. As the peak power is above hundreds of mW, the radiation emitted from the top of the waveg-uide is easily detected by a standard silicon CCD camera, as shown in Fig. 1c,d. The peak at 770 nm of the emit-ted spectra, collecemit-ted with a large aperture optical fibre (NA≈ 0.5), is consistent with SHG from the pump input centered at 1540 nm (Fig. 1b). Photonic crystal waveg-uides are highly dispersive and it is therefore expected that the SHG has a complex dependence on the wave-length.
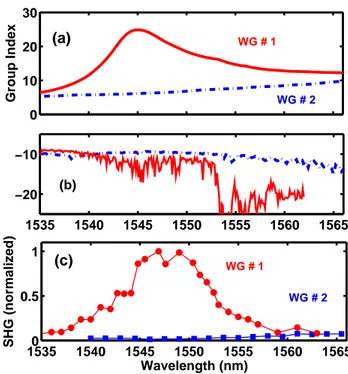
In order to elucidate this point, we consider two differ-ent waveguide designs (see ref.11) and we report the SHG
signal as a function of the wavelength. This is shown in Fig. 2a. First we note that waveguide #1 reveals an abrupt increase of the group index from a minimum of about 6 to 24, while in waveguide #2 the group index increases slowly from 5 to about 10. A slow-light en-hancement of the SHG is expected, similarly to what has been reported for Third Harmonic Generation in Pho-tonic Crystals3. More precisely, the theory of SHG in
PhC13 predicts a quadratic dependence of the SHG effi-ciency (η = PSH/P2
F F) on the group index of the funda-mental mode ngf, which can be cast as:
η ∝ d2ef fω2 n2
gfngs
Aef f (1)
Here, def f is the relevant projection of the second order susceptibility (for GaInP 110 pm/V was reported in the spectral range considered here14), Aef f is the nonlinear
cross section related to the field distribution, which co-incides with the geometrical cross section in the limit of plane waves. Indeed, Fig. 2c reveals a very strong depen-dence of the SHG signal on the wavelength, as well as a very strong correlation with the group index. Moreover, this holds for both waveguides, in spite of their different design and dispersion. A more careful inspection of the figure reveals that the peak of efficiency does not coincide with the peak of the group index. This is not surprising, because of the complex dependence of the SHG on var-ious parameters. Moreover, it must be pointed out that a local minimum (-6dB of additional loss, Fig. 2b) of the transmission is located at the local maximum of the group index, thereby compensating for the slow-down en-hancement.
This is remarkable, as, given the complex structure of the high frequency bands of the PhC, one would ex-pect a strong dispersive contribution both from Aef f and ∆k. Yet, a similar correlation of the SHG with the group index has been reported in third harmonic generation in photonic crystal waveguides15. The reason why the phase mismatch term is not playing a role as crucial as it is com-mon in nonlinear waveguides is elucidated in ref.15. Here
it is shown that a (quasi) phase-matching condition is
in-0 10 20 30 Group Index 15350 1540 1545 1550 1555 1560 1565 0.5 1 Wavelength (nm) SHG (normalized) 1535 1540 1545 1550 1555 1560 1565 −20 −10 (b) WG # 1 WG # 2 (a) (c) WG # 1 WG # 2
FIG. 2. (a) Dispersion (group index vs. wavelength) for two different samples (#1,#2); (b) Corresponding transmission spectra; (c) Corresponding detected SHG signal from the top, divided by the square of the coupled pump power.
deed governing the nonlinear interaction. Here, ”quasi” is referred to the fact that the interaction length L is typically much shorter than the device length, due to the short propagation length of the Bloch modes at the SH frequency. The short interaction length eases the phase-matching condition. We believe that this also holds for the SHG process in our waveguides.
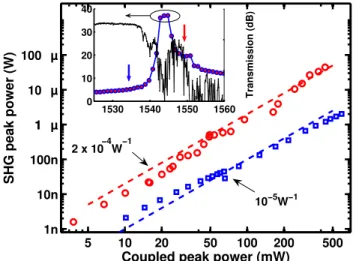
Quantitative measurements of the SHG efficiency have been performed on sample #3 with pump wavelength set at λ = 1535 nm and λ = 1550 nm (slow light regime). A large area Si photodiode, mounted on top of the waveg-uide with effective collection half angle of 73 degrees, was used to measure the SHG. The coupled input peak power is increased from 10 mW up to about 1W. From 10mW to 100mW a 10 Gbit/s Non Return to Zero (NRZ) Pseudo Random Binary Sequence (PRBS) is set such that the duty cycle is 0.5. Under these conditions, the waveguide dispersion is always negligible. At larger input power, the duty cycle is decreased to 1/20. The SHG peak power (Fig. 3) nicely scales with the square of the pump power over 4 orders of magnitude at least. The deviation from the ideal square law are partly due to the residual drift of the MZ modulator, leading to change in the transmitted power, but also to some thermal effects. The normal-ized efficiency η, referred to the peak values of the op-tical power (both for FF and SH), is equal to 10−5W−1 when the pump wavelength is 1535 nm, and increases to about 2 × 10⁻⁴W−1 at a wavelength of 1550 nm, hence a 20-fold enhancement, corresponding to roughly a 4-fold enhancement of the group index. This is consistent with
the square scaling discussed above, also considering that losses and the nonlinear cross section (Aef f) also play a role here. In particular, propagation losses, which are highly dispersive in PhCs, tend to be large at the lo-cal maximum of ng(1545 nm), as shown in Fig. 3, inset. This explains why a larger efficiency is found at a slightly longer wavelength. The table I provides a summary of recent achievements in SHG in integrated optics. In or-der to allow a fair comparison, we translate the reported values into the conversion efficiency η, where the pump power refers to the peak value in pulsed experiments. As the devices have very different geometries, we report their length. The maximum SH is reported as a peak value in pulsed experiments. Where available, the SHG band-width, referred to the pump wavelength, is also reported. The bandwidth is defined as the tuning range of a CW pump (see Parameswaran et al.7). In the case of
cavity-enhanced SHG, the bandwidth is λ/Q. Finally, it must be pointed out that external conversion efficiencies have been reported here (except for Abolghasem et al.18). A
proper correction for the extraction efficiency is too com-plicated to be carried out consistently.
In terms of the generated SHG power, the maxi-mum achieved here is 45µW (peak), which is orders of magnitude larger than any previous results in nanopho-tonic devices. Only Bragg waveguides18 enable larger peak SHG, however, the conversion efficiency η is very low. In contrast the normalized efficiency we report here η = 2 × 10⁻⁴W−1 is 2 orders of magnitude larger than what reported in III-V PhC waveguides10and one order
of magnitude larger than Si cavities, still offering a large bandwidth (Fig. 2b). In semiconductor photonics, only AlGaAs wires and waveguides offer better efficiency, but
FIG. 3. Waveguide # 3. SHG peak power vs. coupled pump peak power for λp= 1535 nm (blue, squares) and λp= 1550
nm (red, crosses). The corresponding square laws PSH =
η(ng)PF F2 are shown (dashed lines). The duty cycle is 1/2
at low coupled peak power (below 70 mW) and 1/20 at high peak power. The corresponding dispersion and transmission of the waveguide is shown in the inset.
TABLE I. Comparison of SHG in various integrated optics devices.
Technology L(mm) η (W−1) P
SH (peak) BW ref.
LiN bO3 wg 60 14 large >0.25 nm 7
GaP PhC wg 0.017 5 × 10⁻⁷ 1 nW N.A. 10
InP PhC cav. N.A. N.A. 10 fW N.A. 5
SiPhC cav. N.A. 4 × 10⁻⁵ 50 fW 50 pm 6
GaN µ-ring N.A. 2 × 10⁻⁴ 2 µW 0.5 nm 9
AlGaAswires 1.2 2 × 10⁻³ 80 pW N.A. 16
AlGaAswg 1.5 7 × 10⁻³ 1.5 nW 0.3 nm 17
AlGaAswg 2.2 2 × 10⁻⁷ 190 µW 0.8 nm 18
this work 1.2 2 × 10⁻⁴ 45 µW
≈10 nm
at the expense of a narrower bandwidth. Only Lithium-Niobate waveguide technology enable much larger effi-ciency and almost 100% conversion7, still with a
rela-tively large bandwidth. It must be pointed out, however, that the integration of LiN bO3 waveguides with semi-conductor photonics is not straightforward.
The level of the generated optical signal is more than convenient to implement optical performance monitoring of an amplitude-coded signal19. The main idea is that
the second harmonic generation being dependent on the peak to average power ratio, which is easily connected to the noise level, as well as to the dispersion-induced pulse broadening. In the following, we proceed simi-larly as Corcoran et al., who implemented this concept by exploiting the third harmonic generation in photonic crystals4.
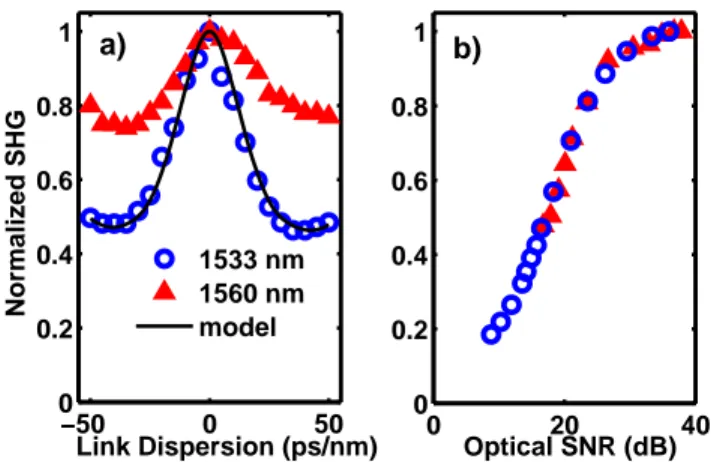
We consider a Return to Zero data signal at 42.5 Gb/s with duty cycle = 33%. Under these conditions, the (average) SHG signal is 0.3 µW , 25 dB above the noise floor. This holds when the pump wavelength is be-tween 1530 nm and 1540 nm. In particular, at 1533 nm, the dispersion of the sample used here (wg #4) is about −0.7ps2/mm and the group index is about 17. The coupled average power is 30 mW. As a comparison, we also considered another wavelength (1560 nm) as the worst case, where the waveguide enters into propagation regime caracterized by strong attenuation and multiple scattering20.
We first characterized the impact of the dispersion. A programmable phase and amplitude optical filter is used to introduce a linear chirp (thereby simulating the prop-agation through a dispersive link) and an attenuator is used to decrease the Optical Signal to Noise Ratio. Fig-ure4a reports the dependence of the SHG on the amount of dispersion introduced, while the average input power is kept constant. As expected, this results into a pro-nounced decrease of the SHG signal. Interestingly, we observe a periodic behavior with the dispersion, which is due to the temporal Talbot effect19,21, thereby implying
that the pulse train re-emerges again from a highly dis-persed signal.
The impact of the dispersion on the SHG process has been modelled, with remarkable agreement with the
ex-4 −50 0 50 0 0.2 0.4 0.6 0.8 1 Link Dispersion (ps/nm) Normalized SHG 0 20 40 0 0.2 0.4 0.6 0.8 1 Optical SNR (dB) 1533 nm 1560 nm model a) b)
FIG. 4. Waveguide #4. Dependence of the SHG signal on the link dispersion (a) and on the optical signal to noise ratio (b). The signal center wavelength is either 1533 nm (circles) or 1560 nm (triangles).
perimental results, in particular at 1533 nm. The mea-surement at longer wavelength (1560 nm) deviates from the model, which is not surprising as the waveguide has very bad propagation properties here. Yet the plot keeps its bell-like shape. Fig. 4b connects the SHG signal to the optical SNR, the input average power being constant. The same monotonic increase of the SHG signal with the OSNR is observed independently on the wavelength, e.g. over the whole telecom C-band. In ref.4similar
measure-ments have been performed with a sensitive photodiode which detected a monitoring signal level of about 10pW, whereas our GaInP waveguide generates 300nW (aver-age) from a roughly similar input power level. We infer therefore that the monitoring of signals with -20 dB lower power level should be possible, e.g. with peak power in the 1 mW range.
In conclusion, we report broadband and efficient SHG (45 µW , with 450 mW coupled peak power and with 3dB bandwidth of about 10 nm) in a Photonic Crys-tal waveguide. The normalized conversion efficiency is 2 × 10⁻⁴W−1, which, owing to the very strong optical confinement and the slow-light enhancement, is very high for a nanophotonic device. The SHG signal has been used to monitor the OSNR and the chromatic dispersion of a high bit rate (42.5 Gb/s RZ) signal over the entire C-band.
We acknowledge the support by the European Union,
FP7/ICT funding program, under the Copernicus project (249012) (www. copernicusproject.eu). This work is also supported by Region Bretagne. We thank I. Sagnes for assistance with sample processing, P. Colman for contri-butions early on, S. Trillo and Y. Dumeige for enlighten-ing discussions.
1A. Fiore, V. Berger, E. Rosencher, P. Bravetti, and J. Nagle, Nature 391, 463 (1998).
2M. Cazzanelli, F. Bianco, E. Borga, G. Pucker, M. Ghulinyan, E. Degoli, E. Luppi, V. Vniard, S. Ossicini, D. Modotto, S. Wab-nitz, R. Pierobon, and L. Pavesi, Nat Mater 11, 148 (2012). 3B. Corcoran, C. Monat, C. Grillet, D. J. Moss, B. J. Eggleton,
T. P. White, L. O’Faolain, and T. F. Krauss, Nat. Photon. 4, 206 (2009).
4B. Corcoran, C. Monat, M. Pelusi, C. Grillet, T. White, L. OFao-lain, T. Krauss, B. Eggleton, and D. Moss, Optics express 18, 7770 (2010).
5M. W. McCutcheon, J. F. Young, G. W. Rieger, D. Dalacu, S. Fr´ed´erick, P. J. Poole, and R. L. Williams,
Phys. Rev. B 76, 245104 (2007).
6M. Galli, D. Gerace, K. Welna, T. F. Krauss, L. O’Faolain, G. Guizzetti, and L. C. Andreani,
Opt. Express 18, 26613 (2010).
7K. R. Parameswaran, R. K. Route, J. R. Kurz, R. V. Roussev, M. M. Fejer, and M. Fujimura,Opt. Lett. 27, 179 (2002). 8A. S. Helmy,Opt. Express 14, 1243 (2006).
9C. Xiong, W. Pernice, K. K. Ryu, C. Schuck, K. Y. Fong, T. Pala-cios, and H. X. Tang,Opt. Express 19, 10462 (2011).
10K. Rivoire, S. Buckley, F. Hatami, and J. Vuckovic,
Applied Physics Letters 98, 263113 (2011).
11P. Colman, S. Combri´e, G. Lehoucq, and A. D. Rossi,
Opt. Express 20, 13108 (2012).
12Q. V. Tran, S. Combri´e, P. Colman, and A. D. Rossi,
Applied Physics Letters 95, 061105 (2009).
13R. Iliew, C. Etrich, T. Pertsch, and F. Lederer, Phys. Rev. B 77, 115124 (2008).
14Y. Ueno, V. Ricci, and G. I. Stegeman,
J. Opt. Soc. Am. B 14, 1428 (1997).
15C. Monat, C. Grillet, B. Corcoran, D. J. Moss, B. J. Eggleton, T. P. White, and T. F. Krauss, Opt. Express 18, 6831 (2010). 16D. Duchesne, K. A. Rutkowska, M. Volatier, F. L´egar´e, S.
Del-prat, M. Chaker, D. Modotto, A. Locatelli, C. D. Angelis, M. Sorel, D. N. Christodoulides, G. Salamo, R. Ar`es, V. Aimez, and R. Morandotti,Opt. Express 19, 12408 (2011).
17S. Ducci, L. Lanco, V. Berger, A. D. Rossi, V. Ortiz, and M. Cal-ligaro,Applied Physics Letters 84, 2974 (2004).
18P. Abolghasem, J. Han, B. J. Bijlani, and A. S. Helmy,
Opt. Express 18, 12681 (2010).
19S. Wielandy, M. Fishteyn, and B. Zhu,
Lightwave Technology, Journal of 22, 784 (2004).
20M. Patterson, S. Hughes, S. Combri´e, N.-V.-Q. Tran, A. D. Rossi, R. Gabet, and Y. Jaou¨en, Physical Review Letters 102, 253903 (2009).