A STUDY OF VACUUM FREEZE-DRYING OF FROZEN WET PAPERS
A.Carapelle*, M.Henrist, F.Rabecki Centre Spatial de Liège, Université de Liège Avenue Pré Aily, B-4031 Angleur, Belgium
Key Words and Phrases: moisture; vacuum freeze-drying; wet paper
ABSTRACT
Vacuum freeze-drying of frozen wet papers was investigated experimentally. A freeze-drying facility was built to study the process by monitoring the various physical parameters (pressure, sample temperature, heater temperature, water content of the sample and cold panel temperature). A simple phenomenological model was developed to explain experimental results. The values of the physical parameters were optimized to make the process cost effective.
INTRODUCTION
Studies of Vacuum freeze-drying of wet paper have previously been reported several times [1]. The process was studied mainly in large vessels, which were required to treat large amount of wet paper resulting from disasters and accidents such as broken water pipes, fires, and floods. At the Centre Spatial de Liège (a coordinated facility of the European Space Agency (ESA)), large vacuum vessels, ordinarily used to test satellites, have been used for freeze-drying of wet paper on several occasions [2].
*Corresponding author.
A smaller vacuum vessel set-up was later built for this study. It was intended as a research and development facility for the purpose of optimizing the freeze-drying process. Its design allowed for the monitoring of the key parameters necessary to acquire a better understanding of the process. After a brief description of this set-up, we will present the observed results and propose a simple model to describe the freeze-drying of wet paper.
EXPERIMENTAL SET-UP
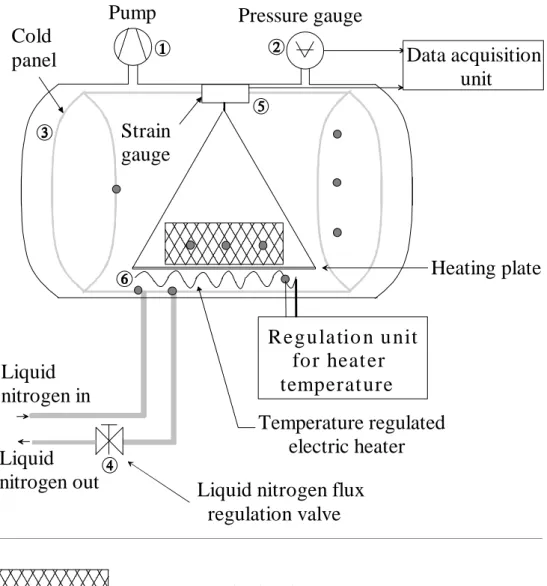
FIGURE 1 shows the set-up built to study the freeze-drying process.
The vacuum vessel is a 0.5 m3 steel tank. The pumping unit is a two-stage pump À with a pumping capacity of 30 m3/hour. The pressure was measured by a Penning sensor Á combined with a COMBITRON display unit.
Water vapor was condensed on a cold panel  filled with liquid nitrogen (LN2). The LN2 flux was regulated by a manual valve Ã. Changing the flux modified the cold panel temperature. The sample of paper was installed on a strain gauge Ä to monitor the losses of weight (and consequently to monitor the ice content). The energy needed to sublime the ice was provided by a temperature regulated electric heater Å. Data acquisition was performed using a data logging system connected to a computer.
The temperature sensors (Type T thermocouples) were attached at selected locations: three ones on the cold panel (in the middle, at the LN2 input and output), four ones inside the sample, one to the electric heater, another one to the sample-holder, and a last one to the weight sensor. The temperature sensors accuracy was 0.5 °C.
PROCEDURE
The following parameters were monitored during a complete freeze-drying cycle: the temperature and water content of the sample, the pressure in the vessel, the temperature of the cold panel, and that of the electric heater. All parameters were recorded during the entire experiment. Fifteen vacuum freeze-drying cycles of frozen wet papers were carried out.
The paper samples were weighted then soaked in water for several hours to ensure that the water content was maximal. The temperature sensors were then inserted inside the sample, and the papers were frozen with the sensors inside. The frozen block was installed in the freeze-drying vessel and its weight was monitored to determine the ice content. We stopped the process when the ice content was small enough (about 15 days for the longest experiment). The ice content did not reach zero; it would have taken a very long time to reach a zero content of ice.
The temperatures in the sample were recorded. The cold panel temperature was adjusted by controlling the liquid nitrogen flux. The electric heater temperature was controlled and tuned by a temperature regulation unit (OMRON).
All data were acquired and stored in the datalogging system. Sampling time was one minute.
RESULTS
The triple point of water is at PTr. = 6 mbar and TTr. = 0 ° C. Liquid water
damages paper, so the pressure inside the vessel must be kept under 6 mbar.
The temperature of cold panel must be lower than that of the frozen wet paper (around -20°C) for water vapor to condense on the cold panel. Asaeda [3] previously showed that, at constant sample temperature, the total freeze-drying time decreased as the cold panel temperature decreased. His work concerned porous materials. We observed that for a large solid sample (a frozen book), the diminution of the temperature of the cold panel speeded up only the early stage of the vacuum freeze-drying process. In fact, only the first few millimeters of ice sublimed faster when the cold panel temperature decreased. This was mainly due to the fact that the heat transfer rate through paper is slower than the vapor diffusion.
The temperature sensor, frozen inside the paper, measured the temperature of the sample. The temperature inside the sample was approximately constant even if that of the cold panel or that of the heater was changing. The temperature inside the sample was -20±5 °C (-20 °C was the average value. Fluctuations of ±5 °C were observed due to the temperature regulation of the heater).
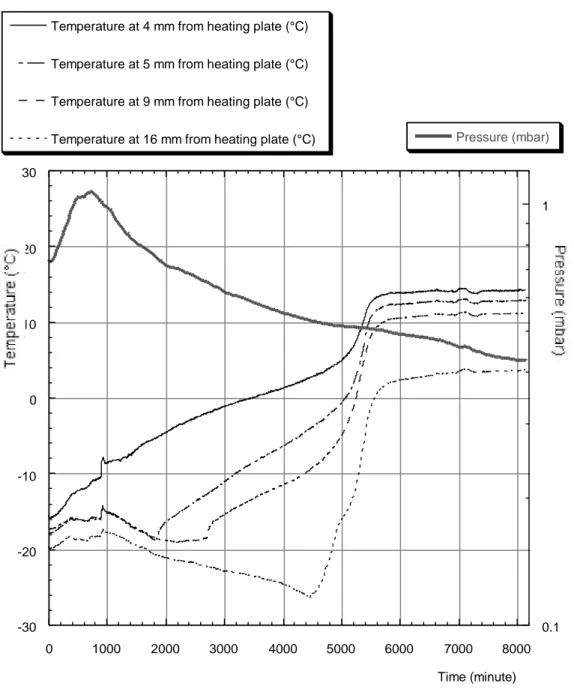
Since the temperature of the sample was approximately constant, an increase in the heater temperature meant that the heat transfer rate was higher and the time required for vacuum freeze-drying was reduced. We observed that the maximum temperature allowed for the support holding the sample was 30±2 °C. Paper was damaged at higher temperatures. The heater was thus regulated to maintain the temperature of the support at 25±2 °C. FIGURE 2 gives the temperature curves of the sensors frozen inside a 220 X 150 X 22 mm sample and the pressure curve inside the vessel.
Two other points must be mentioned even if they are not directly related to the vacuum freeze-drying process. We observed that the technique used to freeze wet paper was important. We compared the quality of papers frozen with a classical deep freezer (several hours needed to freeze the sample) or with a "blast freezing" method (sample frozen in less than two minutes). The "blast freezing" method used liquid nitrogen to freeze the paper. The blast-freezed paper had a better quality and better mechanical properties (sample submitted to traction test) after drying. This was explained by the fact that ice crystals were smaller when water had been frozen faster.
The second point was that after vacuum freeze-drying, the relative humidity inside the sample was only 5 % at 20°C. Paper with such small moisture content was brittle. Normal paper has a relative humidity of 50 % at 20 °C and in an ambient relative humidity of 50 %. Thus we had to let the paper in normal atmosphere and wait for a 50 % relative humidity to be reached inside the paper before any handling.
PHENOMENOLOGICAL MODEL
We developed a simple phenomenological model to describe the loss of ice content in the sample as a function of time. This was a significant parameter to study because we wanted to predict the time needed to reach a certain loss of ice content. Since the use of large vacuum vessels is expensive, it is important to predict the ice content of a given sample at a given time. This model was verified experimentally by using the weight sensor to monitor the ice content of the sample.
The model was based on the main idea that the vacuum freeze-drying of frozen wet books was a two-step process. The first step consisted in the sublimation of the ice at the surface; it occurred as a rapid process. The thickness of this "surface ice" was measured to be about 4 mm. The second step was the sublimation of the ice inside the sample. We called that step "the ice core sublimation". The presence of the ice core was confirmed by using the temperature sensors inside the sample (see FIGURE 2). Such an ice core had been predicted and observed by Asaeda [3]. The sublimation of the ice core was a slow process; it is mainly ruled by the heat transfer within the sample. The heat transfer was slower than the vapor diffusion inside the sample (diffusion of water vapor through paper was studied by Nilsson [4]). Our model was based on the sublimation of the ice core process only.
It was developed from to the followings elements:
- The ice core had the same shape than the original sample (and same proportions). - The heat transfer was a predominant process.
- The ice core receded during the process but its shape remained the same.
- The heat flux was proportional to the area of the core surface facing the heating plate (sample support).
- The heat flux was proportional to the inverse of the distance between the core and the heating plate.
- The thermal conductivity of paper was proportional to its density as previously showed by Nederveen [5].
- The ice core remained at the center of the sample. - The ice core was mainly composed of ice.
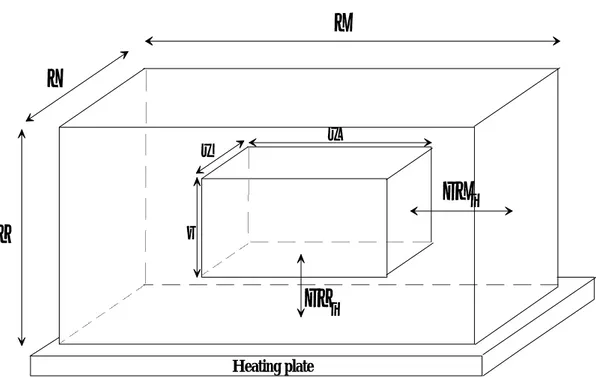
The model was based on an iterative calculation. At each step, we calculated the time required to transfer enough energy to sublime one gram of ice. Then we calculated the size and position of the ice core. FIGURE 3 shows the geometrical considerations used in the model (where X,Y,Z,x,y and z stand for the dimensions (m) of the sample and of the ice core respectively)
In our model we consider that the ice core remains at the center of the sample, so we have: 2 x 2 X X= − ∆ (1) 2 y 2 Y Y= − ∆ (2)
2 z 2 Z Z= − ∆ (3) Therefore: − ∆ = X 2 X . 2 x (4) − ∆ = Y 2 Y . 2 y (5) − ∆ = Z 2 Z . 2 z (6)
As the ice core has the same shape than the original sample (and same proportions), we can write: x y X Y R x z X Z R YX ZX = = = = Therefore: z=x.RZX (7) y=x.RYX (8)
The heat flux, coming from the heating plate, reaches the ice core through the base surface of the ice core. The area S of the base surface is given by (using eq. (8)):
YX 2 R . x y . x S= = 2 YX X 2 X . R . 4 S − ∆ = ⇒ (9)
Where we used eq. (1).
The heat flux reaching the ice core is given by:
Z T . S . k t Q ∆ ∆ − = ∆ ∆ (10)
∆t is the time interval (s).
k is the thermal conductivity of paper (W/mK) given by Nederveen [5].
∆T is the temperature difference between the heating plate and the ice core.
∆Z is the distance between the heating plate and the ice core.
Introducing eq. (9) into eq. (10) and using eq. (3), (7) and (4) we obtain:
− ∆ − − ∆ ∆ − = ∆ ∆ X 2 X . R . 2 Z X 2 X . T . R . k . 8 t Q ZX 2 YX (11)
The power P (in Watt) needed to sublime one gram of ice is given by:
t L
P= (12)
where L is the latent heat of sublimation of ice (J/g). The time t needed to sublime one gram of ice is:
P L
t= (13)
where P is the amount of heat transferred in a certain time. From eq (13) and (11), we can write: 2 YX ZX X 2 X . T . R . k . 8 X 2 X . R . 2 Z . L t − ∆ ∆ − − ∆ − = (14)
This equation gives the time needed to sublime one gram of ice when the ice core is at a position given by the parameter ∆X and when the temperature difference between the ice core and the heating plate is ∆T.
We will now calculate the size and the position of the ice core given by the parameter ∆X. This position can be calculated after the sublimation of each gram of ice.
Let us call V the volume (m3) of the ice core at a given time t. At the time t'>t, the core ice will have lost one gram of ice and the volume will be V'. As we supposed that the core ice is mainly composed of ice, we have:
V-V' = ρ− 1 (15) Where ρ is the density of ice (g/m3).
Let x, y and z be the dimensions of the ice core at the time t and x', y' and z' the dimensions of the ice core at the time t'. We can write:
V=x.y.z (16)
V'=x'.y'.z' (17)
As the ice core keeps the same shape and the same proportions as the original sample, we have: ' x ' z RZX = (18) ' x ' y RYX = (19) Therefore: z'=x'.RZX (20) y'=x'.RYX (21) Combining eq (15), (16), (17), (7) and (8) leads to:
x3.RYX.RZX-x'.y'.z'=ρ− 1 (22)
With eq. (20) and (21), we can write:
RYX.RZX.(x3-x'3)= ρ− 1 (23)
Let us call ∆x=(x-x')/2, we can write:
2 ' x x 2 x =∆ + (24)
If ∆X' is the position of the ice core at the time t', we have
∆X'=∆X+∆x (25)
Therefore:
where ∆x is the "increment" of the x coordinate of the ice core when the time increases from t to t'. From eq. (24), we have:
− ∆ = x 2 x . 2 ' x (27)
Combining eq. (27) and (23), we have:
3 ZX YX 3 ? . R . R 1 x . 2 1 2 x x= − − ∆ (28)
Using eq. (4) and (28), we have:
3 ZX YX 3 ? . R . R 1 X 2 X . 8 . 2 1 X 2 X x − − ∆ − ∆ − = ∆ (29)
Introducing eq. (26) in eq. (29), we can write:
3 ZX YX 3 ? . R . R 1 X 2 X . 8 2 1 2 X ' X − − ∆ − = ∆ (30)
If we use eq. (14) and eq. (30) in an iterative way, we can calculate the time needed to sublime each gram of ice (from eq. (14)) and the position (from eq. (30)) of the ice core after this sublimation. The iterative forms of the eq. (30) and (14) are presented hereafter: 3 YX ZX 3 i 1 i ? . .R R 1 X 2 X . 8 2 1 2 X X − − ∆ − = ∆ + (31) T . X 2 X . .k.R 8 X 2 X .2. R -Z L. ) X ( t 2 i YX i ZX i i ∆ − ∆ − − ∆ = ∆ (32)
The presented model has limitations. Firstly, it only considers the second part of the freeze-drying process, i.e. the sublimation of the ice core, and secondly the validity is limited because it predicts that when the ice core has almost vanished, the time needed to sublime one gram of ice will be infinite.
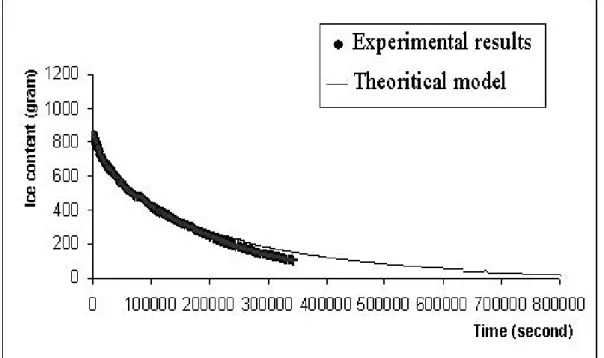
The loss of ice as a function of time predicted by our model, is similar to the one obtained by Mascarenhas [6] with a finite element analysis of freeze-drying. Moreover, further experiments showed a good agreement with the model. FIGURE 4
shows the correlation between experimental values and predictions for a 246 X 150 X 36 mm sample. In this figure, the experimental curve width includes the errors bars. We can see that our model is in good agreement with the experimental results. The model was still applicable (deviation < 5 %) after 3 days (259200 seconds) of freeze-drying.
It is to be noted that our model is valid only for the sublimation of the ice core. In fact, the first few millimeters of ice at the surface are quickly sublimated and our model did not take this phase into account.
The use of such a model was useful to investigate the influence of the geometrical parameters of the sample. Following large floods, a large amount of paper must be quickly frozen, the actual size of frozen bundles has therefore much importance on the time needed for the vacuum freeze-drying. Our model could predict the evolution of the freeze-drying process. As the use of a large vacuum vessels is expensive, it is important to be able to predict the evolution of the process for cost-effectiveness.
CONCLUSIONS
An experimental set-up was built to study the vacuum freeze-drying of frozen wet papers. Optimal parameters were determined to reduce the time and cost of freeze-drying. A simple model was developed to predict the evolution of the process and to help further investigations.
ACKNOWLEDGEMENTS
This study was funded by the Walloon Region DGTRE department. It was combined with a study of gaseous disinfection of damaged wet papers.
REFERENCES
1. McCleary, J.M., 1988, La lyophilisation appliquée au sauvetage des livres et documents endommagés par l'eau : une étude RAMP accompagnée de principe directeurs, Programme général d'information et UNISIST, Paris,
PGI-87/WS/7.
2. Henrist, M. and Pieyns-Rigo, P., 1993, Un cas exemplaire de sauvetage par lyophilisation d'archives inondées, Conseil International des archives, JANUS, Vol I p 82.
3. Asaeda, M. and Hara, M., 1985, Freeze-drying mechanisms and drying rate under various drying conditions, Proceedings of the 4th International Drying Symposium, pp 268-274.
4. Nilsson, L., Wilhelmsson, B. and Stenström, S., 1993, The diffusion of water vapour through pulp and paper, Drying Technology, 11(6), pp 1205-1225. 5. Nederveen, C.J. and Finken, J.G.M., 1992, Thermal conductivity
measurements on wet paper samples at high temperatures, Drying Technology, 10(1), pp 189-198.
6. Mascarenhas, W.J., Akay, H.U. and Pikal, M.J., 1997, A computational model for finite element analysis of the freeze-drying process, Computer methods in applied mechanics and engineering, 148, 105-124.
LIST OF FIGURES FIGURE 1. Experimental set-up schematics.
FIGURE 2 Temperatures inside the sample and pressure inside the vessel during a typical experiment.
FIGURE 3 Geometrical considerations used in the model. FIGURE 4 Theoretical and experimental results.
Pump
Pressure gauge
Strain
gauge
Cold
panel
Liquid
nitrogen in
R e g u l a ti o n u n i t
for heater
temperature
Liquid nitrogen flux
regulation valve
Liquid
nitrogen out
Data acquisition
unit
: Temperature sensor (Thermocouple T type )
connected to the data acquisition unit
: Frozen sample (book)
Temperature regulated
electric heater
Heating plate
-30 -20 -10 0 10 20 30 0.1 1 0 1000 2000 3000 4000 5000 6000 7000 8000
Temperature at 4 mm from heating plate (°C) Temperature at 5 mm from heating plate (°C) Temperature at 9 mm from heating plate (°C)
Temperature at 16 mm from heating plate (°C) Pressure (mbar)
Time (minute)
FIGURE 2 Temperatures inside the sample and pressure inside the vessel during a typical experiment
FIGURE 3 Geometrical considerations used in the model Heating plate