PAPER
A benchmarking protocol for breath analysis: the
peppermint experiment
To cite this article: Ben Henderson et al 2020 J. Breath Res. 14 046008
View the article online for updates and enhancements.
Recent citations
Impact of the adsorbent material on volatile metabolites during in vitro and in vivo bio-sampling
Flavio A. Franchina et al
J. Breath Res. 14 (2020) 046008 https://doi.org/10.1088/1752-7163/aba130
Journal of Breath Research
OPEN ACCESS
RECEIVED
1 April 2020
REVISED
24 June 2020
ACCEPTED FOR PUBLICATION
30 June 2020
PUBLISHED
31 July 2020
Original content from this work may be used under the terms of the Creative Commons Attribution 4.0 licence. Any further distribution of this work must maintain attribution to the author(s) and the title of the work, journal citation and DOI.
PAPER
A benchmarking protocol for breath analysis: the peppermint
experiment
Ben Henderson1,19 , Dorota M Ruszkiewicz2,3 , Max Wilkinson4 , Jonathan D Beauchamp5 , Simona M Cristescu1 , Stephen J Fowler4 , Dahlia Salman2 , Fabio Di Francesco6 , Gudrun Koppen7 , Jens Langejürgen2 , Olaf Holz8 , Andria Hadjithekli2 , Sergi Moreno9 , Michele Pedrotti10 , Pablo Sinues11 , Gitte Slingers7,12 , Michael Wilde13 , Tommaso Lomonaco6 , Delphine Zanella14 , Renato Zenobi15 , Jean-François Focant14 , Stanislas Grassin-Delyle16, Flavio Antonio Franchina14
, Michaela Mal´askov´a17
, Pierre-Hugues Stefanuto14
, Giovanni Pugliese18
, Christopher Mayhew3,17
and C L Paul Thomas2 1 Exhaled Biomarkers and Exposure, Department of Molecular and Laser Physics, IMM, Radboud University, Nijmegen,
The Netherlands
2 Centre of Analytical Science, Department of Chemistry, Loughborough University, Loughborough, United Kingdom 3 Molecular Physics Group, School of Physics and Astronomy, University of Birmingham, Birmingham, United Kingdom
4 School of Biological Sciences, Faculty of Biology, Medicine and Health, University of Manchester, Manchester Academic Health Science Centre and NIHR Manchester Biomedical Research Centre, Manchester University Hospitals NHS Foundation Trust, Manchester, United Kingdom
5 Department of Sensory Analytics, Fraunhofer IVV, Freising, Germany
6 Department of Chemistry and Industrial Chemistry, University of Pisa, Pisa, Italy 7 Environmental Risk and Health, Toxicology, VITO, Boeretang, Belgium
8 Fraunhofer ITEM, German Center for Lung Research (BREATH, DZL) Clinical Methods Development Group, Hannover, Germany 9 National Physical Laboratory, Teddington, United Kingdom
10 Edmund Mach Foundation & Wageningen University, Trentino, Italy
11 University Children’s Hospital Basel, Department of Biomedical Engineering, University of Basel, Basel, Switzerland 12 Hasselt University, Faculty of Medicine and Life Sciences, LCRC, Diepenbeek, Belgium
13 Department of Chemistry, University of Leicester, Leicester, United Kingdom
14 Organic and Biological Analytical Chemistry Group, MolSys research unit, University of Li`ege, Li`ege, Belgium 15 Department of Chemistry and Applied Biosciences
, ETH Zurich, Zürich, Switzerland
16 Universit´e Paris-Saclay, UVSQ, INSERM, Infection et inflammation, D´epartement de Biotechnologie de la Sant´e, Montigny le Breton-neux and U Hˆopital Foch, D´epartement des maladies des voies respiratoires, Suresnes, France
17 Department of Anaesthesiology and Intensive Care Medicine, Institute for Breath Research; University of Innsbruck , Innsbruck, Austria
18 Department of Anaesthesiology and Intensive Care Medicine, Rostock Medical Breath Research Analytics and Technologies (ROM-BAT), Rostock University Medical Centre, Rostock, Germany
E-mail:[email protected]
Keywords: standardization, breathomics, peppermint, repeated sampling, pharmacokinetics, benchmark
Abstract
Sampling of volatile organic compounds (VOCs) has shown promise for detection of a range of
diseases but results have proved hard to replicate due to a lack of standardization. In this work we
introduce the ‘Peppermint Initiative’. The initiative seeks to disseminate a standardized experiment
that allows comparison of breath sampling and data analysis methods. Further, it seeks to share a
set of benchmark values for the measurement of VOCs in breath. Pilot data are presented to
illustrate the standardized approach to the interpretation of results obtained from the Peppermint
experiment. This pilot study was conducted to determine the washout profile of peppermint
compounds in breath, identify appropriate sampling time points, and formalise the data analysis.
Five and ten participants were recruited to undertake a standardized intervention by ingesting a
peppermint oil capsule that engenders a predictable and controlled change in the VOC profile in
exhaled breath. After collecting a pre-ingestion breath sample, five further samples are taken at 2, 4,
19
Joint first authors in alphabetical order © 2020 IOP Publishing Ltd
6, 8, and 10 h after ingestion. Samples were analysed using ion mobility spectrometry coupled to
multi-capillary column and thermal desorption gas chromatography mass spectrometry. A
regression analysis of the washout data was used to determine sampling times for the final
peppermint protocol, and the time for the compound measurement to return to baseline levels
was selected as a benchmark value. A measure of the quality of the data generated from a given
technique is proposed by comparing data fidelity.
This study protocol has been used for all subsequent measurements by the Peppermint
Consortium (16 partners from seven countries). So far 1200 breath samples from 200
participants using a range of sampling and analytical techniques have been collected. The data
from the consortium will be disseminated in subsequent technical notes focussing on results
from individual platforms.
1. Introduction
The analysis of volatile organic compounds (VOCs) in exhaled breath offers a non-invasive method for the discovery of prospective biomarkers with the potential for developing clinical and research applica-tions. Exhaled breath contains several hundred VOCs [1], and the complete panel of endogenously-derived breath VOCs has yet to be described. Nevertheless, breath biomarkers have been proposed for a range of diseases [2].
Breath research encompasses a wide range of sampling and analytical techniques. A diversity of approaches, and a variety of targeted diseases, has made comparison and assimilation of research out-comes and data difficult, and this likely contrib-utes to the current lack of replication of research findings [3–5]. Agendas for standardizing different methods (sampling, analytics, reporting) and bench-marking have been described for specific diseases [6]. A list of the many factors that need addressing in standardization includes: participant/patient prepar-ation; chemistry of the materials used in the construc-tion of the sample pathway; diurnal cycle considera-tions; sample size/sampling dynamics (volume, flow, duration), breathing patterns and manoeuvres; man-agement of exogenous confounders (environmental, lifestyle, medication/drug intake, dietary); sampling environment (temperature, pressure, relative humid-ity); sample storage/stability; quality assurance and quality control factors; as well as data processing and archiving protocols, amongst others. Standard-ization efforts have been undertaken elsewhere, such as in the metabolomics field, where the Metabolo-mics Standards Initiative (MSI) provides compre-hensive guidelines on how samples should be taken, stored, and analysed while also setting minimum reporting standards for results [7,8]. While recent appraisals of the success of the MSI suggest that adherence to the minimum reporting standards is lower than expected, and although comparative data-stewardship from the breath research community is in its infancy, the MSI provides a framework and approach to follow.
The Peppermint Initiative was established within the Sampling and Standardization focus group of the International Association of Breath Research (IABR) [9], and aims to propose and recommend a set of benchmark values determined through a collabor-ative and standardized Peppermint breath experi-ment. The experimental protocol must be straight-forward to ensure that it can be followed by any researcher or practitioner performing breath VOC experiments using their own methodologies. The Peppermint breath experiment was developed from preparatory studies undertaken by members of the Peppermint Initiative whereby the pharmacokinetic washout of terpenoid compounds in breath after an intervention was studied [10–12]. The Peppermint experiment concept is based on the development of a transient and well-characterized perturbation in the VOC breath profile of a participant following inges-tion of a food supplement capsule containing pep-permint oil [13]. Despite the washout profiles of the peppermint oil constituents varying between parti-cipants, we hypothesize that statistical analyses of these profiles provides useful information about the reproducibility (precision) and analytical method sensitivity (limit of detection) of the sampling and analysis methods employed. Further, examination of the fidelity of the analytical features (isolated ponents, analytical peaks) will provide useful com-parative evaluation of the methodology and approach being tested.
This introduction to the Peppermint Initiative describes the Peppermint breath experiment, reviews the formation and working practices used by the partners in the initiative, and presents pilot data to illustrate the concepts and intended outcomes. A series of companion publications will report the benchmarking results for a range of breath ana-lysis techniques that currently include gas chroma-tography mass spectrometry (GC-MS) and
com-prehensive GC× GC-MS, gas chromatography ion
mobility spectrometry (GC-IMS), proton transfer reaction mass spectrometry (PTR-MS) and selec-ted ion flow tube mass spectrometry (SIFT-MS). On completion of the first round of Peppermint
J. Breath Res. 14 (2020) 046008 B Henderson et al
experiments a synoptic evaluation and examination of the outcomes will also be presented that is anti-cipated to inform, amongst other things, power cal-culations for study designs and a deeper examination of the pharmacokinetics of the peppermint washout process in humans.
It is not anticipated that this current Peppermint Initiative will result in any standardized sampling or analysis protocols for breath in the immediate future, especially as different applications and techniques will require tailored sampling parameters and proto-cols; equally, the Peppermint Initiative was not estab-lished to proscribe or advise on sampling or analytical protocols. The Peppermint Initiative was formed to provide a benchmark for assessing the performance of breath sampling/analytical techniques, offer a broad comparative performance assessment of the current breath-analytical landscape, and encourage interna-tional, cross-platform and interdisciplinary collabor-ation1 to take the first steps in tackling the issue of standardization in breath research.
2. Pilot study and definition of the
Peppermint experimental protocol
Two experiments were carried out to identify sampling time points and compounds of interest for the Peppermint experiment. In the first, ten par-ticipants were recruited to establish the scale and nature of the changes in exhaled breath caused by ingestion of a peppermint capsule.
A 200 mg peppermint oil food supplement cap-sule (product no. 10115320, Boots UK Ltd, UK) with 100–150 cm3 of water was ingested by participants, at time = 0 h, and breath samples were collected at
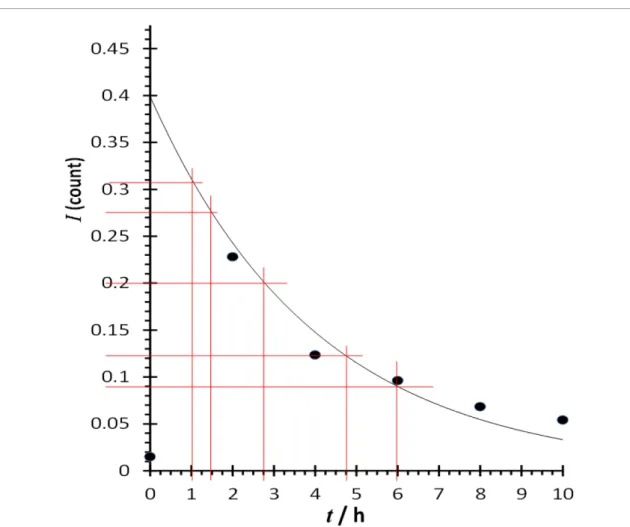
−0.5, 2, 4, 6, 8 and 10 h. Figure1is an example of how the level of a participant’s exhaled menthone (one of the main constituents of the peppermint oil capsule) changed following ingestion of a peppermint capsule. Adaptive breath sampling onto dual-bed thermal desorption (TD) tubes (Tenax:Carbograph TD, Markes Int., UK) was performed and analysed using TD-GC-MS (TD—Unity 2, Markes Int., UK; GC— Agilent 7890, Wokingham, UK; MS—quadrupole— Agilent 5977 A, Wokingham, UK) [14]. See table S1 (available online at stacks.iop.org/JBR/14/ 046008/mmedia) for a summary of the instrumenta-tion parameters in the supplementary secinstrumenta-tion.
For the second study, five participants were recruited and the same sampling time points and peppermint capsules were used. Breath samples from the participants were collected (30 samples in total) and subsequent sample analysis was performed using a commercial standalone ion mobility spectrometer
1The Peppermint Initiative is an ongoing initiative that encourages
participation by research laboratories working in breath analysis. New members are welcome; interest in participation can be direc-ted to the corresponding author of this article.
coupled to a multi-capillary column (MCC-IMS, Bio-Scout BD model, BS Analytics GmbH, Germany) with an integrated spirometric direct breath sampler (SpiroScout, Ganshorn Germany). The experimental parameters are summarised in supplemental table S2. The protocol development work summarised here was undertaken in accordance with the Helsinki Declaration and was approved by Loughborough University Independent Ethics Committee (Ethics No: G09-P5). All staff were trained, and proficiency tested for breath analysis prior to the start of parti-cipant recruitment.
3. Results and interpretation
3.1. Identification of peppermint oil related compounds in breath
In the preparatory TD-GC-MS analysis of breath, eight compounds were attributed to ingestion of a peppermint oil capsule, see table 1. All of these were observed in breath for at least 6 h after inges-tion of a peppermint capsule. All of these com-pounds, except p-Menthadien-7-ol and Dehydro-1,8-cineole, are peppermint oil constituents identified with GC-MS headspace analysis in previous work car-ried out by consortium members, where over 20 com-pounds were reported with their relative concentra-tion levels [13].
3.2. Data analysis, modelling, and data fidelity
Some participants reported mild indigestion-related discomfort from swallowing a peppermint oil cap-sule, which passed within 1 h after capsule ingestion. No participant asked to withdraw from the study.
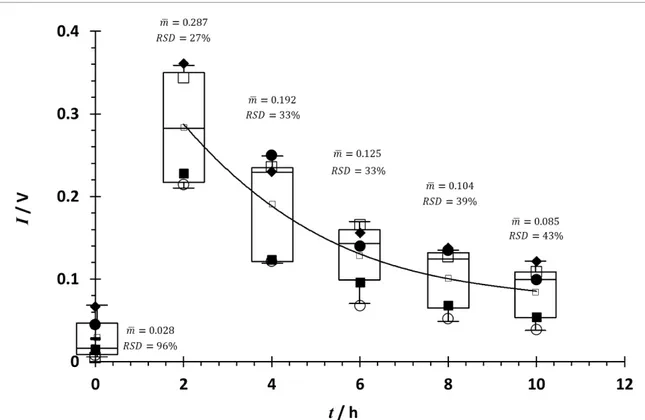
Figure2presents the peppermint oil washout pro-files (fold change, compared to the reference sample, over time) of menthone as determined using an MCC-IMS with online breath sampling during the pilot study. The absolute levels of the washout pro-files varied between participants, as demonstrated by the high relative standard deviation (% RSD), but the kinetics of the washouts were similar. The different profiles may also reflect differences in metabolism. Factors such as body mass index (BMI; kg m−2), age, and diet were collected to explore possible sources of variability in the peppermint washout profiles. Presenting data as a fold change (I/I0) enables data
sets from different platforms to be compared in a straightforward way.
Washout profiles were modelled with a power relationship:
I = B0tB1 (1)
where I—intensity (counts), t—time (h), and B coef-ficients transformed to a linear form, as follows:
log10(I) = log10(B0) +B1log10(t) . (2)
The descriptive statistics of the washout profiles provided useful information about the precision and 3
Figure 1. An example of the washout of menthone (CAS 14 073-97-3) from one individual over 10 h following ingestion of a
peppermint oil food supplement capsule during a pilot study. Analyses were performed using TD-GC-MS. The red intersecting lines show the experimental design that was applied to capture the dynamic range of the washout. The signal was normalized to an internal D8-toluene standard.
Table 1. A summary of compounds found in breath using GC-MS, related to peppermint capsule ingestion.
Name IUPAC name CAS Formula M g−1mol−1
Menthol 5-Methyl-2-(propan-2-yl)cyclohexan-1-ol 2216-51-5 C10H20O 156.27 Menthone (2 S,5 R)-2-isopropyl-5-methylcyclohexanone 14 073-97-3 C10H18O 154.25 1,8-Cineole 1,3,3-Trimethyl-2-oxabicyclo(2.2.2)octane 470-82-6 C10H18O 154.25 Dehydro-1,8-cineolea 1,3,3-Trimethyl-2-oxabicyclo(2.2.2)oct-5-en 92760-25-3 C10H16O 152.23 α-Pinene (1 S,5 S)-2,6,6- Trimethylbicyclo(3.1.1)hept-2-ene ((−)-α-Pinene) 80-56-8 C10H16 136.24 β-Pinene 6,6-Dimethyl-2-methylidenebicyclo(3.1.1)heptane 127-91-3 C10H16 136.24 Menthofuran 3,6-dimethyl-4,5,6,7-tetrahydro-1-benzofuran 494-90-6 C5H6O 82.10 p-Menthadien-7-ola (4-Isopropyl-1,3 cyclohexadien-1-yl)methanol 1413-55-4 C10H16O 152.23
aCompounds not reported as constituents of the peppermint oil capsule.
performance of the analytical platform. A plot of the fold-change log10 (I/I0) vs log10 (t) of the washout
of peppermint oil VOCs, in this case menthone, yiel-ded a linear plot with R2 values between 0.979 and
0.997 (figure 3). The x-axis intercept indicates the estimated time to return to initial concentrations. The curves also provide information on the sensitivity of a method (or limit of detection).
J. Breath Res. 14 (2020) 046008 B Henderson et al
Figure 2. MCC-IMS peppermint oil washout profiles of exhaled menthone from the five participants in the pilot study. The
change in the menthone signal intensity I with time t over 10 h following ingestion of the 200 mg capsule is shown. Individual data for each of the five participants are plotted, together with box–whisker plots showing the median and 25% and 75% inter-quartile range (IQR) with 1.5× IQR indicated by the whiskers. The mean trend is highlighted by the solid line.
Figure 3. An example log-log plot of the power relationship between fold change and time in menthone washout (signal I/I0=10B0t(h)B1) over 10 h following ingestion of a peppermint oil capsule. The data of five individual participants are shown. The solid horizontal bar and arrow indicate the range and the mean, respectively, of time for menthone in breath to return to initial concentrations, with the approximation that the marker has mono-compartmental pharmacokinetics. The plot reveals information about intra-subject biological variability (B0,B1), as well as sampling and analysis precision (reproducibility—R2) and limits of detection (analytical method sensitivity—x intercept).
Extrapolation of the power relationships in the pilot data shown in figure3provides a prediction of how long it will take menthone in breath to return to its initial (pre-ingestion, reference) concentration. (Note that these data are illustrative and not intended to be used as benchmarks; the benchmarks require the consolidated data from the full-scale peppermint studies with larger numbers of participants.) For the pilot data plotted in figure3the mean (±99% confid-ence level) washout time was determined to be 39.3 (±18.6) h, as indicated by the solid horizontal bar and arrow. Figure 2 highlights the biological vari-ability between the participants with different indi-vidual uptake and elimination rates. Combining the data from all the peppermint studies will provide a larger sample size to enable a detailed examination of the nature of this variability. This will be addressed in a future synoptic paper.
It is important to note that variability in an indi-vidual’s uptake and elimination of peppermint volat-iles also extends to how long it takes for the exhaled concentration of peppermint volatiles to reach its maximum. Some participants will have a washout profile that results in less than four data points obtained after the maximum exhaled peppermint concentrations. Such profiles do not yield enough data to generate a reliable washout model, and should be excluded from benchmarking evaluation. Con-sequently, it appears that a precautionary approach of standardizing ranges of the BMI, age, and diet in the participant cohort may reduce the effect of vari-ability in the participants’ peppermint uptake and washout behaviour on the benchmarking evaluation. The influence of these factors on the washout of inges-ted volatiles is not well defined, and this aspect of the Peppermint Initiative will be studied and dissemin-ated once all the benchmark datasets become avail-able and have been analysed; see the synoptic paper comment above.
An example of how potential differences in data from different laboratories may be evaluated rapidly is also included in figure3with a dataset of a single washout curve from an alternative instrument, with a different sampling approach, obtained at a differ-ent laboratory (labelled ‘F’). The data from exper-iment F is clearly different to the other pilot data. However, a complete Peppermint experiment data-set would be needed from the analytical system used for the F data to provide sufficient data on variabil-ity before an informed comparative evaluation could be reached. However, at face-value, the differences in datasets between the two techniques is sufficient to justify proceeding with caution when combining data from the two systems and running a full Peppermint experiment to establish a more rigorous comparison. While the washout data (figures2 and3) reveal much about the precision and overall sensitivity of a technique towards a targeted compound, they do not disclose the complete range of attributes of all
the data obtained from the study. The washout data tracks a peppermint marker but discloses little else about the sample being analysed. Further informa-tion about the characteristics of all the data acquired during the benchmark study has significant utility in evaluating the overall attributes of the method being used. The approach proposed below can be especially useful for the breathomics studies, where sensitivity, resolution, and richness of the information contained within the samples are crucial aspects for marker dis-coveries.
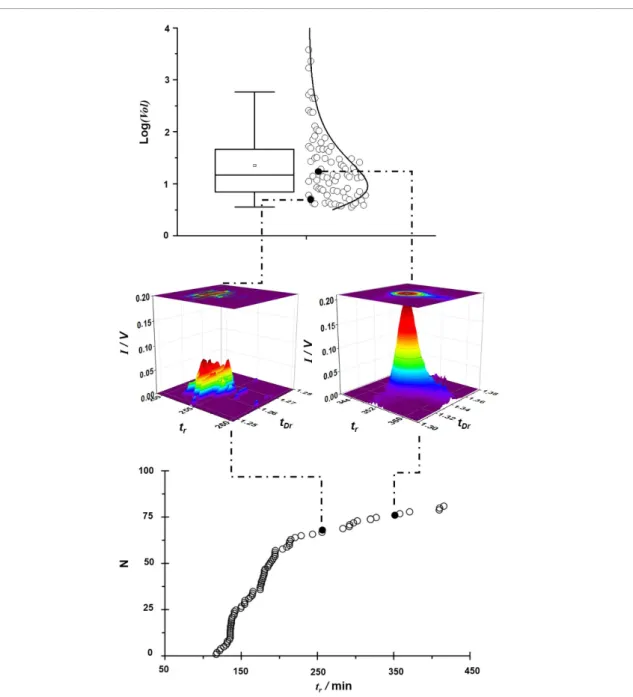
Figure 4 is an example of how the
cumulat-ive frequency distribution and intensity distribu-tions of all analytical features may be combined use-fully; obtained from an MCC-IMS method run on a participant’s sample taken at 60 min, when the exhaled abundances of peppermint markers were at their highest. The nature of the ‘breathome’ recor-ded may be discerned by combining the distribution of the intensity of the features with the cumulative frequency distribution against retention time. High-lighting the peppermint washout markers, α-pinene, an unidentified feature, and eucalyptol (indicated with solid markers with increasing retention times, respectively), along with their extracted signals, places the peppermint washout data in the broader context of the individual’s breathome for this sample. Con-solidating all the data from a peppermint experiment will provide a systematic overview of the performance of the methodology under controlled conditions with a panel of peppermint volatiles providing a frame of reference.
Experiment F was a comparative peppermint breath experiment undertaken with different instru-mentation and a different sampling method to the pilot data. The difference between the observed washout in experiment F and the pilot data illustrates why multiple peppermint washout experiments are needed, and how data from this test may be used to compare the analytical performance of different breath analysis techniques, methods, and studies.
Combining and summarising the cumulative frequency and feature intensity distributions with the washout data from a peppermint experiment provides an overview of the performance of a tech-nique for breath analysis and enables inter-/intra-laboratory differences in the fidelity of breath data to be ascertained. Ultimately, such data enable inter-technique comparisons based on a common approach to monitoring a controlled intervention, which considers the inherent biological variability present in all breath data.
4. Peppermint Initiative and final
experimental design
he results from the pilot work led to the final protocol design and the formulation of the data processing and presentation approaches needed to compare different
J. Breath Res. 14 (2020) 046008 B Henderson et al
Figure 4. Visualization of breath data fidelity. Based on a representative 1 h post-ingestion sample analysed by MCC-IMS. Solid
circles (top and bottom plots) identify instrument signal responses to peppermint oil compounds (T to R): α-pinene, an unidentified feature, and eucalyptol. Top: (left) a logarithmic box–whisker plot of exhaled breath features identified by MCC-IMS showing the median and 25% and 75% IQR with 1.5× IQR, indicated by the whiskers. The mean is indicated by the open circle. (right) Individual data points and the fitted distribution curve of all analytical features. Middle: peppermint markers exhibiting the lowest (α-pinene) and highest (eucalyptol) intensities; false colour rendering is used to aid visualization. Bottom: cumulative frequency distribution of analytical features across the retention time range. Vol: peak volume in (V s−2); tr: retention time (s); N:
number of features; I: intensity (V); tDr: relative drift time.
data sets in a systematic way, enabling the production of consistent benchmark values.
4.1. Peppermint Initiative description
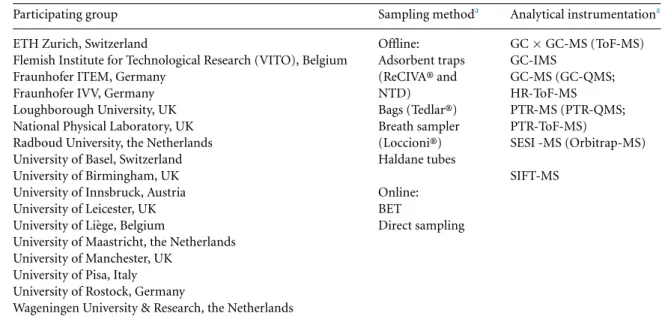
All partners in the Peppermint Initiative received institutional ethics board approvals to undertake these studies. Each contributing group obtained approval from their local ethical review board to par-ticipate in this study. Written informed consent was obtained from all volunteer participants. All study protocols complied with the Declaration of Helsinki. The 16 participating research groups and a sum-mary of the initial techniques used for the first phase of the Peppermint study are listed in table2.
The Peppermint Initiative consortium is coordin-ated by Loughborough University, with an oversight team additionally comprising Radboud University, Fraunhofer IVV, and the University of Manchester. Regular (teleconference) meetings between the con-sortium partners have been held to coordinate the organization, management and operation of the study, data curation methods, data management, dissemination of results, publication strategy, and recruitment of new participating laboratories.
4.1.1. Study documentation.
A description of the peppermint breath experi-ment was provided to each participating group; 7
DESCRIPTION_OF_THE_BENCHMARK_STUDY
_PEPPERMINT_FOR_THE_IABR TASK_FORCE
(appendix A). The document contained a detailed description of all the relevant information regard-ing participation in the benchmark study, includregard-ing the aims of the Peppermint Initiative, the sampling protocol, as well as data curation and management plans.
To assist each institute with the ethical approval, an example research proposal (appendix B) was shared with each group.
A participant information (appendix C) sheet was given to each volunteer prior to participation in the peppermint breath experiment. The document con-tained information about the aims and requirements of the study.
A participant informed consent form
(appendix D) was provided together with the par-ticipant information sheet, and volunteers were required to sign this before taking part in the study to confirm their informed and written consent.
A participant questionnaire (appendix E) was used to collect metadata on the participant, including height, weight, age, sex, and food intake on the day of the experiment.
All documents (excluding the consortium agree-ment) were supplied as templates, with highlighted sections in each document to be customized for each institute. In addition, each partner was permitted to further adapt these documents to best suit the needs of their institution. Copies of these documents are provided as supplementary materials to this paper (appendices A—E).
4.2. Methodology
Thirty-six bottles containing 60× 200 mg pepper-mint oil capsules, obtained from Boots UK Ltd. (product number: 10 115 320) were acquired from the same production batch (batch no. 200 207) and dis-tributed to the participating groups of the Pepper-mint Initiative.
To account for inter-participant variability a study group of ten participants is recommended. Parti-cipants are requested to exclude peppermint and peppermint-associated products from their diet and personal care routines for 24 h prior to participation in the study and until completion of the experiment. Each participant provides a reference breath sample for analysis and then ingests a peppermint capsule washed down with 100 to 150 cm3 of tap
water (t = 0 min). It is important that rigorous time-management is maintained, and that the pep-permint capsule is taken within 30 min of the refer-ence sample.
Each participant provides five additional breath samples at 60 min, 90 min, 165 min, 285 min, and 360 min post-ingestion.
In addition to the breath samples, at least one environmental air sample should be collected after
one of the sampling points (selected at random) for each participant while both researcher and parti-cipant were still present in the room. An air sup-ply/instrument blank sample should also be taken after completion of a sampling series (i.e. after 360 min).
This protocol was based on a 1D central-composite experimental design applied to a repres-entative washout profile, obtained from a preparatory investigation; see below (figure1).
Evaluation of the washout data of the pepper-mint oil constituents combined with a global sum-mary of the VOC features isolated under these condi-tions provides a standardized test of a methodology, and enables comparison against benchmark data.
4.3. Data management
The Peppermint Initiative relies on data evaluation and sharing. Within this study, each participat-ing team acquired different types of datasets that included: raw data; processed data; summary results; informed consent forms; and participant metadata. Each group was provided with a secure file-store in a cloud repository by the study coordinator (see table3). No personal information was shared or stored to ensure anonymity of participants. All data were assigned a study code by the study coordinator and anonymized before release. Consolidated data will be available in∗.csv file format for wider use upon request to the corresponding author once the research results have been published.
4.4. Summary of the Peppermint Initiative
The Peppermint Initiative aims to establish a bench-mark to ascertain performance of breath sampling and analytical methods, and to survey comparative performances of current breath research across the community. The pilot study presented here enabled the preparation and development of the methodo-logy for the Peppermint experiment. Further, these initial trials highlighted the challenges associated with creating a benchmarking method and accompanying data work-up for breath analysis. Comparing differ-ent sampling approaches and analytical techniques requires sufficient sample numbers to account for both technical and biological variability. Alignment of data processing as well as quality assurance and control approaches across the Peppermint Initiative consortium are essential.
To date, 16 teams have provided data from 200 individual volunteer participants. Two hundred sets of six samples of comparative intra-subject variabil-ity profiles, 200 sets of comparative inter-subject vari-ation, and 200 ambient air VOC profiles provide an objective multi-centre verified review of comparative analytical characteristics of different techniques and sampling approaches.
Moreover, this initial dataset and the accom-panying protocol provides a benchmark standard
J. Breath Res. 14 (2020) 046008 B Henderson et al
Table 2. An overview of the participating groups, and sampling and analysis techniques for breath samples.
Participating group Sampling methoda Analytical instrumentationa
ETH Zurich, Switzerland Offline: GC× GC-MS (ToF-MS)
Flemish Institute for Technological Research (VITO), Belgium Adsorbent traps GC-IMS
Fraunhofer ITEM, Germany (ReCIVA® and GC-MS (GC-QMS;
Fraunhofer IVV, Germany NTD) HR-ToF-MS
Loughborough University, UK Bags (Tedlar®) PTR-MS (PTR-QMS;
National Physical Laboratory, UK Breath sampler PTR-ToF-MS)
Radboud University, the Netherlands (Loccioni®) SESI -MS (Orbitrap-MS)
University of Basel, Switzerland Haldane tubes
University of Birmingham, UK SIFT-MS
University of Innsbruck, Austria Online:
University of Leicester, UK BET
University of Li`ege, Belgium Direct sampling
University of Maastricht, the Netherlands University of Manchester, UK
University of Pisa, Italy University of Rostock, Germany
Wageningen University & Research, the Netherlands
aThe instrumentation and sampling methods have been disassociated from the individual research institution.GCxGC-MS:
comprehensive 2D gas chromatography; GC-IMS: gas chromatography ion mobility spectrometry; GC-MS: gas chromatography mass spectrometry; HR-ToF-MS: high resolution time of flight mass spectrometry; PTR-ToF-MS: proton transfer reaction time of flight mass spectrometry; PTR-Quad-MS: proton transfer reaction quadrupole mass spectrometry; SESI Orbitrap: secondary electrospray ionization Orbitrap mass spectrometry; SIFT-MS: selected ion flow tube mass spectrometry; ReCIVA®: Respiration Collector for In Vitro Analysis, Owlstone Medical Ltd, Cambridge, UK; BET: buffered end-tidal sample, IONICON Analytik GmbH, Innsbruck, Austria; NTD: needle trap device.
Table 3. An overview of information and data provided by each participating group.
Governance Data
Participant questionnaires Raw data
Signed consortium agreement (file format: instrument-dependent)
Signed ethical approval form Processed data (∗.csv file)
Signed informed consent forms from participants Sample method data (∗.docx file describing
(personal information is redacted and replaced sampling method protocol)
with a participant code) Instrument method data (∗.docx file describing
instrumental parameters)
Quality control/assurance measures
for assessments that will support and verify quality assurance and control activities undertaken in the field of breath research.
5. Conclusions
To achieve the continuous improvement in sampling, analysis, data processing and modelling needed for the development and adoption of breath tests, it is important to ensure quality assurance in breath analysis. In contrast to other approaches in bio-marker discovery, a method for reliably pooling breath samples has yet to be described. In address-ing this challenge, the ephemeral nature of breath samples needs to be recognized and the Peppermint experiment is an attempt to resolve this difficulty by providing an approach for data sharing and per-formance evaluation for breath researchers. Adop-tion of the Peppermint experiment enables informed
comparison of analytical quality against a consensus benchmark.
Understanding the cause or causes of differences arising through use of similar technologies is essential in the development and quality of the research and researchers involved. To enable this, careful analysis of the sample as a whole is required. Possible factors driving variability include participant phenotype, participant compliance with the experimental pro-tocol, environmental contamination, experimental procedure, researcher proficiency, instrumentation setup, or data processing, amongst others. Without benchmarking it is difficult to assert a level of reli-ability in individual datasets or associated findings. If the breath research community is to enhance the con-fidence in its reported discoveries and commit to the delivery of reproducible findings, continuous effort in verifying and sharing benchmark data will be needed for the foreseeable future.
Acknowledgments
The authors would like to acknowledge the work undertaken by the initial Peppermint collaboration team of Jonathan Beauchamp, Stephen Fletcher, Simona Cristescu and Paul Thomas who initiated the work and collaboration embodied in the Peppermint Initiative. The authors would also like to acknow-ledge:
The Marie Skłodowska-Curie Actions Innov-ative Training Network: Ion-Molecule Processes for Analytical Chemistry Technologies (IMPACT) (www.impact-h2020itn.com), which has supported BH, MM and GP as Early Stage Researchers through the European Commission’s HORIZON 2020 Pro-gramme under Grant Agreement Number 674911.
The EMBER consortium for support in the dis-semination of the Peppermint Initiative; research-ers involved in the application of the protocol to specific techniques (to be published in due course) Abigail Joyce, Amisha Manek, Bellagambi Francesca Giuseppa, Bonsignori Alessio, Ghimenti Silvia and Biagini Denise, Liesl Carr, Luke Bryant and Rebecca Cordell,
MW and SJF are supported by the NIHR Manchester Biomedical Research Centre.
The group from Li`ege University is supported by the FNRS through the EOS and the FRIA initiatives.
Finally, we would like to thank Dr Matthew Turner for all the analytical and technical support provided to the team during the pilot study campaign and production of this manuscript.
ORCID iDs
Dorota M Ruszkiewicz https://orcid.org/0000-0002-7578-2970 Jonathan D Beauchamp https://orcid.org/0000-0003-1405-7625 Dahlia Salman https://orcid.org/0000-0002-5354-2407 Olaf Holz https://orcid.org/0000-0003-0665-7807 Pablo Sinues https://orcid.org/0000-0001-5602-2880 Tommaso Lomonaco https://orcid.org/0000-0002-1822-7399 Delphine Zanella https://orcid.org/0000-0002-0131-2837 Renato Zenobi https://orcid.org/0000-0001-5211-4358Flavio Antonio Franchina
https://orcid.org/0000-0001-7236-4266 Pierre-Hugues Stefanuto https://orcid.org/0000-0002-1224-8869 Giovanni Pugliese https://orcid.org/0000-0002-2869-3588 Christopher Mayhew https://orcid.org/0000-0002-5014-7241 C L Paul Thomas https://orcid.org/0000-0003-4631-6417
References
[1] De Lacy Costello B, Amann A, Al-Keteb H, Flynn C, Filipiak W, Khalid T, Osborne D and Ratcliffe N M 2014 A review of the volatiles from the healthy human body J. Breath Res.8 014001
[2] Beuchamp J D, Davis C E and Pleil J D 2020 Breathborne Biomarkers and the Human Volatilome 2nd edn (Amsterdam: Elsevier)
[3] Fowler S J 2018 Breath analysis for label-free characterisation of airways disease Eur. Respir. Journal51 1702586
[4] Herbig J and Beauchamp J D 2014 Towards standardization in the analysis of breath gas volatiles J. Breath Res.8 037101 [5] Azim A, Barber C, Dennison P, Riley J and Howarth P 2019
Exhaled volatile organic compounds in adult asthma: a systematic review Eur. Respir. J.54 16
[6] Horv´ath I et al 2017 A European respiratory society technical standard: exhaled biomarkers in lung disease Eur. Respir. Journal49 1600965
[7] Fiehn O et al 2007 The metabolomics standards initiative (MSI) Metabolomics3 175
[8] Spicer R A, Salek R and Steinbeck C 2017 Compliance with minimum information guidelines in public metabolomics repositories Sci. Data4 170137
[9] Beauchamp J D and Pleil J D 2013 Simply breath-taking? Developing a strategy for consistent breath sampling J. Breath Res.7 042001
[10] Beauchamp J D, Kirsch F and Buettner A 2010 Real-time breath gas analysis for pharmacokinetics: monitoring exhaled breath by on-line proton-transfer-reaction mass spectrometry after ingestion of eucalyptol-containing capsules J. Breath Res.4 026006
[11] Ruzsanyi V 2013 Ion mobility spectrometry for
pharmacokinetic studies—exemplary application J. Breath Res.7 046008
[12] Heaney L M, Ruszkiewicz D M, Arthur K L, Hadjithekli A, Aldcroft C, Lindley M R, Thomas C P, Turner M A and Reynolds J C 2016 Real-time monitoring of exhaled volatiles using atmospheric pressure chemical ionization on a compact mass spectrometer Bioanalysis8 1325 [13] Mal´askov´a M, Henderson B, Chellayah P D, Ruzsanyi V,
Mochalski P, Cristescu S M and Mayhew C 2019 Proton transfer reaction time-of-flight mass spectrometric measurements of volatile compounds contained in peppermint oil capsules of relevance to real-time pharmacokinetic breath studies J. Breath Res.13 046009 [14] Basanta M, Koimtzis T, Singh D, Wilson I and Thomas C L P
2007 An adaptive breath sampler for use with human subjects with an impaired respiratory function Analyst 132 153