This is an author-deposited version published in : http://oatao.univ-toulouse.fr/ Eprints ID : 2791
O
pen
A
rchive
T
OULOUSE
A
rchive
O
uverte (
OATAO
)
OATAO is an open access repository that collects the work of Toulouse researchers and makes it freely available over the web where possible.
To link to this article : DOI: 10.1007/s10800-008-9740-y URL : http://dx.doi.org/10.1007/s10800-008-9740-y
To cite this version :
Nourry, C and Massot, Laurent and Chamelot, Pierre and Taxil , Pierre ( 2009) Electrochemical reduction of Gd(III) and Nd(III) on reactive cathode material in molten fluoride media. Journal of Applied Electrochemistry, vol. 39 (n° 6). pp. 927-933. ISSN 0021-891X
Electrochemical reduction of Gd(III) and Nd(III) on reactive cathode
material in molten fluoride media
C. Nourry, L. Massot*, P. Chamelot, P. Taxil
Laboratoire de Génie Chimique UMR 5503, Département Procédés Electrochimiques, Université Paul Sabatier, 31062 Toulouse Cedex 9, France
(*)
corresponding author: Laurent Massot
Tel: + 33 5 61 55 81 94 fax: + 33 5 61 55 61 39
Abstract
The electrochemical reduction of two lanthanides (neodymium Nd and gadolinium Gd) was investigated in the 800-950°C temperature range on nickel and copper electrodes. These materials react with lanthanides (Ln) to form intermetallic compounds. The formation mechanism of these alloys was determined by coupling electrochemical techniques and Scanning Electron Microscopy (S.E.M.) after electrolyses runs; this also allowed the identification of the binary compounds formed. In addition, from the electrochemical results we calculated the Gibbs energies of Nd/Ni, Gd/Ni, Gd/Cu and Nd/Cu.
Keywords
Fluorides, neodymium, gadolinium, intermetallic compounds, electrochemical extraction.
1. Introduction
From the beginning of the 1990s, the reprocessing of nuclear waste became an absolute necessity for all nations using nuclear energy for the production of electricity. In particular, radiotoxic elements must be processed: the metal fuels (U, Pu, Th) for recycling and the minor actinides (Am, Np, etc.), produced by transmutation, for storage.
In the future, the Molten Salts Reactor (MSR), which is one of the six planned 4th generation nuclear reactors, where loop reactors are expected, reprocessing is even more crucial [1] because molten salt solvents must be recycled with the recovered fuel elements.
With the MSR model studied here, the overall treatment comprises a first step for recovering actinides and a second one devoted to the extraction of fission products for storage.
In the overall context of finding ways to reprocess nuclear waste, the present article is
extracting lanthanides exhibits many advantages, in particular that of avoiding the addition of any chemicals to the melt to be purified. The molten salts used for this study were alkaline fluorides, chosen for their high chemical stability and their favourable neutronic properties. Electrodeposition can occur in two different ways based on two kinds of cathode material: (i) The cathode material is inert, which means that the Ln ions lose their charge to yield pure Ln metal at more cathodic potentials than the Ln equilibrium potential in the melt, given by the Nernst equation, with the activity of the Ln(0) phase equal to one. In earlier works [2, 3], we demonstrated that only incomplete extraction can be expected. The first reason for this is that the equilibrium potential of Ln ions is too negative, i.e. too close to the solvent discharge potential, to reach the efficiency predicted by thermodynamics. Secondly, electrodeposited Ln metal is dendritic and falls to the bottom of the bath in the form of fine particles, difficult to recover.
(ii) The cathode material reacts with the electrodeposited Ln, the reaction leading to alloys or compounds at the cathode surface, with an activity of less than one. In this case,
electrodeposition occurs at more anodic potentials, called hereafter underpotential electrodeposition (UPD) which should lead to efficiencies of around 100% after
depolarisation of the electrochemical system. Moreover, we observed previously that when copper or nickel is used as cathodes the surface reaction with Ln is particularly rapid and, in our working temperature range, gives rise to easy-to-recover liquid compounds [4]. This enhances the rate of extraction owing to the renewal of the electrode surface as the liquid deposit falls off.
Few reports deal with this subject and only in molten chloride melts:
Nohira et al. [5] studied the formation of Pr-Ni alloys in a molten LiCl-KCl-PrCl3 system.
The authors observed the formation of six intermetallic compounds and calculated the Gibbs formation energy for two of them:
ΔGf (GdNi17/2) = -124.5 kJ mol-1 and ΔGf (GdNi5) = -112.5 kJ mol-1.
Kubota et al. [7] observed the formation of different alloys Co3Gd, Co2Gd and Co7Gd2 by
reduction of Gd(III) in the LiCl-KCl eutectic on a Co electrode at fixed potential.
The present study investigates the cathodic behaviour of Ln elements in molten fluorides on copper and nickel cathodes, in the UPD range. This was achieved by identifying the
intermetallic compounds Cu/Ln and Ni/Ln and determining their properties relevant for the extraction process: activities of Ln in the solid compound, Gibbs Energy and standard potential of each compound.
.
2. Experimental
The electrolyte was contained in a glassy carbon crucible (Carbone Lorraine V25) placed in a cylindrical vessel made of refractory steel. The inner part of the vessel was protected against fluoride vapour by a graphite liner. The cell was placed under argon atmosphere (U grade, less than 5 ppm O2). A more detailed description of the device is given
in refs [8,9]. The solvent used in the electrolytic bath was the eutectic LiF/CaF2 (Merck
99.99%) (79.5/20.5 molar percent), with a melting point of 762°C. Before each experiment, the salt mixture was heated to melting point under vacuum in order to eliminate any traces of moisture. NdF3 and GdF3 (Alpha Aesar 99.99%) were used as solute and were introduced into
the melt in the form of pellets. Wires of Ta, Mo, Ni (1-mm diameter) (Goodfellow 99.95%) and Cu (1.5-mm diameter) were used as working electrodes. The auxiliary electrode was a
glassy carbon rod (Carbone Lorraine V25) with a large surface area (2.5 cm²). The potentials were referred to a platinum wire (0.5 mm diameter) immersed in the molten electrolyte, acting as a quasi-reference electrode Pt/PtOx/O2- [10]. Cyclic voltammetry, chronopotentiometry and
open-circuit chronopotentiometry were used for all in situ investigations. An Autolab PGSTAT30 potentiostat / galvanostat controlled by a computer using the research software GPES 4.9 was used. After the electrochemical reduction, the cathodes were examined by Scanning Electron Microscopy (LEO 435 VP) with an EDS probe (Oxford INCA 200).
3. Results and discussion
3.1 Preliminary discussion
It has been shown in previous studies that electrodeposition on an inert electrode cannot fully extract gadolinium [3] for recycling of the molten salt in the reactor. This low extraction yield is due, on the one hand to the insufficient difference in reduction potential (ΔELi) between the
reduction of Gd ions and solvent ions (Li+), and on other hand, to the poor adherence of pure Gd deposit on the cathode. Similar results and conclusions about Nd behaviour were previously published by our laboratory [11]. The only way to obtain an extraction efficiency of close to 100% is to increase the potential gap ΔELi by shifting the Ln reduction potential in
a positive direction, usually called underpotential electrodeposition [12]. The use of a noble metal as a cathode material can promote its reaction with the deposited metal leading to the formation of intermetallic compounds. This so-called depolarisation effect eliminates the cations from solution without competition with the solvent cations and so leads to high extraction efficiencies. Furthermore we observed that the alloy deposited at the cathode surface was smooth, unlike the pure metal deposit.
The phase diagrams, from ref [4], show the existence of the following intermetallic compounds in each system:
- Ni-Nd system: NiNd3, Ni3Nd7, NiNd, Ni2Nd, Ni3Nd, Ni7Nd2, Ni5Nd
- Cu-Nd system: CuNd, Cu2Nd, Cu4Nd, Cu5Nd and Cu6Nd
- Ni-Gd system: NiGd3, Ni2Gd3, NiGd, Ni2Gd, Ni3Gd, Ni7Gd2, Ni4Gd, Ni5Gd, Ni17Gd2
- Cu-Gd system: CuGd, Cu2Gd, Cu9Gd2, Cu5Gd and Cu6Gd;
3.2 Study of Nd
(III)and Gd
(III)reduction on reactive electrodes
3.2.1 Cyclic voltammetry
Cyclic voltammetry was carried out on copper or nickel electrodes in LiF-CaF2-LnF3
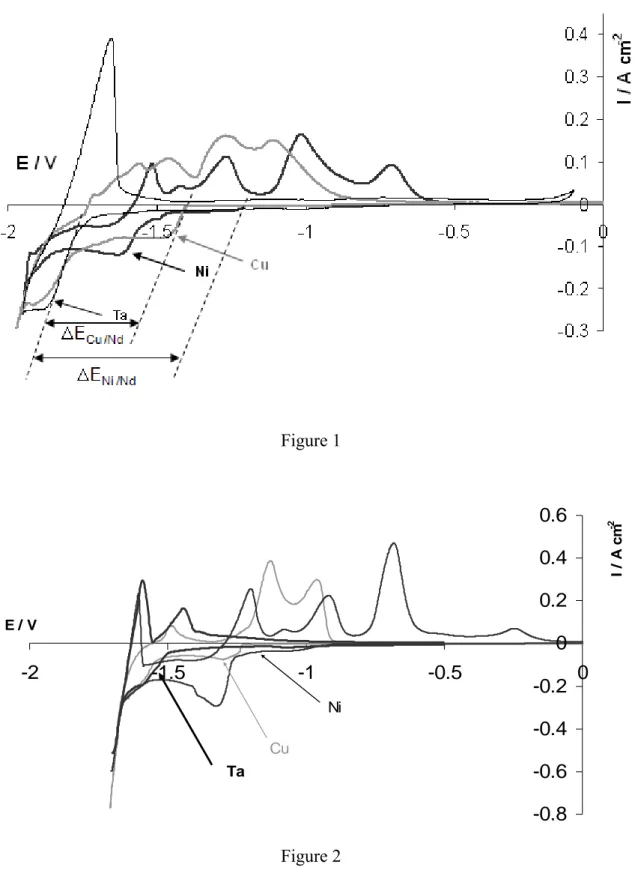
(Ln = Nd, Gd) (0.1 mol kg-1) systems at 800°C. The cyclic voltammograms of Figures 1 and 2, compare Ln(III) reduction on copper and nickel and on an inert tantalum electrode. For both Cu and Ni electrodes current density was higher at more anodic potentials than the reduction of Ln(III) to give pure Ln metal on the Ta electrode. The currents are attributed to the formation of Ni/Nd and Cu/Nd alloys:
Ln(III) + 3 e- + x M = LnMx (1)
(M = Ni or Cu). With reference to the Nernst law, the lower activity of Ln in the cathodic product explains that the reduction of Nd(III) into Nd intermetallic compound promotes the
shift of the electroreduction potential towards more anodic values:
(
Alloy)
Ln I R Lna nF RT E E = − (2)(
Solution)
Ln Metal Ln Solution Ln I Lna nF RT E a a Ln nF RT E E ⎟⎟= °+ ⎠ ⎞ ⎜⎜ ⎝ ⎛ + ° = (3)With E° = standard potential of LnIII/Ln and solution
[ ]
IIILn
Ln
a
=
γ
, γ being the activity coefficient in the liquid phase; ER the Ln(III) reduction potential on a reactive cathode; EI is theLn(III) reduction potential on an inert cathode; R is the gas constant; T is the temperature in K; n is the number of exchanged electrons; F is Faraday’s constant; a is the lanthanide activity in solution, in the alloy or in the pure metal phase.
The depolarization value, ΔE, is the difference between the potential of increasing current (Ei=0) on the inert electrode and that on the reactive one.
Comparing the voltammograms in Figures 1 and 2, ΔE was estimated on nickel and copper electrodes for each lanthanide, and the results are reported in Table 1. The way ΔE was determined is shown in Figure 1.
3.2.2 Use of the cyclic voltammogram data for predicting the extraction efficiency of Nd and Gd from a molten fluoride bath
The extraction efficiency can be predicted using the thermodynamic data in the Nernst law (eq 3). E° and γ were determined previously in our laboratory [2]. The activity of Ln in the surface compound when the current begins to increase on the reactive electrode, Ln
Alloy
a , can be calculated using the following equation:
⎟ ⎠ ⎞ ⎜ ⎝ ⎛− = RT nF ΔE exp aLn Alloy (4)
Where ΔE is the depolarisation defined above.
The extraction efficiency is called X,
i f i C C C X= − (5)
where Cf and Ci are the final and initial Gd(III) concentrations (mol kg−1).
The final concentration is reached when the lanthanide reduction potential is equal to the lithium reduction potential (ER=ELi). According to equations (2) and (3):
af = γLnIII ⎟ ⎠ ⎞ ⎜ ⎝ ⎛ ° = RT 3F ) E -(E exp a C Ln Li Alloy f (6)
Results concerning the extraction efficiency are reported in table 1.
These results show that the use of a reactive electrode enables complete extraction of the lanthanides from the fluoride melts.
3.2.3 Gibbs energy calculation by open-circuit chronopotentiometry
Open circuit chronopotentiometry allows all the compounds of the binary Ln-M diagrams to be identified and their Gibbs energy to be calculated. The method consists in first electrodepositing a small quantity of Ln on the cathode by a short cathodic run and then measuring the open circuit potential of the cathode versus the time. The intermetallic diffusion of Ln and M leads to the successive formation of Ln/M compounds, with a decreasing Ln content, at the surface of the cathodic material. The open circuit chronopotentiogram of figures 3 and 4 shows plateaus typical of metallic interdiffusion yielding successive intermetallic compounds at the surface of the electrode, as described and explained in refs [13-17] for other systems. Each potential plateau of the chronopotentiogram is referred to the standard potential of the Ln, making it possible to determine the emf of the cell LnxM/LnyMm // LiF, CaF2, LnF3/Ln, which is associated to the reaction:
LnxM + (y-x) Ln + (m-1) M = LnyMm (7)
Note that we used the classic method of determination of the thermodynamic properties of solid compounds [18].
Let us examine the significance of each of the potential plateaus and hence the expression for the associated emf.
The first plateau corresponds to the formation of the compound with the highest Ln content in the binary diagram Ln/M. The electrode reactions of the cell are:
Cathode: Ln3+ + 3e → Ln (9) Ln reacts with the subjacent substrate M:
Ln + (x-1) Ln + M → LnxM (10)
So, the overall reaction is:
x Ln + M → LnxM (11) The emf is eq LnxM a F RT ln 3 = ξ (12)
Equation (12) allows the calculation of the activity of Ln in LnxM and of the Gibbs energy of
the compound, using the Nernst equation:
ΔG = -n F ζ (13) In the second plateau, the cathodic reactions involve the surface reaction of Ln with the compound, which reacts itself with the subjacent M:
Anode: (y-x) Ln → (y-x) Ln3+ + 3(y-x) e- (14) Cathode: (y-x) Ln3+ + 3(y-x) e + LnxM + (m-1)M → LnxMm (15)
The emf is:
eq M) Ln(Ln eq ) M Ln(Ln x m y a a ln x)F 3(y RT ζ − = (16)
Accordingly, each potential plateau marks the formation, at the cathode surface, of a new compound with an increasing content of metal substrate M. It can be identified by reference to the binary phase diagram Ln/M and the cross section of the alloy layers was further examined with SEM coupled to EDS analysis which checked the real existence of the compounds in the alloy layer. For instance, Gd2Ni17 neverwas observed and consequently not taken into account
From equations equivalent to (16) and from each emf plot of figs 3 (Ni/Nd and Cu/Nd) and 4 (Ni/Gd and Cu/Gd), we calculated, plateau by plateau, the activities of Ln in the successive solid phases and the Gibbs energy of each intermetallic compound.
Tables 2, 3 and 4 gather the results for each intermetallic compound of the systems Nd/Ni, Nd/Cu, Gd/Ni and Gd/Cu at 840°C. Only data for Nd/Cu were available in the SGTE database [19] for comparison with our values - the agreement was satisfactory.
The data from tables 2, 3 and 4 were used for the potentiostatic electrolytic preparation of specific compositions of surface alloys
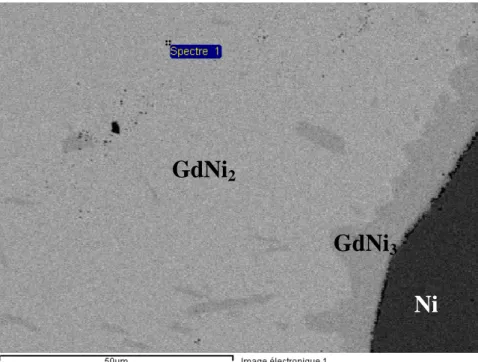
3.2.4 Observation of the surface alloy layers
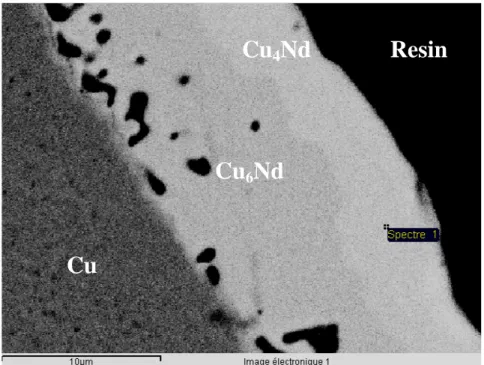
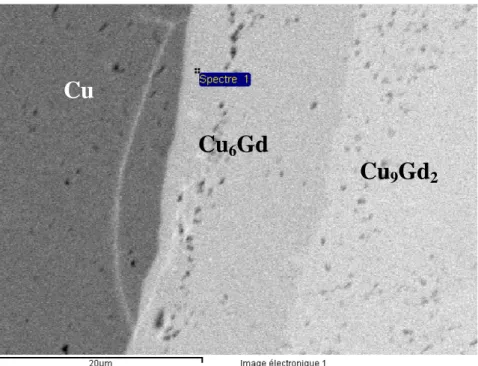
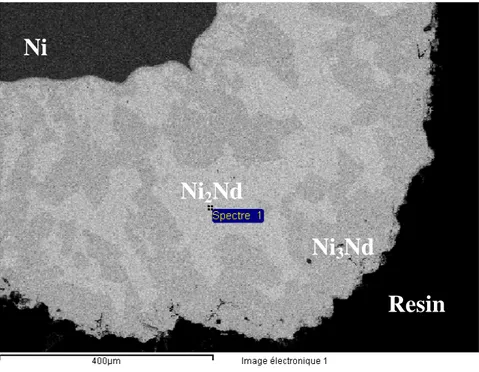
To obtain more information on the formation of the alloy layers that will be involved in the future extraction processes, especially concerning their composition and growth rates, we carried out a series of electrolysis runs at 840°C with different current densities and durations. Below, we give typical examples for each system, illustrated by SEMs of the cross sections of the layer and EDS analysis: Nd-Cu (fig.5), Nd-Ni (fig.7), Gd-Cu (fig.6), Gd-Ni (fig.8). We can observe the following trends:
- At low current densities, only the compounds with a low Ln content were obtained in a short time; increasing the current yielded more Ln-rich compounds in the bulk of the layer; in some cases (e.g. Cu/Gd, fig.6), strata of compounds are observed with increasing Ln content going towards the electrolyte surface while more generally the phases are distributed as splashes within the layer with an increase in the abundance of high Ln content splashes towards the surface.
- At higher current densities more Ln-rich compounds were observed: during the transient regime, Ln supply is higher than removal through the formation of alloy.
Nevertheless, it is to be expected that long duration electrolyses will lead to an overall lower Ln content of the surface layer.
- For each condition, the compounds richest in Ln are in the outer part of the sample (close to the surface), which is coherent with the formation mechanism proposed above (§3-2-3).
- The observed growth rate of the layer was high (several hundred μm in two hours), which is promising for the extraction process; nevertheless, the process will be significantly slowed down due the increasing saturation effect of the intermetallic diffusion layer. To overcome this serious limitation, we intend to pursue our studies increasing the temperature of the process to yield liquid compounds at the cathode, which would leave the surface rapidly.
4. Concluding remarks
This article shows that the removal of lanthanides from nuclear waste dissolved in molten fluorides can be expected by electrodeposition on reactive cathodes such as nickel or copper, in the form of surface alloys formed with the substrate. Compared with the use of inert
cathodes yielding pure electrodeposited metals, the characteristics offered by reactive cathode materials are that the depolarization of the cathodic reaction should lead to extraction rates of about 100% and that, as the reaction product remains on the substrate as compact layers, the molten solution can be cleared of the extracted elements.
Besides, we noted that the growth of the surface alloys is rapid, which is promising for further extraction processes.
The future task will be to improve the kinetic parameters of the process in order to obtain extraction rates of 100% in a short time; in particular increasing the temperature should play a key role in enhancing intermetallic diffusion.
The cathode surface was rich in Ln(0). If the working temperature is sufficient, these surface compounds can be in liquid form and fall to the bottom of the crucible for easy recovery. Moreover, as the reaction product continuously leaves the surface of the cathode, the electrode surface is constantly renewed avoiding the limitation of the kinetics by saturation effects.
References
[1] http://gif.inel.gov/roadmap/pdfs/gen_iv_raodmap.pdf
[2] C. Hamel, P. Chamelot, P. Taxil (2004) Electrochim. Acta 49:4467
[3] C. Nourry, L. Massot, P. Chamelot, P. Taxil (2008) Electrochim. Acta 53:2650 [4] Binary Alloy Phase Diagrams, Second Edition ASM International (1996)
[5] T. Nohira, H. Kambara, K. Ameazawa, Y. Ito (2005) J. Electrochem. Soc. 152:C183 [6] Q. Yang, G. Liu, Y. Ao (1994) Proceedings - Electrochemical Society 94:498 [7] T. Kubota, T. Iida, T. Nohira, Y. Ito (2004) J. All. Comp. 379:256
[8] P. Chamelot, B. Lafage, P. Taxil (1994) Electrochim. Acta 39:2571
[9] L. Massot, P. Chamelot, F. Bouyer, P. Taxil (2003) Electrochim. Acta 48:465 [10] Y. Berghoute, A. Salmi, F. Lantelme (1994) J. Electroanal. Chem. 365:171
[11] P. Chamelot, L. Massot, C. Hamel, C. Nourry, P. Taxil (2007) J. Nucl. Mat. 360:64 [12] P. Taxil, P. Chamelot, L. Massot, C. Hamel (2003) J. Mining Met. 39:B177
[13] W. Weppner, R.A. Huggins, (1977) J. Electrochem. Soc. 124:1569 [14] W. Weppner, R.A. Huggins, (1978) J. Electrochem. Soc. 125:5
[15] G.S. Picard, Y.E. Mottot, B.L. Trémillon (1983) Proc. of the 4th Internat. Symp. on Molten Salts, Electrochemical Society Symposium, San Francisco
[16] P. Taxil (1986) Thesis, Paul Sabatier University, Toulouse [17] P. Taxil (1985) J. Less Common Met. 113:89
[18] S. Raghavan, G.N.K. Iyengar, K.P. Abraham (1985) J. Chem. Thermodyn. 17:585. [19] SGTE Database. http://www.sgte.org/
Legends of figures
Figure 1Comparison of the cyclic voltammograms of the LiF-CaF2-NdF3 (0.1 mol kg-1) system on
tantalum, nickel and copper electrodes at 100 mV/s and T = 840°C. Aux. El.: vitreous carbon;
Quasi-reference El.: Pt.
Figure 2
Comparison of the cyclic voltammograms of the LiF-CaF2-GdF3 (0.1 mol kg-1) system on
tantalum, nickel and copper electrodes at 100 mV/s and T = 840°C. Aux. El.: vitreous carbon;
Quasi-reference El.: Pt.
Figure 3
Open-circuit chronopotentiogram of the LiF-CaF2-NdF3 (0.1 mol kg-1)system on nickel and
copper electrodes at T = 840°C. Aux. El.: vitreous carbon ; Quasi-reference El.: Pt.
Figure 4
Open-circuit chronopotentiogram of the LiF-CaF2-GdF3 (0.1 mol kg-1)system on nickel and
copper electrodes at T = 840°C. Aux. El.: vitreous carbon; Quasi-reference El.: Pt.
Figure 5
SEM micrograph of a cross section of a copper plate after reduction of NdF3 at 840°C
5-a: i = -47 mA cm-2, time = 3 minutes.
Figure 6
SEM micrograph of a cross section of a copper plate after reduction of GdF3 at 840°C:
6-a: i = -13 mA cm-2, time =1 hour.
6-b: i = -32 mA cm-2, time = 2 hours.
Figure 7
SEM micrograph of a cross section of a nickel sheet after reduction of NdF3 at 840°C:
7-a: i = -35 mA cm-2, time = 2 hours.
7-b: i =-55 mA cm-2, time = 30 minutes.
Figure 8
SEM micrograph of a cross section of a nickel sheet after reduction of GdF3 at 840°C:
8-a: i = -63 mA cm-2, time = 2 hours.
8-b: i = -110 mA cm-2, time = 1 hour.
Table 1
Depolarisation term ΔE for each system (Cu/Nd; Ni/Nd; Cu/Gd; Ni/Gd) and the
corresponding theoretical extraction efficiency for the systems M/Ln (M = Cu, Ni ; Ln = Nd, Gd)
Table 2
Table 3
Gibbs energy of each compound of the systems M/Nd (M = Cu, Ni), compared to the values calculated using SGTE database [19] for Cu/Nd system.
Table 4
Figure 1 -0.8 -0.6 -0.4 -0.2 0 0.2 0.4 0.6 -2 -1.5 -1 -0.5 0 E / V I / A c m -2 Ni Cu Ta Figure 2
Figure 3 -2 -1.8 -1.6 -1.4 -1.2 -1 -0.8 -0.6 -0.4 -0.2 0 0 100 200 300 400 500 600 Time / s E / V vs. Pt Cu Ni Figure 4 -2.5 -2 -1.5 -1 -0.5 0 0 100 200 300 400 Time / s E / V vs. Pt Ni Cu 400 500 Stop of the cathodic run
Figure 5a Figure 5b
Cu
Cu
6Nd
Cu
4Nd Resin
CuNd
Cu
2Nd
Resin
Cu
Cu
2Nd
Cu
6Nd
Cu
4Nd
Cu
Figure 6a Figure 6b
Cu
Cu
6Gd
Cu
9Gd
2Cu
Cu
6Gd
Cu
2Gd
Cu
9Gd
2Resin
Figure 7a Figure 7b
Ni
2Nd
Ni
3Nd
Resin
Ni
Resin
Ni
2Nd
Figure 8a Figure 8b
GdNi
2GdNi
3Ni
GdNi
2GdNi
3Ni
System Cu/Nd Ni/Nd Cu/Gd Ni/Gd Depolarisation term ΔE (V) 0.341 0.477 0.281 0.518 X (%) 99.9999 100 99.9998 100 Table 1 Compound Cu6Nd Ni5Nd Cu6Gd Ni5Gd Ln Alloy a 2.3 10-5 3.3 10-7 1.5 10-4 9.0 10-8 Table 2
System Compound deltaG° (kJ/mol) present work (SGTE database) [19] deltaG° (kJ/mol) Cu/Nd Cu6Nd -280 ± 22 -313 Cu5Nd -258 ± 18 -269 Cu4Nd -234 ± 15 -225 Cu2Nd -134 ± 12 -134 CuNd -67 ± 8 -71 Ni/Nd Ni5Nd -363 ± 20 - Ni7Nd2 -346 ± 18 - Ni3Nd -310 ± 17 - Ni2Nd -278 ± 14 - NiNd -232 ± 14 - Ni3Nd7 -194 ± 13 - NiNd3 -142 ± 10 - Table 3
System Compound Gibbs energy deltaG° (kJ/mol) present work Cu/Gd Cu6Gd -208 ± 17 Cu9Gd2 -141 ± 14 Cu2Gd -112 ± 12 CuGd -90 ± 8 Ni/Gd Ni5Gd -233 ± 20 Ni4Gd -231 ± 20 Ni7Gd2 -223 ± 18 Ni3Gd -213 ± 15 Ni2Gd -190 ± 13 NiGd -157 ± 12 Ni2Gd3 -146 ± 10 Table 4