CLASSIFICATION OF RICE FIELDS IN A COMPLEX LAND-USE WATERSHED IN
NORTHERN VIETNAM USING RADARSAT-2 DATA
Kim Huong Hoang(1), Monique Bernier(1), Sophie Duchesne(1), Minh Y Tran(2)
(1) ETE Center, National Institute of Scientific Research (INRS), Québec, Canada.
(2) Dept. Remote Sensing Technology, Space Technology Institute, VAST, Hanoi, Vietnam.
ABSTRACT
Due to the strong temporal backscatter signature when the rice grows above the water surface, Synthetic Aperture Radar (SAR) for paddy rice crop mapping is operational in Southern Vietnam (Mekong Delta). In Northern Vietnam, the rice mapping using SAR is a challenge and is rarely performed because of the complex land-use/land-cover. Nevertheless, the information of rice fields is important for hydrological simulation in the studied watershed. The purpose of the research is to adapt the classification methods and algorithms to monitor rice fields over a large and fragmented land-use area as the Câu River watershed, in northern Vietnam. RADARSAT-2 data were collected in dual-pol Standard and quad-pol Fine mode for two rice crop seasons. As result, RADARSAT-2 dual- and quad-pol data have demonstrated their capabilities to identify the cultivated rice fields. However, RADARSAT-2 dual-pol data in Standard mode could not identify all the rice fields identify by the quad-pol data in Fine mode.
Index Terms— Rice classification, SVM, Threshold,
Radarsat-2, Câu River watershed
1. INTRODUCTION
The focus of the Canadian project “Integrated management of the Câu River watershed” is to establish in Vietnam an integrated management of water quality at the watershed scale by adapting the model GIBSI [1], for sustainable river basin management. Among the required model inputs, the land cover map is obtained by processing satellite images and is used for hydrological simulations. The method based on optical images for classification and cartography of land cover [2] is well established in the context of river basin management and can be considered efficient. However, this method shows some disadvantages when applied to the finer scale regions where land use is complex and where cloud cover is frequent, as it is the case in the studied watershed. Particularly, the rice fields are difficult to detect by using the optical images, which are acquired during the dry season.
This paper presents two schemes to identify rice fields in a complex land-use watershed in northern Vietnam: Thresholding segmentation and SVM algorithm. The data used are C-band dual-polarization (HH, HV) and polarimetric (quad-pol) data from RADARSAT-2.
2. METHODOLOGY
The methods were applied on an agricultural region situated in Thai Nguyen province, Northern Vietnam, where the rice fields occupy more than 40% of the land. During the year, there are two rice crop seasons; in general, the first season (Spring - Vu Chiem) starts in February and is harvested in June, the second season (Traditional - Vu Mua) is planted in July and is harvested in October.
Two series of RADARSAT-2 images in C-band covering the centre region of the watershed have been acquired in 2009 and 2010. One series is dual-polarization (HH and HV) Standard mode data, the second are quad-polarization data in Fine mode.
2.1. Thresholding segmentation on dual-polarization (HH and HV) SAR data
First, a multichannel filtering [3] was applied aims to reduce the speckle effect while preserving spatial resolution on the Standard mode data. In order to understand the temporal behavior of the rice fields in the studied area, an analysis (pixel level) based on the backscattering coefficient ( 0) of rice and other vegetation types on HH and HV
polarization has been realized. Due to the complexity of topography and land-use, the experimental rice fields were chosen from three cultivated environments (Zone1: near the residential area, Zone 2: near the forest area, Zone 3: the “real” paddy rice area). Fig.1 shows the mean of 0 values
in HH polarization of four vegetation types in middle of the crop season: Rice (different states), Evergreen forest, Plantation forest (Eucalyptus Acacia) and Home garden (mix of different vegetables and tea plants).
1501
a) Zone 1 Zone 2 Zone 3 -15 -10 -5 0 B ac k sc at te ri n g, ( d B ) 19 août 2009 Riz 1 Riz 2 Riz 3 Riz 4 Forêt Plantation Jardin de famille Rice 1 Rice 2 Rice 3 Rice 4 Forest Home garden Plantation
b) Zone 1 Zone 2 Zone 3
-15 -10 -5 0 B a ck sc a tt er in g , (d B ) 16 avr. 2010 Riz 1 Riz 2 Riz 3 Riz 4 Forêt Plantation Jardin de famille Rice 1 Rice 2 Rice 3 Rice 4 Forest Home garden Plantation
Figure 1. Backscattering coefficients of rice and other vegetation types in HH polarization: a) Mid-Traditional season (19/08/2009),
b) Mid-Spring season (16/04/2010)
Except for rice fields, the statistics of the three other classes show a narrow dynamic range of 0 coefficients for both
polarizations. Regarding rice fields, the temporal dynamic is larger (-9 dB in HH and -7 dB in HV). During the growth cycle, the 0 coefficient shows a significant change
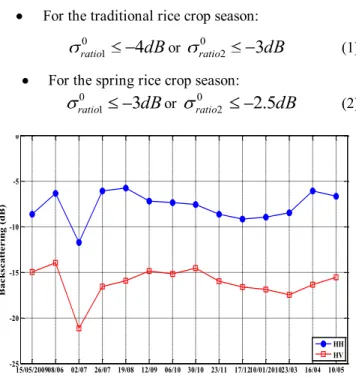
between each growing stage of the rice plants [4], the signal is especially strong in mid-season for HH polarization, which means in August and April (Fig 2). However, for some reasons, the rice grow up later or earlier on some fields than the agricultural calendar, then the backscattering coefficient of these rice paddies are not typical of the mid-season (Fig 2). Then, the segmentation thresholds [5], [6] were determined based on the temporal variation of rice backscattering in HH polarization using the rice backscattering ratio ( 0 ratio) between the beginning (date 1) and the middle (date 2) of the rice season. Due to the reason mentioned above, the beginning of the rice crop season varies, so date 1 changed while calculating the 0 ratio, depending on the temporal
backscattering behavior. Furthermore, the backscattering behavior being different in the traditional and spring rice crop seasons, specific thresholds were determinate for each season:
For the traditional rice crop season:
dB
ratio0 1
4
or ratio0 23
dB
(1)For the spring rice crop season: ratio0
3
dB
1 or ratio0 22
.
5
dB
(2) 15/05/200908/06 02/07 26/07 19/08 12/09 06/10 30/10 23/11 17/1210/01/201023/03 16/04 10/05 -25 -20 -15 -10 -5 0 B ac k sc at te ri n g (d B )Variation temporelle de 0 moyen du riz en HH et HV, de mai 2009 à mai 2010
HH HV
Figure 2. Temporal variation of rice backscattering in HH and HV polarization from May 2009 to May 2010
2.2. Polarimetric SAR data classification using SVMs First, an Intensity-Driven Adaptive-Neighborhood (IDAN) filter [7] has been applied to each quad-polarization image to reduce the speckle.
Then, the coherency (T) matrix, the Freeman-Durden, and the H/A/ polarimetric decompositions [8] were calculated using PolSARpro software [9]. Each parameter was then tested for classifying the rice field using the SVM, a binary supervised classification method introduced in the 1990s by Vapnik [10]. The same procedure of the SVM classification was applied on the HH polarization to compare the efficiency between two types of data (dual- polarization and quad-polarization) for rice identification.
3. RESULTS
The signature analysis shows that the rice intensity values increase in the middle of the crop season and are different from other vegetation types in HH polarization. HH is also more suitable than HV polarization for rice identification. The application of the specific threshold for each season allowed creating regional maps where rice paddies are well differentiated. The classification accuracy is 71% using standard mode data. In parallel, the coherence (T) matrix was the best polarimetric parameter among the tested ones for rice extraction. The precision of the rice maps are 80%. The classification accuracy of HH polarization using the same SVM algorithm used for polarimetric data is 72%. Comparison of these classification results shows the
potential of the polarimetric data for rice detection in this study area. Both classification methods and data sets have demonstrated the capabilities of the RADARSAT-2 imagery to identify the cultivated rice fields, especially in the case of a complex land-use region as the Câu River watershed, in northern Vietnam.
Finally, those RADARSAT-2 rice maps were integrated in the land cover maps derived from optical images (SPOT HRVIR images), improving the quality of information of those land cover maps. By extension, the better quality of the input data for the hydrological simulations helps improve the quality of those simulations.
4. REFERENCES
[1] A.N. Rousseau, A. Mailhot, R. Turcotte, M. Duchemin, C. Blanchette, M. Roux, N.Etong, J. Dupont and J.-P. Villeneuve, "GIBSI - An integrated modelling system prototype for river basin management," Hydrobiologia,vol. 422/423, Kluwer Academic Publishers, Netherlands, pp. 465-475, 2000.
[2] K.H. Hoang, M. Bernier and J.-P. Villeneuve, "Les changements de l’occupation du sol dans bassin versant de la rivière Câu (Viêtnam). Essai sur une approche diachronique,"
Revue Télédétection, vol. 8, no. 4, pp. 227-236, Dec., 2009.
[3] Quegan. S and J.J Yu, "Filtering of Multichannel SAR Images", IEEE Trans. Geosci. Remote Sens., vol. 39, no.11, pp. 2373-2379, Nov. 2001.
[4] K. H. Hoang, M. Bernier, S. Duchesne, M. Y. Tran," Identification of Rice Fields in a Complex Land-Use Region Using RADARSAT-2 Data," in Proceeding of the 3rd
International Asia-Pacific Conference on Synthetic Aperture Radar (APSAR), pp.1-4, Seoul, Korea. 26-30 Sept. 2011.
[5] T. LeToan, F. Ribbes, L-F. Wang, N. Floury, K-H. Ding, J. A. Kong, M. Fujita, T. Kurosu, "Rice crop mapping and monitoring using ERS-1 data based on experiment and modeling results,"
IEEE Trans. Geosci. Remote Sens., vol. 35, no. 1, pp. 41-52, Jan.
1997.
[6] N. LamDao, A. Apan, F. Young, T. LeVan, T. LeToan and A. Bouvet, "Rice monitoring using ENVISAT ASAR data: Preliminary results of a case study in the Mekong River Delta, Vietnam," Proceedings online of the ACRS, Kuala Lumpur, Malaysia, Nov. 2007.
[7] G. Vasile, E. Trouvé, J.S. Lee and V. Buzuloiu, "Intensity-Driven Adaptive-Neighborhood Technique for Polarimetric and Interferometric SAR Parameters Estimation," IEEE Trans.
Geosci. Remote Sens., vol. 44, no. 6, pp. 1609-1621, June 2006.
[8] Lee, J.-S and E. Pottier, Polarimetric radar imaging. From basics to applications, CRC Press, USA, 2009.
[9] PolSARpro, Polarimetric SAR data processing and Educational Tool, 2011
[10] V. N. Vapnik, "An Overview of Statistical Learning Theory," IEEE Trans. Neural Networks, vol. 10, no. 5, Sept. 1999.