This is an author-deposited version published in:
http://oatao.univ-toulouse.fr/
Eprints ID: 5511
To cite this version:
Arshad, Muhammad and Murtaza, Ghulam and Arif Ali, Muhammad and
Shafiq, Muhammad and Dumat, Camille and Ahmed, Niaz Wheat growth and
phytoavailability of copper and zinc as affected by soil texture in saline-sodic
conditions. (2011) Pakistan Journal of Botany, vol.43 (n° 5). pp.2433-2439.
ISSN 2070-3368
O
pen
A
rchive
T
oulouse
A
rchive
O
uverte (
OATAO
)
OATAO is an open access repository that collects the work of Toulouse researchers and
makes it freely available over the web where possible.
Any correspondence concerning this service should be sent to the repository
administrator:
[email protected]
WHEAT GROWTH AND PHYTOAVAILABILITY OF COPPER AND ZINC AS
AFFECTED BY SOIL TEXTURE IN SALINE-SODIC CONDITIONS
MUHAMMAD ARSHAD1,2,*, GHULAM MURTAZA1, MUHAMMAD ARIF ALI1,3, MUHAMMAD SHAFIQ1, CAMILLE DUMAT4 AND NIAZ AHMED3
1
Institute of Soil & Environmental Sciences, University of Agriculture, Faisalabad, 38000, Pakistan
2
Institute of Environmental Sciences & Engineering (IESE-SCEE) - National University of Sciences & Technology, H-12, Islamabad, 44000, Pakistan
3
Department of Soil Science, University College of Agriculture Bahauddin Zakariya University, Multan 60800 Pakistan
4
ECOLAB, UMR5245 CNRS-UPS-INPT, Avenue de l’Agrobiopole, 31326, Castanet-Tolosan, France.
Abstract
Nutrient disorders in saline-sodic soils can adversely affect crop growth. In order to evaluate the growth response of wheat (Triticum aestivum L.) to Cu and Zn and the phytoavailability of these essential elements, a pot experiment was conducted in
three different textured saline-sodic soils [sandy loam (SL), sandy clay loam (SCL) and clay (C)] having an ECe 8.63, 8.80, 8.98
dS m–1 and SAR 21.66, 23.48, 24.84 (mmol L–1)1/2 respectively. Seven treatments including levels of Cu (4, 6 and 8 mg kg–1)
and levels of Zn (4, 6 and 8 mg kg–1) were separately applied together with a single control treatment. Dry matter yield (straw +
grain) of wheat increased up to 35.2% with Cu and up to 31.2 % with Zn application relative to the control. As soil clay content increased, dry matter yield decreased up to 39.2% in SCL and up to 62.7% in C soil when compared to SL soil. Application of
Cu increased the concentration in both wheat straw and grains up to 2.46 and 2.20 mg kg–1 DW respectively relative to the
control. Zinc concentration in wheat straw and grains was also increased up to 29.97 and 29.40 mg kg–1 DW respectively
relative to the controls. Copper application significantly increased Zn concentrations in wheat plants. Introduction
Micronutrient deficiencies are becoming a serious problem as a result of enhanced nutrient demand from highly intensive and exploitative agriculture, coupled with the use of single-nutrient fertilizers and low amounts of organic manures. Phenotypic plasticity and physiological versatility of plants can buffer nutrient deficiency and toxicity to some extent, thereby moderating the effect on crop yields (Savithri
et al., 1999). While drought and salinity both threaten crop
productivity worldwide (Hu & Schmidhalter, 2005), salinity stress remains one of the world's oldest and the most serious environmental problems, and continues to substantially hamper crop productivity in many arid and semi arid regions (Ali et al., 2007). Currently, worldwide about 50% of irrigated land, which has at least twice the productivity of rain-fed land and produces as much as one-third of the world’s food, is affected by salinization (Hillel, 2000). Crop yields decline dramatically when pH of the soil solution exceeds 8.5 or the ECe exceeds 4 dS m
−1
and when ECe
values are very high, crop yields would be seriously affected (Zheng et al., 2008).
Phytoavailability of essential nutrients in saline-sodic and sodic soils may vary from deficiency of several nutrients to high levels of Na+ and Cl- (Curtin & Naidu, 1998; Qadir & Schubert, 2002). Sodic soils usually have poor availability of most micronutrients, which is generally attributed to high soil pH (Page et al., 1990; Naidu & Rengasamy, 1993). In general, the solubility of cationic trace elements decreases with increasing pH, while the solubility of the anionic trace elements increases with increasing pH (Page et al., 1990). Therefore, in sodic soils, the solubility of micronutrients such as copper (Cu), iron (Fe), manganese (Mn), and zinc (Zn) is particularly low (Curtin & Naidu, 1998), and plants grown on these soils often experience deficiency of these elements (Page et al., 1990). However, elemental deficiency is not always experienced (Qadir & Schubert, 2002) because the soil-binding agents, especially soil organic matter and hydrous ferric and manganese oxides as well as carbonate can all
influence the phytoavailability of metals (Sauvé et al., 2000; Dumat et al., 2006).
In addition to these factors, the presence of multiple elements can give rise to complex interactions affecting not only plant uptake but also translocation within the plant (Luo & Rimmer, 1995). Diverse results by different authors have been reported regarding Cu-Zn interactions. Beckett & Davis (1978) observed a slight antagonistic effect between Zn and Cu for barley. Barley growth was regulated by phytoavailable Zn and Cu where, Cu increased the toxic effect of Zn (Luo & Rimmer, 1995). Tani & Barrington (2005) reported an antagonistic effect of Cu on Zn uptake in Buckwheat for all parts of the plant examined, except for the roots where the reverse was true, while Sanders et al., (1987) reported that Cu had no significant effect on Zn uptake by red beets.
Wheat (Triticum aestivum L.) is the most widely grown cereal grain in the world and as a staple food it is second only to rice in consumption. Around one–third of wheat in the developing world is produced in environments which are considered to be marginal for wheat production, particularly due to high soil salinity and sodicity. However, the need to improve the productivity of these marginal areas is becoming increasingly important with regard to world food pressure. Wheat is a relatively sensitive crop to copper (Brown & Clark, 1977) and zinc (Hamid & Ahmad, 2001) deficiencies.
At present, phytoavailability studies regarding essential nutrients aim to balance the quantities of nutrients added to the soils in order to favour plant growth without inducing risk of toxicity. Understanding of the mechanisms and soil properties influencing nutrient availability can help to increase crop productivity. Particularly, coupling of salinity problems with nutrient constraints can improve crop production and management of marginal soils. The objective of the present study is to determine the response of wheat to Cu and Zn application and to assess plant availability of these two essential micronutrients in three different textured saline-sodic soils.
Materials and Methods
Sampling and characterization of soils: Three different
soils for the present study were collected from the region of Faisalabad (Pakistan) with mean annual precipitation of 370 mm. The cropping pattern is dominated by wheat, maize and sorghum at Faisalabad (Muhammad et al., 2008). Physical and chemical properties of the samples having different textures [Sandy loam (SL), sandy clay loam (SCL) and clay (C)] are presented in Table 1. The soils were air-dried, ground and passed through a 2 mm sieve. Soil characteristic determined included the fraction of sand, silt and clay by Hydrometer method (Bouyoucos, 1962), saturation percentage, pH of saturated soil paste (pHs), electrical conductivity of saturation extract (ECe),
cations (Ca+Mg, Na, K), anions (carbonates, bicarbonates, chlorides, sulphates) and Sodium Adsorption Ratio-SAR (US Salinity Lab. Staff, 1954),
available phosphorus, total nitrogen, organic matter (Jackson, 1962), Cu and Zn (AB–DTPA method; Soltanpour, 1985). The AB-DTPA method of extraction is particularly used for determination of micronutrients in alkaline soils. AB-DTPA solution was prepared by dissolving 79.06 g NH4HCO3 and 1.97 g of DTPA in one
liter of distilled water. Soil (10 g) was subsequently extracted with freshly prepared extracting solution (20 mL) in a 250 mL Erlenmeyer flask. The mixture was shaken on a reciprocating shaker at 180 cycles per minute for 15 minutes in an unstoppered flask. The extract was filtered and analyzed for Cu and Zn using an atomic absorption spectrophotometer (Perkin Elmer Analyst 100). These properties of soil mainly indicate that all the three soils were saline-sodic in nature and were copper ([Cu]Soil <0.5 mg kg
–1
) and zinc ([Zn]Soil <0.9 mg kg 1
) deficient (Soltanpour, 1985).
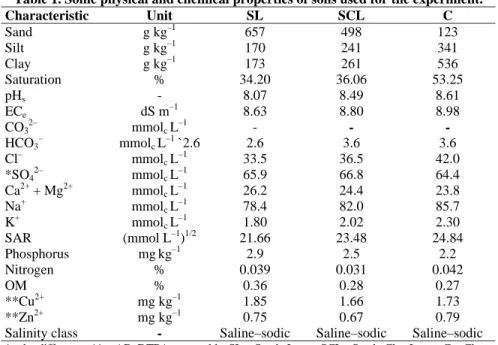
Table 1. Some physical and chemical properties of soils used for the experiment.
Characteristic Unit SL SCL C Sand g kg–1 657 498 123 Silt g kg–1 170 241 341 Clay g kg–1 173 261 536 Saturation % 34.20 36.06 53.25 pHs - 8.07 8.49 8.61 ECe dS m–1 8.63 8.80 8.98 CO32– mmolc L–1 - - - HCO3 – mmolc L –1 `2.6 2.6 3.6 3.6 Cl– mmolc L–1 33.5 36.5 42.0 *SO42– mmolc L–1 65.9 66.8 64.4 Ca2+ + Mg2+ mmolc L–1 26.2 24.4 23.8 Na+ mmol c L–1 78.4 82.0 85.7 K+ mmolc L –1 1.80 2.02 2.30 SAR (mmol L–1)1/2 21.66 23.48 24.84 Phosphorus mgkg–1 2.9 2.5 2.2 Nitrogen % 0.039 0.031 0.042 OM % 0.36 0.28 0.27 **Cu2+ mg kg–1 1.85 1.66 1.73 **Zn2+ mg kg–1 0.75 0.67 0.79 Salinity class - Saline–sodic Saline–sodic Saline–sodic
* = by difference, ** = AB–DTPA extractable, SL = Sandy Loam, SCL= Sandy Clay Loam, C = Clay.
Treatments and culture experiments: Wheat
culture experiments were conducted in the wire-house, Institute of Soil and Environmental Sciences, University of Agriculture, Faisalabad, Pakistan. The pots were filled with 12 kg of soil. There were seven treatments, replicated thrice in a completely randomized design. The treatments were: control (0), 4 mg Cu kg–1 soil (Cu4), 6 mg Cu kg–1soil (Cu6), 8 mg Cu kg– 1 soil (Cu8), 4 mg Zn kg–1 soil (Zn4), 6 mg Zn kg–1soil (Zn6) and 8 mg Zn kg–1 soil (Zn8). Calculated amounts of Cu and Zn were mixed directly in to the soil before sowing wheat.
Wheat variety Inqlab–91 was planted by the field capacity sowing method. Wheat seedlings were thinned to five per pot 25 days after the sowing date; uprooted plants were cut into pieces and mixed into the same pot by hoeing. The wheat crop was fertilized with NPK; 1.2–0.6– 0.6 g per 12 kg soil respectively as basal dose. Sources of NPK were urea, diammonium phosphate and potassium sulphate. The whole amount of P and K, and half the amount of N were applied at the time of sowing. While remaining nitrogen was applied in two equal splits 45 and 75 days after sowing. The crop was irrigated with fresh water according to the crops water requirements.
Measure of wheat growth parameters: At harvest, plant
height was measured manually using a meter-rod. Numbers of tillers per plant were also counted. Plants were harvested from the base, put into paper bags and oven-dried at 65°C over 72 h. The dried plant material was subsequently weighed and after drying, straw and
grains were separated for analysis of Cu and Zn concentrations.
Determination of Cu and Zn absorption: Oven-dried
straw and grain samples were ground using a steel Wiley Mill to obtain a fine powder (<1 mm size). Dried and ground plant material (1 g) was digested in diacid mixture consisting of concentrated HNO3 (20 mL) and 10 mL 70%
HClO4 (10 mL) in a conical flask through hot plate. After
digestion, samples were cooled to room temperature and diluted to 50 mL with deionized water and stored in clean, airtight bottles prior to the determination of Cu and Zn by atomic absorption using a Perkin Elmer Analyst 100 spectrophotometer.
Statistical analysis: The data obtained was subjected to
Analysis of Variance (ANOVA) and DMR (Duncan’s Multiple Range) test to differentiate any treatment effects (Steel & Torrie, 1980).
Results
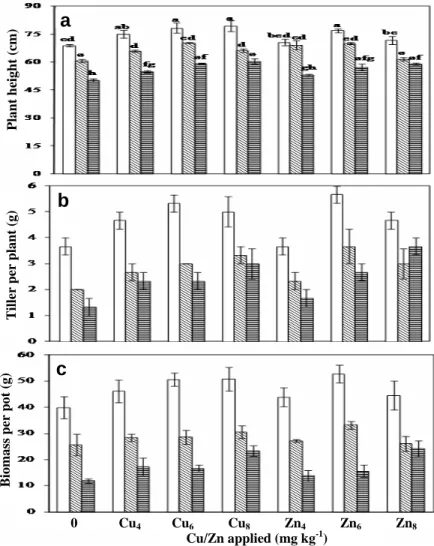
Morphological plant
characteristics: Balanced plant
nutrition ensures good plant growth. The results regarding plant height are shown in Fig. 1a. The effect of soil texture, treatments and their interactions were significant (p<0.01). The maximum plant height (79.3 cm) was observed with Cu8 in SL soil while minimum plant height (50.3 cm) was observed for control in C textured soil. In general, more tillers ensures better crop yield. Results regarding number of tillers per plant are given in Fig. 1b. The effect of texture and treatments was significant (p<0.01) while the interaction between soil texture and treatments were statistically non– significant. The maximum mean value for tillers per plant was 5.67 with Zn6 in SCL and was the minimum in the control for the same soil. Treatment Zn4 was non–significant relative to control while all the other treatments were significantly better over these two. Treatments Cu4 and Zn6 were mutually significant but non-significant with respect to Cu6, Cu8 and Zn8.
Total biomass (straw + grains) per pot for wheat crop varied considerably with different treatments (Fig. 1c). The treatments differed significantly (p<0.05) while interaction of soil texture and applied treatments was non-significant. Maximum biomass was found in Zn6, i.e.,
52.80 g/pot in SL soil while minimum biomass (11.85 g/pot) was obtained in C soil with the control. Mean values for total biomass were significant (p<0.01) with respect to texture of soil. Overall means for treatments showed that there was gradual increase in total biomass with increasing levels of Cu and Zn applied.
Fig. 1. Effect of soil texture, Cu and Zn application on growth parameters: a) plant height, b) number of tillers per plant and c) biomass per pot. Bars with different letters indicate that texture x treatment interaction is significant. [Sandy Loam ( ): Sandy clay loam ( ): Clay ( )].
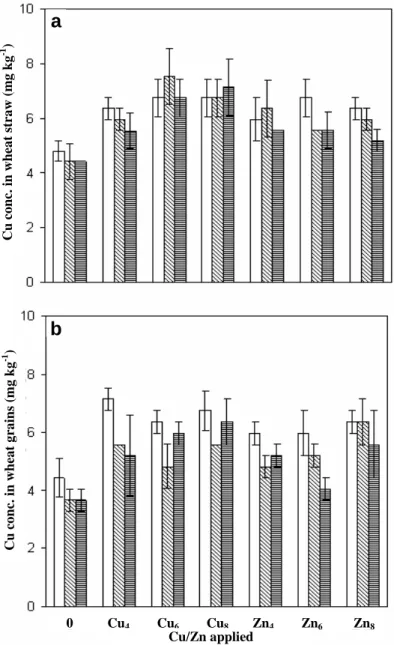
Concentration of Cu in wheat straw and grains (mg kg–1): Copper concentrations in wheat straw as influenced
by the soil texture and application of treatments are given in Fig. 2a. The effect of various treatments on Cu concentration in straw was statistically significant. The average copper concentration ranged from 4.43 to 7.54 mg Cu kg–1
. The maximum concentration of Cu was found for Cu6 in SCL soil while the lowest values were observed for the control in SCL and C soil. There was no pronounced effect of soil texture on copper concentration in wheat straw. Statistical analysis showed that there was not significant effect of soil texture on Cu concentrations in wheat straw. The interaction between soil texture and treatments was also not significant. However, Cu and Zn treatments showed significant (p<0.01) differences over controls. There was gradual increase in Cu concentration with increasing levels of Cu applied. With application of Zn alone, concentration of Cu increased when compared
to the control, but values for Cu concentration in wheat straw were low when compared to Cu treatments.
Copper concentration in wheat grains as affected by various soil textures and treatments is given in Fig. 2b. Statistical analysis of the data indicated that soil texture and treatments had significant effects on Cu concentrations in wheat grains (p<0.01), but the interaction between texture and treatments was not significant. Overall means showed that the concentration of Cu in wheat grains was the highest for the SL soil and was statistically different to Cu concentrations in wheat grains for the SCL and C textured soil. However, Copper concentration in wheat grains in SCL and C soil were not significantly different from each other. All the treatments had significant effect (p<0.01) when compared to the control. The maximum concentration was observed in wheat grains grown with Cu8.
a
b
c
Pl ant he ig ht ( cm ) B iomass per p o t (g) Tiller per plant ( g ) Cu/Zn applied (mg kg-1) 0 Cu4 Cu6 Cu8 Zn4 Zn6 Zn8Fig. 2. Effect of texture, Cu and Zn application on Cu concentration in wheat: a) Straw and b) Grains.
[Sandy loam ( ): Sandy Clay Loam ( ): Clay ( )].
Concentration of Zn in wheat straw and grains (mg kg–1): Concentration of zinc in
wheat straw depicting the influence of various textures and different levels of Cu and Zn are presented in Figs. 3a & 3b. The effects of texture on Zn concentration of wheat straw were significant (p<0.01). Overall means showed that there was gradual decrease in Zn concentration with increasing percentage of clay in the soil. Maximum mean value for Zn concentration was recorded for SL and the minimum Zn concentration for C soil. Treatment effects were significant (p<0.01). Zinc concentration ranged from 8.45 to 48.66 mg kg–1 DW. The maximum value of Zn was observed for Zn8 in SL soil and the minimum concentration was recorded for the control in C soil. Overall means for treatments showed that all the treatments were significantly (p<0.01) different from the control. There was gradual increase in the concentration of zinc in wheat straw with increasing levels of Cu and Zn applied over control. Soil texture and treatments also interacted significantly (p<0.01). However, the effect of texture for SL and SCL was not significant. In general, Zn concentration in wheat grains was lower in the SCL soil.
The effect of soil texture and treatments on Zn concentration in wheat grains were both statistically significant (Figs. 4a & 4b). The interaction between texture and treatments was also significant (p<0.01). The maximum Zn concentration (54.42 mg kg–1 DW) was observed for Zn8 in SCL and the minimum (58.23 mg kg–1 DW) was observed for the control in SCL soil. Zinc concentration in wheat grains increased gradually with Cu and Zn applied. With increases in Cu applied, Zn concentration of grains was enhanced significantly over the control, but was consistently lower than that at the lowest level of Zn applied.
Discussion
Growth response of wheat to Cu and Zn application in terms of plant height, tillering and biomass: Plant
height increased by 10.3 cm with Cu and 8.0 cm with Zn application in the SL soil. In the SCL soil, the increase was up to 9.6 and 9.3 cm with Cu and Zn application respectively. Copper and Zn treatments also enhanced plant height up to 10.0 and 8.7 cm respectively in C soil. A decrease in plant height of 8.1 cm was observed in SCL and 18.1 cm in C soil when compared to the SL soil. High clay content in soil negatively affected the number of tillers. Compared to the control, dry matter wheat yield increased up to 35.2% with Cu and 31.2% with Zn application. With increasing amounts of clay in the soil, the dry matter yield decreased to 39.2% in SCL and to 62.7% in C soil. Decrease in growth was attributed to
increased Cu and Zn binding at exchange sites of the clays which ultimately suppressed plant availability.
Different factors control wheat growth in saline-sodic soils. Field studies have shown significant increases in crop yields with the application of Zn fertilizer to sodic soils (Gupta & Abrol, 1990). Copper and Zn applications ensure better plant growth (Chaudhry & Loneragan, 1970). Dry matter yield of wheat increased by increasing the rates of applied Cu and Zn (Imtiaz et al., 2003). High clay content and SAR resulted in a high moisture content which ultimately reduced wheat growth due to reduced soil aeration. Soil clay content is important in influencing both the stability of the soil structure and hydraulic properties because of the large surface area of clay particles, their thin platy shape, and their negative lattice charge, which is balanced by exchangeable cations (Qadir
et al., 2002). Cu c o nc . in w h ea t gr ains ( m g kg -1 ) 0 Cu4 Cu6 Cu8 Zn4 Zn6 Zn8 Cu/Zn applied Cu conc. in wheat straw (m g kg -1 )
a
b
R2 (SL) = 0.96 R2 (SCL) = 0.99 R2 (C) = 0.94 5 10 15 20 0 4 6 8 Cu applied (m g kg-1) Z n c onc . i n w heat s traw ( m g k g -1) a R2 (SL) = 0.98 R2 (SCL) = 0.97 R2 (C) = 0.96 5 15 25 35 45 0 4 6 8 Zn applied (mg kg-1) Z n c onc . i n w heat s tr aw ( m g k g -1) b
Fig. 3. Zn concentration in wheat straw influenced by soil texture and Cu/Zn application: a) effect of Cu applied, b) effect of Zn applied. [SL ( )-Sandy loam: SCL ( )-Sandy clay loam: C ( )-Clay]. R2 (SCL) = 0.97 R2 (SL) = 0.86 R2 (C) = 0.78 20 30 40 50 60 0 4 6 8 Zn applied (mg kg-1) Z n c o nc . in w h e a t gra ins ( m g k g -1) b R2 (SL) = 0.93 R2 (C) = 0.97 R2 (SCL) = 0.99 20 25 30 35 0 4 6 8 Cu applied (mg kg-1) Z n c onc . i n w heat gr ai ns ( m g k g -1) a
Fig. 4. Zn concentration in wheat grains influenced by soil texture and Cu/Zn application: a) effect of Cu applied, b) effect of Zn applied. [SL ( )-Sandy loam: SCL ( )-Sandy clay loam: C ( )-Clay].
Concentration of Cu and Zn in wheat influenced by Cu and Zn applications and soil texture: Copper
concentration in plants generally varies from 5 to 20 mg kg–1 (Katyal & Randhawa, 1983). The threshold value below which plants exhibit deficiency symptoms and respond to Cu fertilization varies among plant species. In general, less than 5 mg Cu kg–1 dry plant matter is considered deficient (Katyal & Randhawa, 1983). Copper concentration in wheat straw and grains from the controls were in the marginal range. With application of Cu, concentration in wheat straw was increased up to 2.46 mg kg–1 when compared to the control. In wheat grains, Cu concentration was increased up to 2.20 mg kg–1 for Cu8
when compared to the control. High clay concentrations in soils reduced Cu concentration to 1.00 mg kg–1 in SCL and C when compared to SL soil.
Zinc concentration in healthy plant ranges from 20-100 mg kg–1 dry matter (Katyal & Randhawa, 1983). Zinc concentration < 20 mg kg–1 suggests Zn deficiency (Katyal & Randhawa, 1983; Marschner, 1995). Zinc concentration in wheat straw was increased up to 29.97 mg kg–1 DW at the highest level applied when compared to the control. Zinc concentration decreased to 2.69 mg kg–1 and 8.73 mg kg–1 DW in SCL and C respectively
when compared to the SL soil. A strong relationship was observed between Cu and Zn applied to resulting Zn concentrations in straw in all three soils. There was linear increase in Zn concentration with increasing levels of Cu applied and high values of R2 (Fig. 3a) were recorded irrespective of the soil texture. Similar trends were observed for Zn concentrations (Fig. 3b) showing strong dependency (R2 ≥ 0.94) on Zn applied.
Zinc concentration in grains increased up to 29.40 mg kg–1 for Zn8 when compared to the control. While with increasing quantity of clay in soil, uptake decreased by 1.08 mg kg–1 and 3.88 mg kg–1 in SCL and C respectively when compared to the SL soil. There was linear relationship between Cu applied and the Zn concentration in wheat grains with R2 value ≥ 0.93 (Fig. 4a) in all the three soils. The correlation between Zn applied and resulting concentrations of Zn in wheat grains was linear for SCL (R2 = 0.97) whereas R2 values dropped to 0.86 and 0.78 for SL and C soils respectively.
The relationship between salinity/sodicity and micronutrient nutrition is complex and these stresses can increase, decrease, or have no effect on the micronutrient concentration in plant shoots (Grattan & Grieve, 1999). Copper (CuSO4) application increased Cu concentration
in plant roots and tops in wheat crop (Chaudhry & Loneragan, 1970). Malhi et al., (2005) and Brennan & Bolland (2003) reported that copper concentration in dried shoots of wheat increased with increasing Cu applied to the wheat crop. A linear increase in Zn concentration in plant parts with increasing supplies of Zn fertilizer was also reported by Imtiaz et al., (2003). Retention of Cu by the solid phase of the soil and in consequence its bioavailability depends on particle-size distribution: a metal enrichment in the clay fraction is generally observed (Besnard et al., 2001; Dumat et al., 2006). In a high clay content and dispersed structure due to high Na+ in soil, Zn2+ ions might well be fixed tightly and unavailable for plants (Pendias & Pendias, 1992).
Copper and zinc relationship: A reciprocal effect for
both Cu and Zn was observed with a single application of either Cu or Zn. Both metals increased the availability of each other resulting in enhanced concentrations compared to when the individual element was applied. The uptake of Cu was increased to 2.33 and 2.20 mg kg–1 in straw and grains respectively. Zinc concentration increased with increasing levels of Cu up to 6.35 and 7.08 mg kg–1 DW in straw and grains respectively. Comparatively, Cu is more electropositive and therefore more strongly bound at exchange sites than Zn. Copper also has the ability to replace Zn on exchange site resulting in increased concentrations of Zn in soil solution since Cu and Zn compete for the same exchange sites in soil (Pendias & Pendias, 1992). Kausar & Hamid, (1998) reported that both Cu and Zn increase solubility of each other in soil solution by depressing their fixation on soil components. According to Tani & Barrington (2005), increasing levels of Cu significantly increased Zn uptake by the plant shoots, grains and roots, while the higher level of Zn only slightly decreased Cu uptake, except in the root where Zn significantly increased Cu uptake. However, using young barley plants, Beckett & Davis (1978) observed that Cu slightly reduced Zn uptake, whereas with wheat, Zn was found to reduce Cu uptake. Luo & Rimmer (1995) also found similar effects with plants grown in soils irrigated with water bearing, singly or in combination, Zn at 0, 10, and 100 mg L-1 and Cu at 0 and 50 mg L-1. Critical examination of past research reveals that Cu-Zn interaction remains inconclusive because past research has been conducted using a range of different experimental conditions including the type of soil, field or pot studies, hydroponics and presence of multiple elements. Careful management of these two essential nutrients can ensure sustainable production without causing any damage to the environment by leaching at toxic levels, particularly in saline soils where the plants are already under stress conditions.
Conclusion
Soil texture appeared to be an important parameter affecting growth of wheat and availability of Cu and Zn in saline-sodic soils to wheat plants. Application of Cu and Zn to wheat in different textured saline-sodic soils significantly increased crop growth and wheat nutrient quality. Copper application increased Zn concentrations in wheat suggesting its higher tendency towards binding sites, subsequently making Zn more available to plants.
Our results indicate that careful consideration of soil texture is needed while planning for fertilizer requirements in saline-sodic soils.
Acknowledgments
The authors are thankful to Directorate of Research, University of Agriculture, Faisalabad, Pakistan for the financial support to conduct this research. We especially thank to Dr. Atta Muhammad Ranjha, Professor, Institute of Soil and Environmental Sciences, University of Agriculture, Faisalabad, Pakistan for his expert opinion and guidance throughout the study. We also thank Dr. Gary Owens, Centre for Environmental Risk Assessment and Remediation, for reading this manuscript prior to submission and for making many helpful suggestions and corrections.
References
Ali, Z., A. Salam, F.M. Azhar and I.A. Khan. 2007. Genotypic variation in salinity tolerance among spring and winter wheat (Triticum aestivum L.) accessions. S. Afr. J. Bot., 73: 70-75.
Beckett, P.H.T. and R.D. Davis. 1978. The additivity of the toxic effects of Cu, Ni and Zn in young barley.
New Phytol., 81: 155-173.
Besnard, E., C. Chenu and M. Robert. 2001. Influence of organic amendments on copper distribution among particle-size and density fractions in Champagne vineyard soils. Environ. Pollut., 112: 329-337. Bouyoucos, G.J. 1962. Hydrometer method improved for
making particle soil analysis of soil. Agron. J., 54: 464-465.
Brennan, R.F. and M.D.A. Bolland. 2003. Comparing copper requirements of faba bean, chickpea and lentil with spring wheat. J. Plant Nutr., 26: 883-899. Brown, J.C. and R.B. Clark. 1977. Copper as essential to
wheat production. Plant Soil, 48: 509-523.
Chaudhry, F.M. and J.F. Loneragan. 1970. Effects of nitrogen, copper and zinc fertilizers on the copper and zinc nutrition of wheat plants. Aust. J. Agri. Res., 21: 865-879.
Curtain, D. and R. Naidu. 1998. Fertility constraints to plant production. In: Sodic Soils: Distribution,
Management and Environmental Consequences.
(Eds.): M.E. Sumner and R. Naidu. Oxford University Press, New York, pp. 107-123.
Dumat, C., K. Quenea, A. Bermond, S. Toinen and M.F. Benedetti. 2006. Study of the trace metal ion influence on the turnover of soil organic matter in cultivated contaminated soils. Environ. Pollut., 142: 521-529.
Grattan, S.R. and C.M. Grieve. 1999. Salinity–Mineral nutrient relations in horticultural crops. Sci. Hortic., 78: 127-157.
Gupta, R.K. and I.P. Abrol. 1990. Salt-affected soils: their reclamation and management for crop production.
Adv. Soil Sci., 11: 223-288.
Hamid, A. and N. Ahmad. 2001. Integrated plant nutrition system: Development and rural poverty alleviation. Regional Workshop on Integrated Plant Nutrition System (IPNS) Development and Rural Poverty
Alleviation, 18-20 September 2001, Bangkok, Thailand.
Hillel, D. 2000. Salinity Management for Sustainable
Irrigation. The World Bank, Washington, D.C.
Hu, Y. and U. Schmidhalter. 2005. Drought and salinity: A comparison of their effects on mineral nutrition of plants. J. Plant Nutr. Soil Sci., 168: 541-549.
Imtiaz, M., B.J. Alloway, K.H. Shah, S.H. Siddiqui, M.Y. Memon, M. Aslam and P. Khan. 2003. Zinc nutrition of wheat: I: Growth and zinc uptake. Asian J. Plant
Sci., 2: 152-155.
Jackson, M.L. 1962. Soil Chemical Analysis. Constable and Co. Ltd. London, pp. 496.
Jalil, A., F. Selles and J.M. Clark. 1994. Effect of Cd on growth and uptake of Cd and other elements by durum wheat. J. Plant Nutr., 17: 1839-1858.
Katyal, J.C. and N.S. Randhawa. 1983. Micronutrients.
FAO Fertilizer and Plant Nutrition Bulletin 7. Rome:
Food and Agriculture Organization of the United Nations.
Kausar, M.A. and A. Hamid. 1998. Susceptibility of fourteen wheat varieties to low soil copper. Pak. J.
Soil Sci., 15: 135-139.
Luo, Y. and D.L. Rimmer. 1995. Zinc–copper interaction affecting plant growth on a metal–contaminated soil.
Environ. Pollut., 88: 79-83.
Malhi, S.S., L. Cowell and H.R. Kutcher. 2005. Relative effectiveness of various sources, methods, times and rates of copper fertilizers in improving grain yield of wheat on a Cu–deficient soil. Can. J. Plant Sci., 85: 59-65.
Marschner, H. 1995. Mineral Nutrition of Higher Plants. Academic Press: London.
Muhammad, S., T. Müller and R.G. Joergensen. 2008. Relationships between soil biological and other soil properties in saline and alkaline arable soils from the Pakistani Punjab. J. Arid Environ., 72: 448-457. Naidu, R. and P. Rengasamy. 1993. Ion interactions and
constraints to plant nutrition in Australian sodic soils.
Aust. J. Soil Res., 31: 801-819.
Page, A.L., A.C. Chang and D.C. Adriano. 1990. Deficiencies and toxicities of trace elements. In:
Agricultural Salinity Assessment and Management.
(Ed.): K.K. Tanji. Manuals and Reports on Engineering Practices No. 71. American Society of Civil Engineers: New York, pp. 138-160.
Pendias, A.K. and H. Pendias. 1992. Trace elements in
soil and plants (2nd edition). CRC Press, Boca Raton,
Florida, pp. 226.
Qadir, M. and S. Schubert. 2002. Degradation processes and nutrient constraints in sodic soils. Land Degrad.
Develop., 13: 275-294.
Qadir, M., R.H. Qureshi and N. Ahmad. 2002. Amelioration of calcareous saline-sodic soils through phytoremediation and chemical strategies. Soil Use
Manag., 18: 381-385.
Sanders, J.R., S.P. McGrath and T.M. Adam. 1987. Zinc, copper and nickel concentration in soil extract and crops grown on four soils treated with metal-loaded sewage sludge, Environ. Pollut., 44: 193-210. Sauvé, S., W. Hendershot and H. Allen. 2000.
Solid-solution partitioning of metals in contaminated soils: dependence on pH, total metal burden and organic matter. Environ. Sci., 34: 1125-1131.
Savithri, P., R. Perumal and R. Nagarajan. 1999. Soil and crop management technologies for enhancing rice production under micronutrient constraints. Nutr.
Cycl. Agroecosys., 53: 83-92.
Soltanpour, P.N. 1985. Use of ammonium bicarbonate– DTPA soil test to evaluate elemental availability and toxicity. Commun. Soil Sci. Plant Anal., 16: 323-338. Steel, R.G.D. and J.H. Torrie. 1980. Principles and
procedures of statistics. McGraw Hill Book Co., Inc.
New York, USA.
Tani, F.H. and S. Barrington. 2005. Zinc and copper uptake by plants under two transpiration rates. Part II. Buckwheat (Fagopyrum esculentum L.). Environ.
Pollut., 138: 548-558.
US Salinity Lab. Staff. 1954. Diagnosis and improvement
of saline and alkali soils. USDA Handb. 60,
Washington, DC, USA.
Zheng, Y., Z. Wang, X. Sun, A. Jia, G. Jiang and Z. Li. 2008. Higher salinity tolerance cultivars of winter wheat relieved senescence at reproductive stage.