HAL Id: hal-02115952
https://hal.archives-ouvertes.fr/hal-02115952
Submitted on 27 May 2020
HAL is a multi-disciplinary open access
archive for the deposit and dissemination of
sci-entific research documents, whether they are
pub-lished or not. The documents may come from
teaching and research institutions in France or
abroad, or from public or private research centers.
L’archive ouverte pluridisciplinaire HAL, est
destinée au dépôt et à la diffusion de documents
scientifiques de niveau recherche, publiés ou non,
émanant des établissements d’enseignement et de
recherche français ou étrangers, des laboratoires
publics ou privés.
Modeling of inter- and transgranular stress corrosion
crack propagation in polycrystalline material by using
phase field method
Thanh-Tung Nguyen, Julien Réthoré, Marie-Christine Baietto, Jose Bolivar,
Marion Fregonese, Stéphane P.A. Bordas
To cite this version:
Thanh-Tung Nguyen, Julien Réthoré, Marie-Christine Baietto, Jose Bolivar, Marion Fregonese, et al..
Modeling of inter- and transgranular stress corrosion crack propagation in polycrystalline material by
using phase field method. Journal of the mechanical behavior of biomedical materials, Elsevier, 2018,
�10.1515/jmbm-2017-0024�. �hal-02115952�
Thanh-Tung Nguyen, Julien Réthoré , Marie-Christine Baietto, José
Bolivar, Marion Fregonese, and Stéphane P. A. Bordas
Modelling of inter- and transgranular
stress corrosion crack propagation in
polycrystalline material by using phase
field method
Abstract: A coupled multiphysics phase field framework is proposed to model
anodic dissolution induced by stress corrosion fracture growth at microstructual level. The effects of electrochemical-mechanical processes (including crystal anisotropy) are all taken into account. This new model is based upon: (i) an anisotropic phase transformation model based on a variational formulation to describe material dissolution along preferential directions; (ii) an efficient description of grain boundaries as a smeared cohesive zone; (iii) an explicit approximation to model the different electrochemical behaviors between grain boundary and grain interior. Both intergranular and transgranular stress corrosion cracking is simulated in an efficient manner. The abilities of the proposed model are illustrated through several numerical examples involving a full prediction of complex crack network growth induced by stress corrosion cracking within 2D polycrystaline models.
Keywords: Stress corrosion cracking, anodic dissolution, crack propagation,
polycrystals, phase field, cohesive zone model
Communicated by: J. Réthoré
Thanh-Tung Nguyen, Stéphane P. A. Bordas, Institute of Computational Engineering,
University of Luxembourg, 6 Avenue de la Fonte, 4362 Esch-sur-Alzette, Luxembourg
Marie-Christine Baietto, Université de Lyon, CNRS, INSA-Lyon, LaMCoS UMR5259,
France
José Bolivar, Marion Fregonese, Université de Lyon, CNRS, INSA-Lyon, Université Lyon 1,
MateIS UMR5510, France
Julien Réthoré , Université de Nantes, Ecole Centrale de Nantes, GEM, CNRS UMR 6183
1 Introduction
Stress corrosion cracking (SCC) is a very common cause of failures for the engineering components and structures. At the microstructural scale, cracks often nucleate from corrosion pits and, depending on the kind of material and environment, it could be inter- or transgranular (IG-TG) in nature [1]. Especially, crystals orientation, grain boundary properties and mechanical loading strongly affect the switching between the inter- and transgranular stress corrosion cracking (IGSCC-TGSCC) [2, 3]. This competition provides a significant difference in the material resistance [4, 5, 6]. Therefore, understanding these aspects plays an important role for improvements in the development and application of advanced structural materials.
Many works in the literature have been proposed to deal with the simulation of microstructural effects on the stress corrosion assisted fracture growth in polycrystals. Cohesive Zone Models (CZM), based on the original idea in the work of Dugdale [7] and Barenblatt et al [8] to avoid the singularity of stress at the crack tip, is a popular technique used in this field. One of its application can be found in the study [9], where a grain-scale finite element (FE) model based on the CZM is proposed to study IGSCC in stainless steel wire. In the work [10], a 3D grain-level cohesive finite element model is proposed to study the IGSCC characteristics of AZ31 magnesium alloy due to the hydrogen embrittlement process. Another contribution based on cohesive zone domains can be found in [11] by using multiscale model to simulate the intergranular hydrogen-assisted cracking. The investigation of the microstructural effects (especially the grain boundaries) on the behaviour of the IG stress corrosion assisted short cracks can be found in [12] for the alloy 600 by using the body force method, and [13] in the fully sensitised austenitic stainless steel by using the polycrystalline aggregate model, or in [14] by using a new model based on Markov Chain theory and Monte Carlo simulations. The polycrystalline model is also used in [15, 16] to simulate the IGSCC in stainless steel. Another technique, namely dislocation-based boundary element model is proposed in [17] to microstructurally study intergranular stress corrosion short cracks in an elastoplastic medium.
Development of the numerical models at the grain size scales has so far been mostly limited to simulate IGSCC. There is a very few studies dealing with both IGSCC and TGSCC such as the work of Musienko et al [6]. The authors proposed a coupled approach (environment and plasticity) based on the CZM to model the IG-TG fracture transition. More recently, a numerical multiphysics peridy-namic framework [18] based on the adsorption induced decohesion mechanism is proposed to this field. However, a detailed description of the electrochemical and
mechanical effects on stress corrosion assisted damage is still missing, especially for the common situation of anodic dissolution induced SCC.
In this work, the phase field method augmented by a smeared description of interfaces is used to develop a fully coupled multiphysics model of stress corrosion assisted damage growth [19, 20, 21]. Starting from the ideas in [22, 23], we extend them to the case of polycrystalline materials, where the anisotropic effects for both elastic energy and fracture surface energy are taken into account. The behavior of grain boundaries is described by the smeared cohesive model following the work [24, 25]. Moreover, to account for the different behavior of grain boundary and grain interior, we propose an interpolation formulation to present the smoothed transition of the electrochemical-mechanical properties between the two regions. It is expected that the new model can model both IGSCC and TGSCC depending on the electrochemical-mechanical loading.
The overview of the paper is as follows. In section 2 the fundamentals of the proposed model are presented. In section 3, an extented formulation of phase field method able to model the stress corrosion induced crack propagation accounted the crystal effects is proposed. The variational principle for the proposed model is then detailed in section 4. Finally, the potential of the proposed model is illustrated by several numerical examples in section 5.
2 Fundamentals of the proposed method
Let Ω ⊂ R𝐷be an open domain describing a corroding system at micro scale, which generally contains four domains: (i) metal or solid phase described by temporally and spatially constant metal atom concentration 𝑐alloys ; (ii) electrolyte
solution or liquid phase described by temporally and spatially constant electrolyte atom concentration 𝑐alloyl ; (iii) an interfacial region where the corrosion occurs with the atom concentration taken within the range (𝑐alloyl , 𝑐alloys ); (iv) and the
grain boundaries region described by metal atom concentration 𝑐alloys as well,
but with another behavior.
The normalization procedure is then adopted following the work [22]. We define 𝑐𝑠as the normalized solid concentration and 𝑐𝑙as the normalized electrolyte
concentration, reading: 𝑐𝑠= 𝑐alloy𝑠 𝑐alloys and 𝑐𝑙= 𝑐solution 𝑙 𝑐alloys . (1)
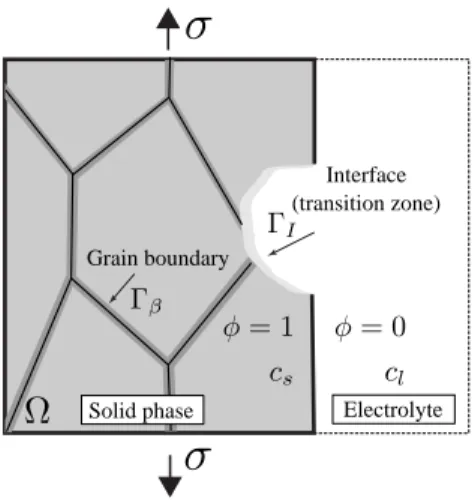
The corrosion process is modeled by using the phase field method. A scalar parameter 𝜑(x) is considered to describe the corroding system. 𝜑(x) = 1 is
solid phase, 𝜑(x) = 0 is liquid phase and the interfacial region is within the range 0 < 𝜑(x) < 1. Moreover, the grain boundaries are also approximated by a smeared representation defined by a temporally constant 𝛽(x), taking a unit value on grain boundaries and vanishing away from it1. An illustration of a
two-dimensional corroding system is depicted in Fig. 1
Interface (transition zone) Grain boundary
Solid phase Electrolyte
Fig. 1: 2D representation of a typical corroding system due to the anodic dissolution of a
polycrystalline body
The dissolution of material (phase transformation: solid 𝜑 = 1 to liquid 𝜑 = 0) is provided by the diffusional transport of metal ions from solid domain to liquid domain at interfacial domain. Note that, the interfacial region (transition domain) is represented here as a mixture of both phases (solid - liquid) with different chemical compositions by using the assumption of (Kim Kim Suzuki) KKS model [26]. Then, by introducing the interpolation function, satisfying ℎ(𝜑 = 0) = 0,
1 The smeared grain boundaries are here described by introducing a grain boundaries
density function 𝛾𝛽(𝛽, ∇𝛽) =
1 2ℓ𝛽
𝛽(x)2+ℓ𝛽
2∇𝛽(x) · ∇𝛽(x), where ℓ𝛽is the regularization parameter. Then the total grain boundaries length represents by Γ𝛽(𝛽) =
∫︀
Ω𝛾𝛽(𝛽, ∇𝛽) dΩ.
Note that for ℓ𝛽→ 0, this description leads to the exact description of the sharp cohesive
ℎ(𝜑 = 1) = 1 and 𝜕ℎ(𝜑)𝜕𝜑 |𝜑=0, 𝜑=1= 0; one choice: ℎ(𝜑) = −2𝜑3+ 3𝜑2, the ions
concentration at any material point 𝑐 can be described by the following:
𝑐 = ℎ(𝜑)𝑐𝑠+[︀1 − ℎ(𝜑)]︀𝑐𝑙, (2)
As mentioned in the work [23], the phase transformation occurs when the ions concentration achieves the saturation value, denoted 𝑐𝑠𝑒 and 𝑐𝑙𝑒for solid
metal and electrolyte respectively, in the normalized framework.
3 Phase field model
This work focuses on the study of polycrystalline effects to the anodic dissolution induced stress corrosion crack growth. To this aim, we extend the formulation pro-posed in [23] to the case of polycristalline materials. The new energy formulation is rewritten as follows: 𝐸 (u, [[u]] , 𝜑, 𝑐) = ∫︁ Ω∖Γ𝐵,Γ𝜑 𝜓𝑢(𝜀(u)) dΩ + ∫︁ Γ𝐵 𝜓𝑣([[u]] , 𝜅) dΓ + ∫︁ Γ𝜑 𝜓𝜑 dΓ + ∫︁ Ω 𝜓𝑐(𝑐, 𝜑) dΩ, (3)
where 𝜓𝑢(︀𝜀(u))︀ is the strain energy density, 𝜓𝑐(𝑐, 𝜑) is the electrochemical energy
density and 𝜓𝜑 describes the fracture energy. The term 𝜓𝑣([[u]] , 𝜅) is added to
account for the energy of grain boundaries, which is a function depending on the displacement jump across grain boundaries Γ𝐵 and an history parameter 𝜅.
In the phase field framework, the regularized description for strong disconti-nuities related to both fracture and grain boundaries is adopted (substituting [[u]] by v(x)). A sharp grain boundary is regularized by a smeared grain bound-ary (substituting Γ𝐵 by Γ𝛽 =∫︀Ω𝛾𝛽(𝛽, ∇𝛽) dΩ). Then its decohesion will be
described by the smeared cohesive law proposed in [25]. This approach is based on a smeared displacement jump approximation (see [27, 24]), in which the grain boundary decohesion is approximated as a smooth transition v(x). That provides a decomposition of infinitesimal strain tensor into a part related to the bulk and a part induced by smoothed jumps, denoted by 𝜀𝑒and ˜𝜀, respectively.
with ˜
𝜀 = nΓ𝛽⊗𝑠v𝛾
𝛽, (5)
where nΓ𝛽 is the normal vector to Γ 𝛽.
The strain energy density of damageable material 𝜓𝑢(𝜀𝑒(u), 𝜑) is then
con-structed from elastic part 𝜀𝑒by using unilateral contact assumptions introduced in [24]: 𝜓𝑢(︀𝜀𝑒(u), 𝜑)︀ = 1 2[︀𝜀 𝑒 : C(𝜑) : 𝜀𝑒]︀, (6) with the elastic tensor C(𝜑) is defined by the following:
C(𝜑) = ℎ(𝜑)C0+ 𝑘01 ⊗ 1[︀1 − ℎ(𝜑)]︀sign−(tr 𝜀𝑒), (7)
where C0 denotes the initial elastic tensor of the material, possibly anisotropic;
𝑘0is the bulk modulus; the sign function sign−(𝑥) = 1 if 𝑥 < 0 and sign−(𝑥) = 0
if 𝑥 ≥ 0.
The energy formulation in the phase field framework is now defined by:
𝐸 (u, v, 𝜑, 𝑐) = ∫︁ Ω 𝜓𝑢(𝜀𝑒(u), 𝜑) dΩ + ∫︁ Ω 𝜓𝑣(v, 𝑘) 𝛾𝛽dΩ + ∫︁ Ω 𝜓𝜑(𝜑, ∇𝜑) dΩ + ∫︁ Ω 𝜓𝑐(𝑐, 𝜑) dΩ. (8)
The third term in Eq. (8), 𝜓𝜑(𝜑, ∇𝜑) describes the surface energy or the amount
of energy released upon the creation of new fracture surfaces. It is chosen following the work [23]:
𝜓𝜑(𝜑, ∇𝜑) = 𝜔𝜑𝜑2(1 − 𝜑2) + 𝛼𝜑: (∇𝜑 ⊗ ∇𝜑), (9)
with 𝜔𝜑is the height of the imposed double-well energy barrier, 𝛼𝜑is the
second-order tensor describing gradient energy (included the anisotropic effects), which is an invariant with respect to rotations:
𝛼𝜑= 𝛼0
[︁
1 + 𝜉(1 − N ⊗ N)]︁, (10)
where 𝛼0 is the classical gradient energy coefficient for the case of isotropic
material; N denotes the unit vector normal to the preferential cleavage plane (with respect to the material coordinates), and 𝜉 ≫ 0 is used to penalize the
damage on planes not normal to N. This formulation can be extended for the case of many preferential cleavage planes. The detailed description can be found in the work [28].
Note that 𝜔𝜑and 𝛼0can be determined from the relation with the transition
length ℓ and the interface energy 𝜎𝜑or the critical fracture energy 𝑔𝑐:
𝜎𝜑= √ 𝛼0𝜔𝜑 3√2 and ℓ = 𝛼 *√︂ 2𝛼0 𝜔𝜑 , or 𝜔𝜑= 𝑔𝑐 2ℓ 𝛼0= 𝑔𝑐ℓ 2 , (11) where 𝛼* ≈ 2.94 corresponds to the transition zone taken within the range 0.05 < 𝜑 < 0.95.
The electrochemical energy density 𝜓𝑐(𝑐𝑠, 𝑐𝑙, 𝜑) in Eq. 8 is chosen based on
the KKS model [26], wherein the transition region is postulated as a mixture of the two phases with different chemical compositions, but equal chemical potentials: 𝜓𝑐(𝑐𝑠, 𝑐𝑙, 𝜑) = ℎ(𝜑) [︁ 𝐴 (𝑐𝑠− 𝑐𝑠𝑒)2 ]︁ +[︁1 − ℎ(𝜑)]︁[︁𝐴 (𝑐𝑙− 𝑐𝑙𝑒)2 ]︁ , (12)
where 𝐴 is the free energy density curvature which is often identified from ther-modynamical databases [29, 30]; 𝑐𝑠𝑒 and 𝑐𝑙𝑒are the equilibrium concentrations
of the coexisting phases; the concentration of solid 𝑐𝑠and liquid 𝑐𝑙phases can
be expressed from the equilibrium condition at the transition zone as follows: {︂
𝑐𝑠= 𝑐 +[︀ℎ(𝜑) − 1]︀(︀𝑐𝑙𝑒− 𝑐𝑠𝑒)︀
𝑐𝑙= 𝑐 + ℎ(𝜑)(︀𝑐𝑙𝑒− 𝑐𝑠𝑒)︀.
(13)
The total energy is then rewritten as 𝐸 (u, v, 𝜑, 𝑐) = ∫︁
Ω
𝜓 dΩ in which
𝜓 = 𝜓𝑢+ 𝜓𝑣+ 𝜓𝜑+ 𝜓𝑐 (14)
is identified total energy density.
4 Variational principle
4.1 Variational principle for mechanical problem
The weak form of mechanical problem is obtained by taking an arbitrary variation in the displacement field 𝛿𝑢 and in the auxiliary displacement jump field 𝛿𝑣,
while the phase field is kept constant. In the absence of body forces, it is defined as: ∫︁ Ω (︂ 𝜎 : 𝛿𝜀𝑒+ 𝛾𝛽t(v, 𝜅)𝛿𝑣 + 𝜁 𝜕v 𝜕𝑥𝑛 𝜕𝛿𝑣 𝜕𝑥𝑛 )︂ dΩ − ∫︁ 𝜕Ω𝑡 t · 𝛿𝑢 d𝑆 = 0 (15)
where t(v, 𝜅) are the tractions at grain boundaries with outward normal nΓ𝛽;
t, u are the prescribed tractions and the prescribed displacements on 𝜕Ω𝑡, 𝜕Ω𝑢,
respectively; 𝑥𝑛 = (x − xΓ𝛽) · n
Γ𝛽 and x
Γ𝛽 = argmin
y∈Γ
(‖ y − x ‖), the positive constant 𝜁 is introduced to ensure that the auxiliary displacement jump field is constant in the normal direction [27]. 𝜎 is the Cauchy stress in the bulk material, defined by: 𝜎(u, v, 𝜑) =𝜕𝜓 𝑒 𝑢 𝜕𝜀𝑒 = C(𝜑) : 𝜀 𝑒 (16) where the expression of the elastic strain 𝜀𝑒is given by (see [25]):
𝜀𝑒= ∇𝑠u − nΓ𝛽⊗𝑠v𝛾 𝛽, (17) with (∇𝑠u) 𝑖𝑗= 1 2(𝑢𝑖,𝑗+ 𝑢𝑗,𝑖) and(︀n Γ𝛽⊗𝑠v)︀ 𝑖𝑗 = 1 2(𝑛𝑖𝑣𝑗+ 𝑣𝑖𝑛𝑗). From Eqs. 15,
17, the weak form can be rewritten as: ∫︁ Ω (︂ (−∇ · 𝜎) 𝛿𝑢 −[︁𝛾𝛽(︀𝜎nΓ𝛽− t(v, 𝜅))︀ + 𝜁 𝜕2v 𝜕𝑥2 𝑛 ]︁ 𝛿𝑣 )︂ dΩ − ∫︁ 𝜕Ω𝑡 (︁ t − 𝜎n𝑡 )︁ 𝛿𝑢 d𝑆 − ∫︁ 𝜕Γ𝛽 𝜕v 𝜕𝑥𝑛 𝛿𝑣d𝑆𝛽= 0 (18)
In the case the crack curvature is assumed to be small, by considering a variation in the displacement and displacement jump, yields the BVP:
⎧ ⎪ ⎪ ⎪ ⎪ ⎪ ⎪ ⎪ ⎪ ⎨ ⎪ ⎪ ⎪ ⎪ ⎪ ⎪ ⎪ ⎪ ⎩ ∇ · 𝜎(u, v, 𝜑) = 0 ∀x ∈ Ω, 𝛾𝛽[︀t(v, 𝜅) − nΓ𝛽· 𝜎(u, v, 𝜑)]︀ = 𝜁 𝜕2v 𝜕(𝑥𝑛)2 ∀x ∈ Γ𝛽, 𝜕v 𝜕𝑥𝑛 = 0 ∀x ∈ 𝜕Γ𝛽, u = u ∀x ∈ 𝜕Ω𝑢, n𝑡· 𝜎 = t ∀x ∈ 𝜕Ω𝑡, (19)
The corresponding mechanical problem will be solved: ⎧ ⎪ ⎪ ⎪ ⎪ ⎪ ⎪ ⎪ ⎨ ⎪ ⎪ ⎪ ⎪ ⎪ ⎪ ⎪ ⎩ ∫︁ Ω 𝜎 : 𝜀𝑒(𝛿𝑢)dΩ − ∫︁ 𝜕Ω𝑡 t · 𝛿𝑢d𝑆 = 0 ∫︁ Ω {︃ 𝛾𝛽 [︁ t(v, 𝜅)𝛿𝑣 − 𝜎 : ˜𝜀 (𝛿𝑣)]︁− 𝜁 𝜕v 𝜕𝑥𝑛 𝜕𝛿𝑣 𝜕𝑥𝑛 }︃ dΩ − ∫︁ 𝜕Γ𝛽 𝜕v 𝜕𝑥𝑛 𝛿𝑣d𝑆𝛽= 0 (20)
4.2 Variational principle for electrochemical problem
The Cahn-Hilliard and Allen-Cahn equation is used to described the electro-chemical processes of phase transformation. The diffusion of ions from solid volume to electrolyte, or the spatial evolution of conserved field 𝑐 is governed by a conservation law (Cahn-Hilliard). The material dissolution or the evolution of non conserved field 𝜑 is governed by Allen-Cahn equation:
⎧ ⎪ ⎪ ⎪ ⎪ ⎪ ⎪ ⎨ ⎪ ⎪ ⎪ ⎪ ⎪ ⎪ ⎩ 𝜕𝑐 𝜕𝑡(x, 𝑡) = ∇ · 𝑀 (︃ ∇𝜕𝜓 𝜕𝑐 )︃ , 𝜕𝜑 𝜕𝑡(x, 𝑡) = −𝐿𝜑 (︃ 𝜕𝜓 𝜕𝜑− ∇ · 𝜕𝜓 𝜕∇𝜑 )︃ , (21)
where 𝐿𝜑 is the interface kinetics parameter, that describes the transformation
rate; 𝑀 is the diffusion mobility, which can be evaluated based on an analogy between the Cahn–Hilliard equation and the Fick’s second law (see [23, 22], for more details), being written as:
𝑀 = 𝐷
2𝐴, (22)
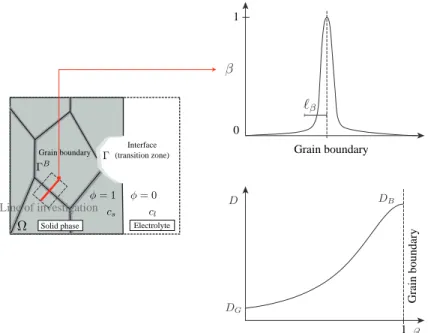
with 𝐷 is the diffusion coefficient. An important property of polycrystalline materials needs to be considered is the different SCC phenomena between grain boundary and grain interior. The grain boundary atoms are more easily and rapidly dissolved, or corroded, than the atoms within the grains. So that, the grain boundaries oxidize or corrode more rapidly. To model this phenomenon, the diffusion coefficient 𝐷 is here defined as a function of the smeared description of grain boundary 𝛽 by the following:
𝐷 = 𝐷𝐺
(1 − 𝛽)𝑛(1 − 𝑘 𝐷) + 𝑘𝐷
where 𝐷𝐺 is the diffusion coefficient for grain interior; 𝑛 is an exponent; 𝑘𝐷 is
the diffusion mismatch ratio between grain interior and grain boundary. This definition ensures 𝐷 = 𝐷𝐺in the grain interior, 𝐷 = 𝐷𝐵= 𝐷𝐺/𝑘𝐷in the center
of grain boundary and 𝐷𝐺 < 𝐷 < 𝐷𝐵 in the smeared region. An illustration
of the variation of the diffusion coefficient crossing the grain boundary for the case of 𝑛 = 2 and 𝑘𝐷 = 0.1 is depicted in Fig. 2. This approximation can be
understood as an interpolation procedure for two different regions. By using the same principle, the fracture energy for whole domain 𝑔𝑐 can be written:
𝑔𝑐= [︁ (1 − 𝛽)𝑛(1 − 𝑘𝑔) + 𝑘𝑔 ]︁ 𝑔𝑐𝐺 (24) where 𝑔𝐺
𝑐 is the fracture energy in the grain interior, 𝑘𝑔 is fracture energy
mismatch between the grain boundary 𝑔𝑐𝐵 and the grain interior 𝑔𝑐𝐺, defined by
𝑘𝑔= 𝑔𝑐𝐵/𝑔𝑐𝐺.
Interface (transition zone) Grain boundary
Solid phase Electrolyte
Line of investigation Grain boundary 1 0 1 Grain boundary
Fig. 2: Explicit description of the different electrochemical behavior between grain boundary
Using the variation in the concentration for Eq. (21)1, and the variation in
the phase field for Eq. (21)2, the corresponding weak form was obtained:
⎧ ⎪ ⎪ ⎪ ⎪ ⎪ ⎪ ⎨ ⎪ ⎪ ⎪ ⎪ ⎪ ⎪ ⎩ ∫︁ Ω 𝜕𝑐 𝜕𝑡𝛿𝑐 dΩ + ∫︁ Ω 𝑀 ∇𝜕𝜓𝑐 𝜕𝑐 · ∇𝛿𝑐 dΩ = 0 ∫︁ Ω 𝜕𝜑 𝜕𝑡𝛿𝜑 dΩ + ∫︁ Ω 𝐿𝜑𝛿𝜑𝜓 dΩ = 0 (25) where 𝛿𝜑𝜓 reads 𝛿𝜑𝜓 = (︃ 𝜕𝜓 𝜕𝜑 − ∇ · 𝜕𝜓 𝜕∇𝜑 )︃ 𝛿𝜑 =[︂ 𝜕𝜓𝑐 𝜕𝜑+[︀𝜀 𝑒 :𝜕C(𝜑) 𝜕𝜑 : 𝜀 𝑒]︀+𝜔 𝜑𝑔′(𝜑) ]︂ 𝛿𝜑+∇𝜑 [︂ 𝛼0 (︁ 1+𝜉 (1 − N ⊗ N))︁ ]︂ ∇𝛿𝜑.(26)
In order to handle loading and unloading histories, we introduce the history function following the work of [31, 32]
ℋ(x, 𝑡) = 𝑚𝑎𝑥 𝜏 ∈[0,𝑡] {︂ 𝜀𝑒(x, 𝜏 ) :[︀ C0(x)−𝑘0(x) 1⊗1 sign−(tr 𝜀𝑒(x, 𝜏 ))]︀ : 𝜀𝑒(x, 𝜏 ) }︂ (27)
From (26), (27), the final weak form for electrochemical processes is obtained by the following equation:
⎧ ⎪ ⎪ ⎪ ⎪ ⎪ ⎪ ⎪ ⎪ ⎪ ⎪ ⎪ ⎨ ⎪ ⎪ ⎪ ⎪ ⎪ ⎪ ⎪ ⎪ ⎪ ⎪ ⎪ ⎩ ∫︁ Ω 𝜕𝑐 𝜕𝑡𝛿𝑐 dΩ + ∫︁ Ω 𝑀 ∇𝜕𝜓𝑐 𝜕𝑐 · ∇𝛿𝑐 dΩ = 0 ∫︁ Ω 𝜕𝜑 𝜕𝑡𝛿𝜑 dΩ + ∫︁ Ω 𝐿𝜑 [︂ 𝜕𝜓𝑐 𝜕𝜑 + ℎ ′(𝜑)ℋ(x, 𝑡) + 𝜔 𝜑𝑔′(𝜑) ]︂ 𝛿𝜑 dΩ + ∫︁ Ω 𝐿𝜑∇𝜑 [︂ 𝛼0 (︁ 1 + 𝜉 (1 − N ⊗ N))︁ ]︂ ∇𝛿𝜑 dΩ = 0 (28)
5 Representative numerical examples
In this section, we present several numerical examples using the proposed method to study SCC of a zirconium alloy. Thanks to a tightly adherent and protective oxide film, zirconium is well known for its excellent corrosion resistance to a lot of acids (hydrochloric acid, hot organic acids, sulfuric acid,...) even when exceeding the normal boiling point temperature. Moreover, this material exhibits very good mechanical properties. However, zirconium can be corroded in the situation of hydrochloric acid containing oxidizing species such as cupric chloride, ferric chloride, or wet chlorine. Both Intergranular and Transgranular Stress Corrosion Cracking (IGSCC - TGSCC) were experimentally observed in the literature [33], [6].
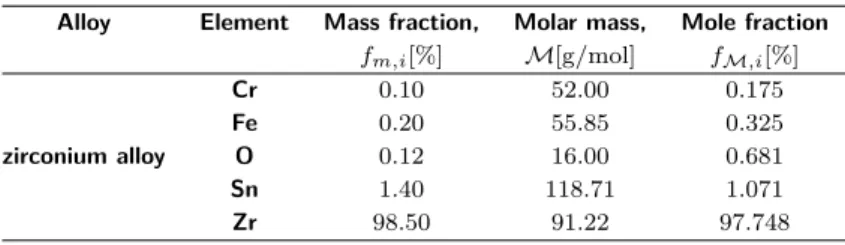
In this study, anodic dissolution induced stress corrosion crack propagation of this material is investigated. The considered zirconium alloy is composed mostly of zirconium, tin, iron and chromium with a typical mass density of 𝜌alloy =
6.56 g/cm3. The complete chemical composition is given in Table. 1. The metal concentration is finally obtained 𝑐alloys = 72.23 mol/𝑙 (see the work [23] for more
details).
Table 1: Chemical composition of the considered zirconium alloy (Zircaloy-4)
Alloy Element Mass fraction, Molar mass, Mole fraction
𝑓𝑚,𝑖[%] ℳ[g/mol] 𝑓ℳ,𝑖[%] Cr 0.10 52.00 0.175 Fe 0.20 55.85 0.325 zirconium alloy O 0.12 16.00 0.681 Sn 1.40 118.71 1.071 Zr 98.50 91.22 97.748
The diffusion coefficient is assumed to be homogeneous for all chemical compositions, and taken as the value for pure Zr, with 𝐷𝐺 = 1.3 × 10⁻⁸m2/𝑠
[34, 35]. The saturated concentration is taken as in the study [36]: 𝑐𝑠𝑎𝑡 = 3
mol/𝐿. Hence, the saturated concentration of solid and liquid phase are 𝑐𝑠𝑒= 1,
𝑐𝑙𝑒= 3/72.23. The free energy density curvature 𝐴 is identified by fitting the
chemical free energies obtained from thermodynamic databases. That gives
chosen ℓ = 0.5 𝜇m and 𝜎𝜑 = 0.5 kN/m (giving the equivalent fracture energy
𝑔𝐺
𝑐 = 10−3 kN/mm). The interface kinetics energy is 𝐿𝜑= 0.15 𝑙/(J.s).
The grain boundary cohesive energy is taken following the work of Xu et al [37]: Ψ𝐵(︀ [[𝑢]] )︀ = 𝑔𝐵𝑐 [︃ 1 − (︂ 1 +[[𝑢]] 𝑣𝑛 )︂ exp (︂ −[[𝑢]] 𝑣𝑛 )︂]︃ . (29)
The normal traction separation law is obtained as:
𝑡(︀ [[𝑢]] )︀ = 𝑔𝑐𝐵 [[𝑢]] 𝑣2 𝑛 exp (︂ −[[𝑢]] 𝑣𝑛 )︂ , (30)
with 𝑣𝑛= 𝑔𝐵𝑐 /(𝑡𝑢exp(1)), and 𝑡𝑢the fracture strength, which can be dependent
on the angular mismatch between grains (see eg. [38]) as follows:
𝑡𝑢(Δ𝜃𝑖) = 𝑡avg𝑢 + 1 3Δ𝑡𝑢 ∑︁ 𝑖 cos(4Δ𝜃𝑖), (31)
where 𝑡avg𝑢 , Δ𝑡𝑢 are the average and the maximal fracture strength deviation,
respectively; the angular mismatch Δ𝜃 is defined as the difference between the orientations of two crystals 𝜃𝑖1, 𝜃2𝑖, along the considered grain boundary on plane
𝑖:
Δ𝜃 = 𝜃𝑖1− 𝜃𝑖2. (32)
However, for the sake of simplicity and due to the lack of experimental data, the grain boundary fracture strength is considered here as independent for misorientation between two grains and taken as 𝑡𝑢= 0.1 GPa. The fracture
energy within the grain boundary is 𝑔𝐵𝑐 = 2.85 × 10⁻⁴ kN/mm. The elastic
tensor of hcp symmetry is used. For 0∘ orientation, it is written as follows [39]:
C0= ⎡ ⎣ 142 73.4 0 73.4 142 0 0 0 34.3 ⎤ ⎦ (GPa). (33)
The bulk modulus is defined as 𝑘0= (𝐶110 + 2𝐶120 )/3 = 96.26 GPa. For easier
numerical implementation, all parameters are normalized following the work by [29, 30].
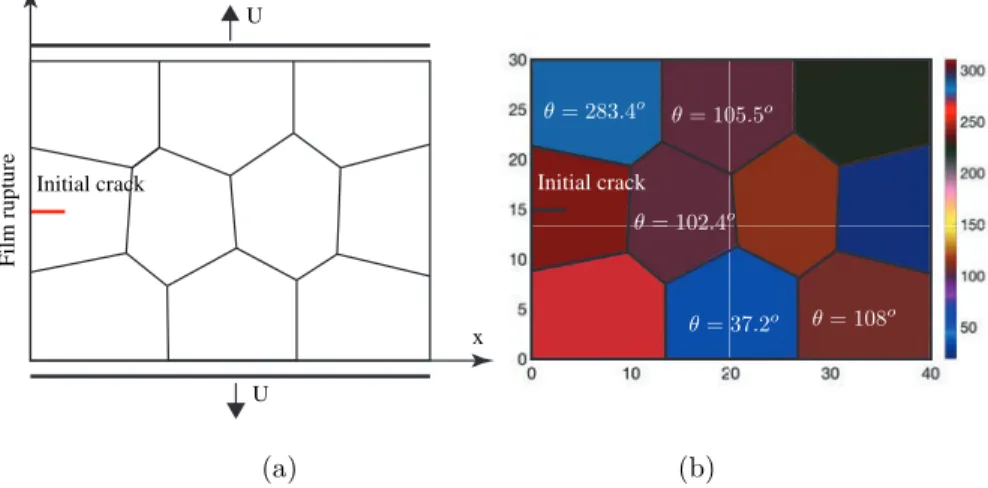
We first consider a rectangular domain with dimension 40×30 𝜇m2containing an initial crack and 10 grains. The geometry and mesh of this microstructure is
generated using the open source software Neper [40] (developed by Romain Quey at CNRS and MINES Saint-Etienne, France). A refined mesh was constructed using triangular elements, with element size ∼ 0.15 𝜇m, to have 6-8 elements in the transition zone. The average grain size is about
√︂ 40 × 30
10 ≈ 11 𝜇m. The details of the geometry and of boundary conditions are described in Fig. 3. In each grain, both direction of anisotropy and preferential damage directions are generated randomly. Initial crack Initial crack U U x y Film rupture (a) (b)
Fig. 3: Geometry and boundary conditions for the polycrystalline structure containing 10
grains: (a) grain boundary and loading description; (b) description of crystals with angle of the direction of anisotropy.
In the crystallographic orientation, the cleavage plane N = [1 0] is chosen. The structure will be numerically assigned to both electrochemical degradation and mechanical loading. The displacements are prescribed along the 𝑦−direction for upper edge (𝑦 = 30 𝜇m) and lower edge (𝑦 = 0) while the displacement along
𝑥 is here free. The rupture of passive film allowing electrochemical processes is
manually activated from the beginning at the initial crack location. Plane strain condition is assumed.
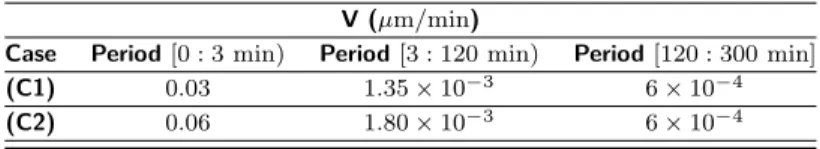
The competition between IGSCC and TGSCC is analyzed by considering two situations:
(C1) SCC with low mechanical loading. (C2) SCC with high mechanical loading.
The first case (C1) is set up to expect the IGSCC, because at low mechanical loading, SCC process, taking place preferentially at grain boundaries, prevails on mechanical process. Therefore IGSCC will be dominant in this situation. In the second case (C2), when the structure is subjected to higher mechanical loading, the mechanical process becomes dominant. So that, the cracks will propagate not only on grain boundaries but also within the grains depending on the direction which is suitable for fracture growth. The details of boundary conditions are given in table 2.
Table 2: Loading details of two situations: (C1) and (C2)
V (𝜇m/min)
Case Period [0 : 3 min) Period [3 : 120 min) Period [120 : 300 min] (C1) 0.03 1.35 × 10⁻³ 6 × 10⁻⁴
(C2) 0.06 1.80 × 10⁻³ 6 × 10⁻⁴
The resulting crack propagation for the first case (C1) is depicted in Fig. 4. The initial crack propagates towards the grain boundaries, according to the preferential direction (Fig. 4 with U = 0.21 𝜇m). The strong influence of SCC is captured in this loading condition. The fracture width near the edge 𝑥 = 0 is much larger than the region nearly crack tip, because of material dissolution induced by SCC had more time to developp in this zone. After reaching the grain boundary, the crack has a tendency to propagate along the grain boundaries (Fig. 4 with U = 0.27, 0.30 and 0.32 𝜇m). IGSCC is clearly observed.
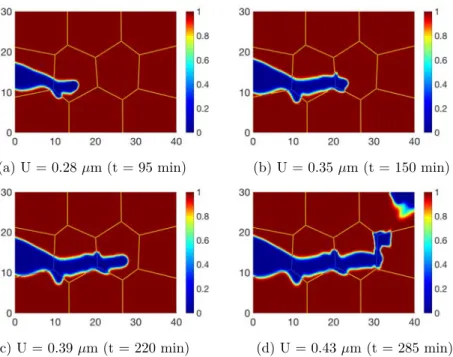
A different fracture scenario is obtained in the second case (C2) (see Fig. 5). With the higher loading rate, the mechanical process becomes predominant. The fracture morphology is shaper, but the effect of SCC is still captured at the edge
𝑥 = 0. The fracture growth in the grain boundary is always observed (see Fig. 5
with U = 0.28 𝜇m), but then the crack in this situation mostly propagates within the grains (see Fig. 5 with U = 0.35 and 0.39 𝜇m). Under the higher mechanical loading, fracture growth is essentially due to mechanical process, that supports for both IG and TG cracks (not like only IG fracture in loading condition C1). Thus cracks choose either IG or TG, depending on which one is more favorable energetically. This phenomenon has been proved in Fig. 5 for U = 0.41 𝜇m, where the orientation of the last grain is not suitable for crack propagation, the fracture has switched from TG to IG. The obtained numerical simulation results
(a) U = 0.21 𝜇m (t = 115 min) (b) U = 0.27 𝜇m (t = 205 min)
(c) U = 0.30 𝜇m (t = 255 min) (d) U = 0.32 𝜇m (t = 285 min)
Fig. 4: Crack propagation for the first situation (C1) corresponding to the low mechanical
loading. The IGSCC is clearly captured
show a very good qualitative agreement with experimental observations in the literature [41, 42, 6].
Note that the transition between IG and TG fracture is strongly affected by the interfacial properties at grain boundaries as well. By using the same mechanical loading condition as the case (C2) but taking a new grain boundary energy 𝑔𝐵
𝑐 = 8.3 × 10⁻⁴ kN/mm (denoted here the case (C3)), TG crack
propa-gation is obtained as in Fig. 6(c). The crack trajectory of this last case (C3) is quite similar to one obtained from the loading case (C2), but with lower grain boundary effects. Especially at the last loading step, the fracture switches from TG to IG for the case (C2), while it is still TG for the case (C3). This result confirms the influence of the fracture energy mismatch between grain boundaries and grain interior on the transition between IGSCC and TGSCC.
The stress-displacement curves for all situations are plotted in Fig. 7. The elastic period for the three cases exhibits the same behavior. Then, the IGSCC in the case (C1) shows the weakest resistance, while the fully TGSCC in the case (C3) presents the strongest resistance. These observations demonstrate the
(a) U = 0.28 𝜇m (t = 95 min) (b) U = 0.35 𝜇m (t = 150 min)
(c) U = 0.39 𝜇m (t = 220 min) (d) U = 0.43 𝜇m (t = 285 min)
Fig. 5: Crack propagation for the second situation (C2) corresponding to the high
mechani-cal loading. Both IGSCC and TGSCC are observed
(a) (b) (c)
Fig. 6: Comparison of crack path for different cases: (a) case study (C1) with the low
mechanical loading and 𝑔𝑐/𝑔𝐵𝑐 = 3.5; (b) case study (C2) with the high mechanical loading
and 𝑔𝑐/𝑔𝑐𝐵= 3.5; (c) case study (C3) with the high mechanical loading and 𝑔𝑐/𝑔𝐵𝑐 = 1.2
strong influence of the fracture features (IG or TG) on the macroscopic material properties, which plays an major role in the material design.
In the next example, we perform the numerical simulation on a polycrystalline structure containing 50 grains (dimension: 160 × 120 𝜇m2) is performed in order to demonstrate the efficiency of the proposed framework. The details of geometry and boundary conditions are depicted in Fig. 8. The same values of the
0 0.1 0.2 0.3 0.4 0.5 Displacement [µm] 0 100 200 300 400 S tr ess [M P a]
(C1) low mechanical loading (C2) high mechanical loading (C3) high GB fracture energy
Fig. 7: Comparison of the stress-displacement curve for both different mechanical loading
conditions
material parameters are considered as for the previous example. The boundary conditions are chosen here to capture both IGSCC and TGSCC as follows: the prescribed displacement rate V = 0.1 𝜇m/min for the period t = [0 : 5 min] and V = 0.002 𝜇m/min for t = (5 : 500 min]. Only the cleavage plane N = [1 0] is considered. Initial crack Film rupture x y U U (a) (b)
Fig. 8: Geometry and boundary conditions for the polycrystalline structure containing 50
grains: (a) grain boundary and loading description; (b) angle of the direction of anisotropy
The results of fracture evolution corresponding to different loading times are plotted in Fig. 9. Both crack in the grain interior and along the grain boundaries are observed. Note that the advantage of applying the phase field model is demontrated, the model is able to capture the nucleation of severals cracks when
the structure is subjected to predominant mechanical loading (see Fig. 9 with U = 1.40 𝜇m). These cracks often nucleate at the grain boundaries (the weakest regions) and then either propagate along grain boundaries or onset and penetrate the grain (see Fig. 9 with U = 1.42 𝜇m), so that the process requires minimal energy. Then these new cracks may merge with the initial one.
A similar behavior has been observed experimentally in the SCC crack growth in stainless steels exposed to high temperature water [43]. The process is commonly cited as Initiation Dominant Growth [44] and has been related to the nucleation of adjacent cracks in the vicinity of the primary crack tip (stress concentration zone), so the main defect become larger by coalescence with the recently nucleated cracks rather than by the direct growth of the primary crack.
(a) U = 1.10 𝜇m (t = 305 min) (b) U = 1.31 𝜇m (t = 410 min)
(c) U = 1.40 𝜇m (t = 455 min) (e) U = 1.42 𝜇m (t = 470 min)
Fig. 9: Crack propagation for polycrystalline structure containing 50 grains. The phase field
6 Conclusion
In this contribution, a new multiphysics model is proposed to describe the transition between IGSCC and TGSCC at the microstructural level. The anodic dissolution induced SCC is modeled by using the anisotropic phase filed method based on KKS model [26] for the electrochemical process and the idea in the work [23] for coupling with mechanical processes. The anisotropic effects of oriented crystals are taken into account for both elasticity and fracture energies. Moreover, the behavior of grain boundaries are described by the smeared cohesive model in the phase field framework to avoid defining of new material phases for this region. More specifically, we propose an approximation to account the different SCC phenomena between grain boundary and grain interior by using the diffusion coefficient and fracture energy of phase concentration depending on a smeared grain boundary field. The new method is able to simulate the stress corrosion crack propagation accounting for polycrystaline effects in a very efficient manner.
The applications to Zirconium alloy demonstrate a very good qualitative agreement between numerical predictions and experimental observations for both situation: IGSCC and TGSCC when SCC system is subjected to different loading conditions. The transition from IG to TG fracture due to the distribution of crystallographic and fracture energy mismatch between grain boundaries and grain interior is also captured. The proposed method opens a new efficient way to model the interaction and competition between IGSCC and TGSCC.
Acknowledgment: The authors would like to acknowledge the National French
Research Agency (ANR) for its financial support under contract MATETPRO ANR-12-RMNP-0020 (ECCOFIC project). The authors would like also to thank their partners Institut de la Corrosion, AREVA NP, Andra, MISTRAS Group and Pierre Combrade for their participation in the fruitful discussions during this work.
References
[1] R.C. Newman. 2001 WR Whitney Award Lecture: Understanding the corrosion of stainless steel. Corrosion, 57(12):1030–1041, 2001.
[2] J.S. Chen, M. Salmeron, and T.M. Devine. Intergranular vs transgranular stress corrosion cracking of Cu-30Au. Scripta metallurgica et materialia, 26(5):739–742, 1992.
stress corrosion cracking of Cu-30Au. Corrosion science, 34(12):2071–2097, 1993.
[4] V.Y. Gertsman and S.M. Bruemmer. Study of grain boundary character along intergranular stress corrosion crack paths in austenitic alloys. Acta
Materialia, 49(9):1589–1598, 2001.
[5] M.A. Arafin and J.A. Szpunar. A new understanding of intergranular stress corrosion cracking resistance of pipeline steel through grain boundary character and crystallographic texture studies. Corrosion Science, 51(1):119– 128, 2009.
[6] A. Musienko and G. Cailletaud. Simulation of inter-and transgranular crack propagation in polycrystalline aggregates due to stress corrosion cracking.
Acta materialia, 57(13):3840–3855, 2009.
[7] D.S. Dugdale. Yielding of steel sheets containing slits. Journal of the
Mechanics and Physics of Solids, 8:100–104, 1960.
[8] G.I. Barenblatt. The formation of equilibrium cracks during brittle fracture. General ideas and hypotheses. axially-symmetric cracks. Journal of Applied
Mathematics and Mechanics, 23(3):622–636, 1959.
[9] I. Simonovski and L. Cizelj. Towards modeling intergranular stress corrosion cracks on grain size scales. Nuclear Engineering and Design, 246:107–114, 2012.
[10] J. Zhang, Z.H. Chen, and C.F. Dong. Simulating intergranular stress corro-sion cracking in AZ31 using three-dimencorro-sional cohesive elements for grain structure. Journal of Materials Engineering and Performance, 24(12):4908– 4918, 2015.
[11] J.J. Rimoli and M. Ortiz. A three-dimensional multiscale model of intergran-ular hydrogen-assisted cracking. Philosophical Magazine, 90(21):2939–2963, 2010.
[12] M. Kamaya. Influence of grain boundaries on short crack growth behaviour of igscc. Fatigue & Fracture of Engineering Materials & Structures, 27(6):513– 521, 2004.
[13] A.P. Jivkov and T.J. Marrow. Rates of intergranular environment assisted cracking in three-dimensional model microstructures. Theoretical and
Ap-plied Fracture Mechanics, 48(3):187–202, 2007.
[14] M.A. Arafin and J.A. Szpunar. A novel microstructure–grain boundary char-acter based integrated modeling approach of intergranular stress corrosion crack propagation in polycrystalline materials. Computational Materials
Science, 47(4):890–900, 2010.
[15] M. Kamaya and M. Itakura. Simulation for intergranular stress corrosion cracking based on a three-dimensional polycrystalline model. Engineering
[16] M. Kamaya, K. Fukuya, and T. Kitamura. Angular distribution of slip steps by three-dimensional polycrystalline model for stainless steel. Journal of
nuclear science and technology, 46(9):901–906, 2009.
[17] A. Stoll and A.J. Wilkinson. Use of a dislocation-based boundary element model to extract crack growth rates from depth distributions of intergranular stress corrosion cracks. Acta Materialia, 60(13):5101–5108, 2012.
[18] D. De Meo, C. Diyaroglu, N. Zhu, E. Oterkus, and M.A. Siddiq. Modelling of stress-corrosion cracking by using peridynamics. International Journal of
Hydrogen Energy, 41(15):6593–6609, 2016.
[19] Q. Chen, N. Ma, K. Wu, and Y. Wang. Quantitative phase field modeling of diffusion-controlled precipitate growth and dissolution in Ti–Al–V. Scripta
Materialia, 50(4):471–476, 2004.
[20] I. Kovačević and B. Šarler. Solution of a phase-field model for dissolution of primary particles in binary aluminum alloys by an r-adaptive mesh-free method. Materials Science and Engineering: A, 413:423–428, 2005. [21] Z. Xu and P. Meakin. Phase-field modeling of solute precipitation and
dissolution. The Journal of chemical physics, 129(1):014705, 2008. [22] W. Mai, S. Soghrati, and R.G. Buchheit. A phase field model for simulating
the pitting corrosion. Corrosion Science, 110:157–166, 2016.
[23] T-T. Nguyen, J. Bolivar, Y. Shi, J. Réthoré, A. King, M. Fregonese, J. Adrien, J-Y. Buffiere, and M-C. Baietto. A phase field method for modeling anodic dissolution induced stress corrosion crack propagation. Submitted, 2017. [24] T-T. Nguyen, J. Réthoré, J. Yvonnet, and M-C. Baietto. Multi-phase-field
modeling of anisotropic crack propagation for polycrystalline materials.
Computational Mechanics, 60:289–314, 2017.
[25] T-T. Nguyen, J. Yvonnet, Q.-Z. Zhu, M. Bornert, and C. Chateau. A phase-field method for computational modeling of interfacial damage interacting with crack propagation in realistic microstructures obtained by microtomog-raphy. Computer Methods in Applied Mechanics and Engineering, 312:567 – 595, 2016.
[26] S.G. Kim, W.T. Kim, and T. Suzuki. Phase-field model for binary alloys.
Physical review e, 60(6):7186, 1999.
[27] C.V. Verhoosel and R. De Borst. A phase-field model for cohesive fracture.
International Journal for numerical methods in Engineering, 96(1):43–62,
2013.
[28] T-T. Nguyen, J. Réthoré, and M-C. Baietto. Phase field modelling of anisotropic crack propagation. European Journal of Mechanics-A/Solids, 65:279–288, 2017.
description and growth kinetics of stoichiometric precipitates in the phase-field approach. Calphad, 31(2):303–312, 2007.
[30] A.A. Abubakar, S.S. Akhtar, and A.F.M. Arif. Phase field modeling of V2O5 hot corrosion kinetics in thermal barrier coatings. Computational
Materials Science, 99:105–116, 2015.
[31] C. Miehe, M. Hofacker, and F. Welschinger. A phasefield model for rate-independent crack propagation: Robust algorithmic implementation based on operator splits. Computer Methods in Applied Mechanics and Engineering, 199:2765–2778, 2010.
[32] T-T. Nguyen, J. Yvonnet, Q-Z. Zhu, M. Bornert, and C. Chateau. A phase field method to simulate crack nucleation and propagation in strongly hetero-geneous materials from direct imaging of their microstructure. Engineering
Fracture Mechanics, 139:18–39, 2015.
[33] B. Cox. Environmentally-induced cracking of zirconium alloys—a review.
Journal of Nuclear Materials, 170(1):1–23, 1990.
[34] J. Prong, T. Jaszay, A. Caprani, and J.P. Frayret. Anodic behaviour of zirconium and its alloys in fluorinated nitric media dissolution-passivation model. Journal of applied electrochemistry, 25(11):1031–1037, 1995. [35] D.R. Baker, A. Conte, C. Freda, and L. Ottolini. The effect of halogens on
zr diffusion and zircon dissolution in hydrous metaluminous granitic melts.
Contributions to Mineralogy and Petrology, 142(6):666–678, 2002.
[36] F.J. Mompean, J. Perrone, M. Illemassène, et al. Chemical thermodynamics
of zirconium, volume 8. Gulf Professional Publishing, 2005.
[37] X-P Xu and A Needleman. Void nucleation by inclusion debonding in a crys-tal matrix. Modelling and Simulation in Materials Science and Engineering, 1(2):111, 1993.
[38] T. Luther and C. Könke. Polycrystal models for the analysis of intergran-ular crack growth in metallic materials. Engineering Fracture Mechanics, 76(15):2332–2343, 2009.
[39] E.S. Fisher and C.J. Renken. Single-crystal elastic moduli and the hcp? bcc transformation in ti, zr, and hf. Physical Review, 135(2A):A482, 1964. [40] R. Quey. Neper: software package for polycrystal generation and meshing,
2016.
[41] M. Fregonese. Mécanismes de corrosion sous contrainte par l’iode dans le Zirconium et le Zircaloy-4 transposition aux conditions d’interaction pastille-gaine dans les réacteursa l’eau pressurisée. PhD thesisEcole des Mines de
Saint-Etienne, 1997.
[42] S.B. Farina, G.S. Duffo, and J.R. Galvele. Stress corrosion cracking of zirconium and zircaloy-4 in halide aqueous solutions. Corrosion Science, 45(11):2497–2512, 2003.
[43] M. Kamaya and T. Haruna. Crack initiation model for sensitized 304 stainless steel in high temperature water. Corrosion science, 48(9):2442–2456, 2006. [44] M. Kamaya and T. Haruna. Influence of local stress on initiation behavior of
stress corrosion cracking for sensitized 304 stainless steel. Corrosion Science, 49(8):3303–3324, 2007.