HAL Id: hal-00582904
https://hal.archives-ouvertes.fr/hal-00582904
Submitted on 4 Apr 2011HAL is a multi-disciplinary open access
archive for the deposit and dissemination of sci-entific research documents, whether they are pub-lished or not. The documents may come from teaching and research institutions in France or abroad, or from public or private research centers.
L’archive ouverte pluridisciplinaire HAL, est destinée au dépôt et à la diffusion de documents scientifiques de niveau recherche, publiés ou non, émanant des établissements d’enseignement et de recherche français ou étrangers, des laboratoires publics ou privés.
A high-resolution index for vegetation extraction in
IKONOS images
Miloud Chikr El-Mezouar, Nasreddine Taleb, Kidiyo Kpalma, Joseph Ronsin
To cite this version:
Miloud Chikr El-Mezouar, Nasreddine Taleb, Kidiyo Kpalma, Joseph Ronsin. A high-resolution index for vegetation extraction in IKONOS images. Proceedings of the SPIE on Remote Sensing for Agriculture, Ecosystems, and Hydrology, Sep 2010, Toulouse, France. pp.78242A-1 - 78242A-9, �10.1117/12.866187�. �hal-00582904�
A high-resolution index for vegetation extraction in
IKONOS images
M. Chikr El-Mezouar
a,b, N. Taleb
a, K. Kpalma
b, J. Ronsin
b a RCAM Laboratory, Dept. of Electronics, Univ. of Sidi Bel-Abbes, 22000, Algeria[email protected], [email protected]
b UEB INSA IETR Groupe Image et Télédétection, CS 70839 35708 Rennes Cedex 7, France
[email protected], [email protected]
Abstract. In monitoring vegetation change and urban planning, the measure and the mapping
of the green vegetation over the Earth play an important role. The normalized difference vegetation index (NDVI) is the most popular approach to generate vegetation maps for remote sensing imagery. Unfortunately, the NDVI generates low-resolution vegetation maps. High-resolution imagery, such as IKONOS imagery, can be used to overcome this weakness leading to better classification accuracy. Hence, it is important to derive a vegetation index providing the high-resolution data. Various scientific researchers have proposed methods based on high-resolution vegetation indices. These methods use image fusion to generate high-resolution vegetation maps. IKONOS produces high-resolution panchromatic (Pan) images and low-resolution multispectral (MS) images. Generally, for the image fusion purpose, the conventional linear interpolation bicubic scheme is used to resize the low-resolution images. This scheme fails around edges and consequently produces blurred edges and annoying artefacts in interpolated images. This study presents a new index that provides high-resolution vegetation maps for IKONOS imagery. This vegetation index (HRNDVI: High Resolution NDVI) is based on a new derived formula including the high-resolution information. We use an artefact free image interpolation method to up sample the MS images so that they have the same size as that of the Pan images. The HRNDVI is then computed by using the resampled MS and the Pan images. The proposed vegetation index takes the advantage of the high spatial resolution information of Pan images to generate artefact free vegetation maps. Visual analysis demonstrates that this index is promising and performs well in vegetation extraction and visualization.
Keywords: IKONOS imagery, high-resolution, vegetation index, vegetation extraction.
1 INTRODUCTION
Previously, aerial photographs possessed a much higher resolution and therefore gave considerably more information, allowing a more detailed study of the local vegetation [1]. Nowadays, the technologies and methods of remote sensing have evolved dramatically to include a suite of sensors operating at a wide range of imaging scales with potential interest and importance to planners and land managers [2]. Very high resolution satellite remote sensing systems are now capable of providing imagery with similar spatial detail to aerial photography, but with superior spectral information [3]. Multispectral (MS) sensors have a good advantage, over colour aerial photographs, for acquiring light in the near-infrared domain. Remote sensing provides valuable information for mapping vegetation and monitoring vegetation change [1]. Vegetation indices derived from satellite images with coarse and medium spatial resolution larger than five meters satisfy the need of vegetation extraction by threshold segmentation at a large scale [4]. Vegetation can be distinguished using remote sensing data from most other materials by virtue of its notable absorption in the red and blue segments of the visible spectrum, its higher green reflectance and, especially, its very strong reflectance in the near infrared. Near infrared is the most sensitive spectral
domain used to map vegetation canopy properties and may improve the discrimination of vegetation communities. Many vegetation indices have been developed mostly based on the feature of low red and high near-infrared reflectance, including the most widely used index: NDVI (Normalized Difference Vegetation Index) [4]. High-resolution imagery from the IKONOS satellite may be useful for many resource management applications as vegetation. It is a valuable resource to achieve map accuracies comparable to manual aerial photo interpretation and can aid in the development of a wide range of mapping and spatial modeling applications [5].
In an urban environment, the presence, abundance and life form of vegetation has long been considered as an important factor influencing the environment quality, conferring diverse benefits [4]. Vegetation is generally considered a key component of the urban environment. However, urban environment is complex and very different from rural and natural environment [4]. Increasing demands on the accuracy and thematic resolution of vegetation community maps from remote sensing imagery has created a need for novel image analysis techniques [6]. These researches investigate the possibility of using MS IKONOS images to quantify urban vegetation, obtaining similar accuracy to that achieved from aerial photographs [3].
For vegetation extraction applications, the vegetation is delineated using a vegetation index, as the NDVI. However, in some cases this NDVI fails in the detection process. In recent studies vegetation indices and extraction applications are proposed. In [7], the authors presented a fixed-threshold vegetation index (VTCmap) based on the extended Tasseled Cap transformation (TCT). Then it is applied to extract vegetation from the fused images. Unlike this index, which is based on the MS images only, the authors in [8] proposed the use of the Panchromatic (Pan) images for determining their vegetation index (VI). These two methods are globally good, but in some cases, as urban environment, they fail in the vegetation extraction.
In this paper, we aim to develop a method to extract the vegetation using IKONOS imagery. This method is a good solution when an urban case is considered. Moreover, the interpolation method used to upsample the MS images was chosen in order to preserve the edges, making the vegetation extraction more accurate in the urban areas.
2 VEGETATION EXTRACTION FOR IKONOS IMAGERY
The vegetation extraction is an important application, which is used to monitor crops, in terms of their identity and stage of growth. In [7], a fixed threshold approach generating high-resolution vegetation maps for IKONOS imagery was proposed. In this technique an extended Tasseled Cap Transformation (TCT) is used to produce a vegetation map, and then a high-resolution version of this map is obtained after an Intensity-Hue-Saturation (IHS) based fusion method [9]. The vegetation index (VITC) was derived as:
3 1 2 4 1 4 1 2 1 TC TC TC VITC = − − , (1)
where the IKONOS TCT coefficients are given by:
NIR R G B TC NIR R G B TC NIR R G B TC 081 . 0 722 . 0 312 . 0 612 . 0 819 . 0 325 . 0 356 . 0 311 . 0 567 . 0 560 . 0 509 . 0 326 . 0 3 2 1 − + − − = + − − − = + + + + = . (2)
Rewriting Eqs. (1) using (2), gives G B R NIR VITC ≅0.29 −0.48 −0.08 −0.23 . (3)
The vegetation map VTCmap is produced by a threshold approach:
⎩ ⎨ ⎧ < ≥ = 0 , 0 0 , TC TC TC map VI where VI where VI VTC . (4)
The high-resolution vegetation map, which contains most details of the Pan image, is given by: ⎥ ⎥ ⎥ ⎦ ⎤ ⎢ ⎢ ⎢ ⎣ ⎡ + ′ = ⎥ ⎥ ⎥ ⎦ ⎤ ⎢ ⎢ ⎢ ⎣ ⎡ δ δ δ map C VT B Fused G Fused R Fused _ _ _ , (5)
Where VTC’map is the resized-version of the VTCmap to the Pan size and =Pan− VTCmap′
3 1
δ .
From Eq. (3), the vegetation index is based on the low-resolution MS images only. Hence,
VTC’map will be of the same resolution, producing a low-resolution vegetation map. The Pan
image used in Eq. (5) doesn’t guarantee a high resolution for the vegetation zones. Some examples will be discussed in the next section.
In a recent study [8], a vegetation index VI was proposed: it takes advantage of the high spatial resolution information of the Pan images. This VI is expressed as:
3 3 I Pan I Pan VI + − = , (6)
Where I3=(R’+G’+B’)/3 and [R’,G’,B’] is obtained from up-sampling the original RGB
image with the same spatial scale as that of the Pan image.
Using the VI, a modified Fast IHS [9] was proposed for the purpose of the vegetation extraction: ⎥ ⎥ ⎥ ⎦ ⎤ ⎢ ⎢ ⎢ ⎣ ⎡ ′ + ′ = ⎥ ⎥ ⎥ ⎦ ⎤ ⎢ ⎢ ⎢ ⎣ ⎡ Pan G Pan B Fused G Fused R Fused IHS δ _ _ _ , with
(
)
. (7) ⎩ ⎨ ⎧ > − ⋅ ≤ ′ − = ′ 0 , 0 , 3 VI I Pan k VI G Pan IHS δBecause of the vegetation extraction, only the G band is enhanced in the vegetated areas. The fused R and B bands are taken as the Pan image. The value of the parameter k was found equal to 2 for IKONOS images.
These two techniques are presented in order to evaluate the performance of our method. In the next section, the new vegetation index and its application to vegetation extraction are presented.
3 IKONOS HIGH RESOLUTION VEGETATION INDEX
The NDVI is the most used vegetation index for a variety of remote sensing applications. It was generally developed for coarse resolution imagery, but it is rarely used to generate high-resolution vegetation maps directly. On the other hand, in some applications, the IKONOS imagery can be used to map a vegetation cover or to validate a vegetation cover classified from other remote sensing images [10].In addition, the IKONOS Pan images provide more details of buildings, individual trees, and vegetation structural variations can be well detected with 1-meter spatial resolution images.However, the vegetation zones of the MS images are much darker because the vegetation appears to have relatively low reflectance in RGB bands. Therefore, when vegetation is the object of interest, an enhanced-vegetation fused result is the objective. In this case, usually a vegetation index is used in order to delineate the vegetated areas, where the enhancement is to be done.
In order to take into account the spatial resolution of the Pan images, the NDVI is calculated using fused bands. A high resolution vegetation map can be generated using the fused low resolution R and NIR bands with the Pan images. This index will be noted HRNDVI for High Resolution NDVI. Like the conventional NDVI defined as:
R NIR R NIR NDVI + − = . (8)
The new index is defined by:
R Fused NIR Fused R Fused NIR Fused HRNDVI + − = . (9)
Generally, the fused bands R and NIR contain a part from the Pan image, which spatially improves the proposed HRNDVI. In order that the fused bands provide the full details of Pan [11], they are obtained as:
(
)
(
)
⎥ ⎦ ⎤ ⎢ ⎣ ⎡ ′ + ′ + ′ + ′ − + ′ ′ + ′ + ′ + ′ − + ′ = ⎥ ⎦ ⎤ ⎢ ⎣ ⎡ 4 4 R NI B G R Pan R NI R NI B G R Pan R NIR Fused R Fused . (10)[R’,G’,B’,NIR’] is obtained from upsampling original MS images with the same spatial scale as that of the Pan image using the artefact free image interpolation method [12]. The full details of Pan and the edge preserving characteristics of the used interpolation technique are a real advantage for the HRNDVI.
Based on this, (9) is written, using the MS and Pan images, as:
G Pan B R NIR R NIR NDVI HR − ⋅ + − + − ⋅ = 4 2 . (11)
For the vegetation extraction application using the HRNDVI, some equations are inspired from the method presented in [8], as:
⎥ ⎥ ⎥ ⎦ ⎤ ⎢ ⎢ ⎢ ⎣ ⎡ ′ + ′ = ⎥ ⎥ ⎥ ⎦ ⎤ ⎢ ⎢ ⎢ ⎣ ⎡ Pan G Pan B Fused G Fused R Fused IHS δ _ _ _ , with
(
)
, (12) ⎩ ⎨ ⎧ > − ⋅ ≤ ′ − = ′ θ θ δ HRNDVI I Pan k HRNDVI G Pan IHS , , 4 1At first, we have used I3 instead of I4, but the produced results looked blurred in the vegetated
areas. Hence, more experiments were conducted to select the best parameters in order to get high-resolution vegetation mapping. We have found that, using I4, a value of 4 for k1 produces
very good results. In addition, a good value of the HRNDVI threshold is estimated to be 0.05 less than the threshold value of the NDVI.
Equation (11) is the definition of the new index HRNDVI that is proposed for IKONOS images. This formula is highly similar to the one of the Enhanced Vegetation Index (EVI). This enhanced, soil and atmosphere resistant vegetation index was simplified to [13]:
L B C R C NIR R NIR EVI + − + − ⋅ = 2 1 2 , (13)
Where L is a canopy background adjustment term, and C1 and C2 are the coefficients of the
aerosol resistance term, which uses the B band to correct for aerosol influences in the R band. The EVI was proposed based on a feedback approach that incorporates both background adjustment and atmospheric resistance concepts into the NDVI [14]. The EVI has also been considered as a modified NDVI but with improved sensitivity to high biomass regions and improved vegetation monitoring capability through a de-coupling of the canopy background signal and a reduction in atmospheric influences [13].
The EVI was adopted by the MODIS (Moderate Resolution Imaging Spectroradiometer) Land Discipline Group as the second global-based vegetation index for monitoring the Earth’s terrestrial photosynthetic vegetation activity [13]. Nevertheless, the EVI index does not have a high resolution. The new proposed HRNDVI has the same general form as that of the EVI with the advantage of including high resolution information for vegetation detection.
The importance of using Pan images for computing the vegetation index is illustrated by the example of Fig. 1. Comparing the Pan image (Fig. 1(a)) with the RGB image (Fig. 1(b)) states that a “monument” surrounded by a red ellipse is not visible in the MS images.
(a) (b) (c) (d)
(e)
Fig. 1. (a) Pan image, (b) RGB image, (c) GIHS fused image, (d) considered column in red color, (e) NDVI, VTC’map, VI and HRNDVI corresponding to the red column in (d).
This “monument” is recovered after an IHS fusion, using the Generalized IHS (GIHS) [9] method: the fused image is shown in Fig. 1(c). The NDVI and HRNDVI thresholds are set to 0.2 and 0.15 respectively. If the NDVI is based on the R and NIR bands only, then an error in vegetation detection may occur in the “monument” area. However, if the NDVI makes use of the fused bands, this error will mitigate. In Fig. 1(e), the vegetation indices, corresponding to the “monument” column 67 (red column in Fig. 1(d)), namely NDVI, VTC’map, VI and
HRNDVI are plotted. All the VI values are higher than 0 which means that the VI considers this column as a vegetation area. Moreover, some NDVI values, corresponding to rows (55 to 64), are also significant (higher than 0.2). This is due to the large difference between the NIR and R bands. In this range of rows the NDVI confuses the detection of the “monument” with vegetation. Unlike the two vegetation indices all the values of the HRNDVI are smaller than the threshold leading to no error in the vegetation detection. The values of the VTC’map are,
also, less than 0, producing vegetation map confusion error free. In this example, the impact of the Pan image, in vegetation detection, is obvious. In general, if the Pan image is considered in the computation of the vegetation index, more errors related to detailed information will disappear. For the VTC’map, the values are small because this index is
computed, in Eq. (3), using little fractions of the MS images. This may produce some missing vegetation areas in the detection process. Some examples are shown in the experimental section.
The Pan image plays an important role in detecting vegetation. By this means, the VI and HRNDVI indices preserve more detailed vegetation areas than the conventional NDVI and the VTC’map. Although, the VI has a better spatial resolution, compared to the NDVI, all the conducted and observed examples show that the VI presents some confusion in vegetation detection. The proposed HRNDVI is a good solution in introducing the spatial resolution in the computation of the NDVI and guaranties less confusion in the vegetation detection process. It provides a new data source for monitoring agricultural production, and giving information for the development of crops during the growth season.
4 EXPERIMENTAL RESULTS
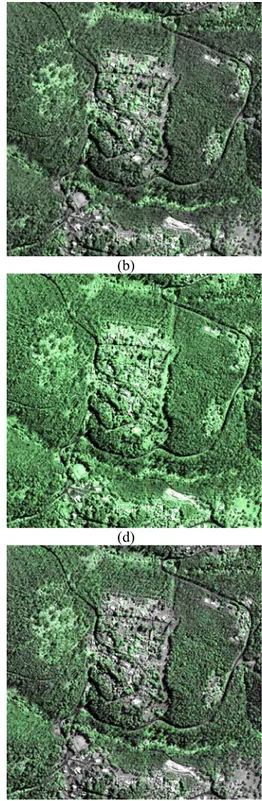
To illustrate the proposed method with examples, an image scene on Mt. Wellington, Tasmania, Australia, taken by the IKONOS satellite sensor on January 2005 is used for this experiment. The size of the original Pan image is approximately 12000×13000 pixels. The MS images were co-registered to the corresponding Pan image. Moreover, a standard stretching method was applied to the 11 bit images. In order to apply the same linear stretching to the four bands, a histogram stretching with identical clipping was performed on each band: i.e. using the same threshold values for clipping. This leads to a set of four low values and a set of four high values. The minimum of the low set and the maximum of the high set are used for clipping all histograms. In order to illustrate the efficiency of our algorithm, two subsets of images are used. The first one is mostly vegetation and the second one contains less vegetation. Small size images of 256x256 pixels will be considered. For comparison purposes, we consider the vegetation map, given by Eqs. (4), (6) and (11), and their application to vegetation extraction, expressed in Eqs. (5), (7) and (12), respectively. The obtained results are shown in Figs. (2) and (3) for the mostly vegetation case and less vegetation set, respectively.
Figures 2 (a) and 3 (a) shows that the VTC’map produces low-resolution maps and some
vegetation areas are missing in the vegetation detection process. For the VI index, the obtained maps of Figs. 2 (c) and 3 (c) illustrate an overestimation of vegetation, due to the large difference between the Pan image and the I3 component. In fact, the VI is designed for
(a) (b)
(c) (d)
(e) (f)
Fig. 2. The vegetation map and extraction of set 1: (a) VTC’map map, (b) extraction using
VTC’map, (c) VI map, (d) extraction using VI, (e) HRNDVI map, (f) extraction using
(a) (b)
(c) (d)
(e) (f)
Fig. 3. The vegetation map and extraction of set 2: (a) VTC’map map, (b) extraction using VTC’map, (c) VI map, (d) extraction using VI, (e) HRNDVI map, (f) extraction
Our results, presented in Figs. 2 (e) and 3 (e), are more accurate, the HRNDVI is a good solution to introduce the high-resolution information without an over or under estimation of vegetation. The rest of the images (b), (c) and (d) correspond to the vegetation extraction application using the VTC’map, the VI and the HRNDVI, respectively.
For a better illustration, zoomed areas are considered in Figs. 4 and 5. In Fig. 4 (a), compared to Fig. 4 (c), the white ellipse shows a missing detection vegetation area, whereas the red ellipse in Fig. 4 (b) shows an overestimated area as vegetation.
(a) (b) (c)
Fig. 4. The vegetation extraction sample 1: (a) extraction using VTC’map, (b) extraction using VI, (c) extraction using HRNDVI.
The extracted vegetation shown in Fig. 5 demonstrates that using the VTC’map
produces blurred vegetation areas. While, using the VI index, will introduce errors by considering some non-vegetation areas as vegetation. The HRNDVI, presented in Fig. 5 (c) is more accurate and can be considered as a tradeoff between the VTC’map
and the VI indices.
(a) (b) (c)
Fig. 5. The vegetation extraction sample 2: (a) extraction using VTC’map, (b) extraction using VI, (c) extraction using HRNDVI.
4 EXPERIMENTAL RESULTS
In this work, some methods used to extract and map the vegetation for IKONOS imagery are presented. Then a new method is proposed to reduce some problems associated with the under and over estimation of vegetation and the resolution characteristics of the extracted areas. To delineate the vegetation, a modified vegetation index (HRNDVI) is proposed and presented as a function of the multispectral and Pan images. The HRNDVI allows obtaining a high resolution vegetation mapping. Hence, the extracted images are more accurate especially in the urban environment. Moreover, the interpolation method, based on the preservation of edges and used to upsample the multispectral images, was helpful in producing a high resolution mapping. The proposed technique has been evaluated objectively, and has been proven efficient for the aim of this work. The obtained results, compared to some of the
existing methods, show the accurate vegetation extraction and the high resolution characteristics of the corresponding mapping. This proposed scheme can be easily adapted for images acquired from other satellites, having high resolution Pan images. Besides its performance, this method still remains as simple as the other techniques used for the IKONOS vegetation extraction.
Acknowledgments
Imagery courtesy of Space Imaging LLC.
This work was done under the PROFAS research program, in which M. Chikr El Mezouar is actually enrolled for an 18 month period at UEB INSA IETR Groupe Image et Télédétection, CS 70839 35708 Rennes Cedex 7, France.
References
[1] A.Verheyden, F. Dahdouh-Guebas, K. Thomas, W. De Genst, S. Hettiarachchi and N. Koedam, “High-resolution vegetation data for mangrove research as obtained from aerial photography,” Environment, Development and Sustainability, 4, 113-133 (2002).
[2] J. Rogan, and D.M. Chen, “Remote sensing technology for mapping and monitoring land-cover and land-use change, ” Progress in Planning, 61, 301-325 (2004).
[3] J. Nichol, and C. M. Lee, “Urban vegetation monitoring in Hong Kong using high resolution multispectral images,” International Journal of Remote Sensing, 26, 903-918 (2005).
[4] J. Hu, W. Chen, X. Li, and X. He, “Roof confusion removal for accurate vegetation extraction in the urban environment,” International Workshop on Earth Observation
and Remote Sensing Applications EORSA, 1-7, IEEE, Beijing China, (2008).
[5] S. J. Goetz, R. K. Wright, A. J. Smith, E Zinecker, and E. Schaub, “IKONOS imagery for resource management: Tree cover, impervious surfaces, and riparian buffer analyses in the mid-Atlantic region,” Remote Sensing of Environment, 88, 195-208 (2003).
[6] J. A. Greenberg, S. Z. Dobrowski, C. M. Ramirez, J. L. Tuil, and S. L. Ustin, “A Bottom-up Approach to Vegetation Mapping of the Lake Tahoe Basin Using Hyperspatial Image Analysis,” Photogrammetric Engineering & Remote Sensing, 72, 581-589 (2006).
[7] W. C. Cheng, J.C. Chang, C. P. Chang, Y. Su, and T. M. Tu, “A Fixed-Threshold Approach to Generate High-Resolution Vegetation Maps for IKONOS Imagery,” Sensors, 8, 4308-4317 (2008).
[8] T. M. Tu, H. T. Lu, Y. C. Chang, J. C. Chang, and C. P. Chang, “A New Vegetation Enhancement/Extraction Technique for IKONOS and QuickBird Imagery,” IEEE Geoscience and Remote Sensing Letters, 6, 349-353 (2009).
[9] T. M. Tu, P. S. Huang, C. L. Hung, and C. P. Chang, “A fast intensity-hue-saturation fusion technique with spectral adjustment for IKONOS imagery,” IEEE Geoscience and Remote Sensing Letters, 1, 309-312 (2004).
[10] Y. Xie, Z. Sha, and M. Yu, “Remote sensing imagery in vegetation mapping: A review,” J. Plant Ecology, 1, 9-23 (2008).
[11] T. M. Tu, W.C. Cheng, C. P. Chang, P. S. Huang, and J. C. Chang, “Best tradeoff for high-resolution image fusion to preserve spatial details and minimize color distortion,” IEEE Geoscience and Remote Sensing Letters, 4, 302-306 (2007).
[12] A. Giachetti, and N. Asuni, “Fast artifacts-free image interpolation,” Proc. British
[13] A. Huete, C. Justice, and W. V. Leeuwen, “MODIS vegetation index (MOD 13),”
algorithm theoretical basis document (ATBD) Version 3, pp. 129, (1999).
[14] H. Q. Liu, and A. Huete, “A feedback based modification of the NDVI to minimize canopy background and atmospheric noise,” IEEE Transactions on Geoscience and Remote Sensing, 33, 457-465 (1995).
Miloud Chikr El-Mezouar received his Dipl-Ing. and Magister degrees in Electrical
Engineering from the University of Sidi Bel Abbes (Algeria) in 1996 and 1999, respectively. He is a teaching assistant in the department of Electronic Engineering at the University of Sidi Bel Abbes where he has been teaching since 2003. He is currently an associate researcher in the “RCAM” laboratory at the same University where he is pursuing a Ph.D. degree. His principal research interests are in the fields of digital signal and image processing, and in medical and satellite imaging.
Nasreddine Taleb received a M.Sc. degree in computer engineering from Boston University,
Boston, an E.E. degree from Northeastern University, Boston, and a Doctorat d’Etat degree in electrical engineering from the University of Sidi Bel Abbes, Sidi Bel Abbes, Algeria. He is currently a Professor in the Department of Electronic Engineering, University of Sidi Bel Abbes, where he has been teaching since 1990. He is also a Senior Research Scientist and Director of the ‘Communication Networks, Architecture, and Multimedia’ laboratory at the University of Sidi Bel Abbes. His principal research interests are in the fields of digital signal and image processing, medical and satellite imaging, image analysis, pattern recognition, and advanced architectures for implementation of DSP/DIP applications. Dr. Taleb is a member of the Permanent Sectorial Research Committee at the Algerian Research Ministry.
Kidiyo Kpalma received his PhD in Image Processing from the National Institute for Applied
Sciences of Rennes (INSA) in 1992 and his HDR (Habilitation à diriger des recherches) in Signal processing and Telecommunications from the University of Rennes 1 in 2009 in France.
He is currently Associate Professor (Maître de conferences) at INSA where he teaches signals and systems, signal processing and DSP. As a member of the Image and Remote sensing group of the Institute of Electronics and Telecommunications of Rennes (IETR), his research interests are image analysis, pattern recognition, image fusion and remote sensing.
Joseph Ronsin obtained an M.Sc. in Electronics from the University of Rennes, France, in
1972. He joined, as a lecturer Institut National des Sciences Appliquées (INSA- National Institute for Applied Sciences) in Rennes, and obtained his D.Sc. in 1977. He became Directeur de Recherches in 1989 and Professor one year later.
He is now Professor in the Department of Electronic and Computer engineering of INSA where, till 2008, he was responsible for research of Image and Remote sensing group of Institut d’Electronique et Télécommunications de Rennes (IETR- Institute of Electronics and Telecommunications of Rennes). His main interests in image processing are for: analysis, pattern recognition, image interpretation, representation and compression.