HAL Id: hal-01717094
https://hal.archives-ouvertes.fr/hal-01717094
Submitted on 25 Feb 2018HAL is a multi-disciplinary open access archive for the deposit and dissemination of sci-entific research documents, whether they are pub-lished or not. The documents may come from teaching and research institutions in France or abroad, or from public or private research centers.
L’archive ouverte pluridisciplinaire HAL, est destinée au dépôt et à la diffusion de documents scientifiques de niveau recherche, publiés ou non, émanant des établissements d’enseignement et de recherche français ou étrangers, des laboratoires publics ou privés.
Public Domain
Cyclic behavior of elasto-plastic porous materials
subjected to triaxial loading conditions
Armel Mbiakop, Andreea Carpiuc, Andrei Constantinescu, Kostas Danas
To cite this version:
Armel Mbiakop, Andreea Carpiuc, Andrei Constantinescu, Kostas Danas. Cyclic behavior of elasto-plastic porous materials subjected to triaxial loading conditions. 11e colloque national en calcul des structures, CSMA, May 2013, Giens, France. �hal-01717094�
CSMA 2013
11e Colloque National en Calcul des Structures 13-17 Mai 2013
Cyclic behavior of elasto-plastic porous materials
subjected to triaxial loading conditions
A. Mbiakop1, A. Carpiuc2, A. Constantinescu1, K. Danas1
1LMS, CNRS UMR 7649, Ecole Polytechnique, France, mbiakop@lms.polytechnique.fr, andrei.constantinescu@lms.polytechnique.fr
kdanas@lms.polytechnique.fr,
2LMT, Ecole Normale Superieure Cachan, France
Résumé— This work proposes an analysis of the effect of cyclic loading of elasto-plastic porous ma-terials upon the microstructure evolution and possible failure of the material due to low cycle fatigue. In order to investigate this effect, periodic FEM unit-cell calculations are carried out subjected to va-rious stress triaxialities and Lode angles. The present results indicate that the absolute value of the stress triaxiality as well as of the value of the Lode angle are critical for the microstructure evolution and the subsequent material response. In addition, even though the macroscopic applied strains are relatively small, i.e., in the order of a few per cent, the local strains obtained near the pore surface can increase significantly (even more than 100%) due to significant localization of the deformation. This in turn leads to a critical evolution of the pore shape and as a consequence to porosity evolution.
Mots clés— Elasto-plasticity, Porous materials, Cyclic loading, Homogenization.
1
Introduction
Although significant advances have been made these last years in ductile fracture and monotonic loading conditions, a lot of questions remain open in the domain of cyclic response of materials. In particular, large amount of experimental data [1, 2] has shown a strong dependence of the material cyclic response upon the applied pressure. In this regard, consideration of a porous-matrix material system allows for a physical interpretation of pressure-dependent cyclic responses. More precisely, non linear homogenization models [3, 4] and micromechanical models [5] for elasto-plastic porous materials have been used for the prediction of material softening mainly due to the porosity evolution under monotonic loading conditions. To achieve that, a precise prediction of the evolution of the microstructure is needed (e.g., evolution of volume, shape and orientation of voids). On the other hand, many numerical and analytical results have been obtained concerning the influence of stress triaxiality [6, 7], denoted here as XΣ, and defined as the ratio between the mean stress to the von Mises equivalent or effective deviatoric stress. Recently, the effects of the third stress invariant, through the Lode angle [8, 9] in monotonic loading states have also been investigated. Nevertheless, much less has been studied in the context of cyclic loading conditions [10, 11] with a main emphasis on axisymmetric loading states. Even if in the majority of studies in the bibliography, cyclic response is analyzed using small strain calculations considering macroscopic strain amplitudes in the range of 1%− 5%, local strains can be in excess of 100% due to strong localization of the deformation around impurities or voids as is the present case. For that reason, it is critical that a finite deformation analysis is carried out. In this regard, the scope of this study is to investigate the effect of cyclic loading conditions and finite deformations upon microstructure evolution and material softening/hardening using FEM periodic unit-cell calculations with 3D geometry.
2
Problem formulation
In this section, we define the geometry and loading conditions used in the present study. In addi-tion, we identify the relevant microstructural parameters needed to analyze the results of the following sections.
2.1 Geometry, mesh and loading conditions
Three dimensional model studies are carried out for a cubic unit-cell with a spherical void at the center, as shown in Fig. 1. The initial side length of the unit-cell is 2L, and the initial void radius is a. In this study, we apply purely triaxial stress states together with periodic boundary conditions which are
1/8 cut 1 2 3 2L 2L 2L L L L
Fig. 1 –Three-dimensional geometry of the a cubic unit-cell with a void at the center and mesh of the 1/8 cut of the complete geometry.
formally defined via
σ· n anti − periodic, v = D · x + v∗, v∗periodic. (1)
In this relation, σ and D denote the average stress and strain-rate fields in the unit cell respectively, n the normal to the exterior face of the unit cell, v = ˙u the velocity field, and v∗is a periodic velocity field [12]. Moreover, the principal directions of the loading are aligned with the normal of the symmetry planes, so the external faces of the cell remain straight [12, 13] and hence only 1/8 of the unit cell is considered, as shown in Fig. 1. a) b) Lode angle X = 2/3 Normalised stress components 2 1 3 Lode angle X = 3 Normalised stress components 1 2 3
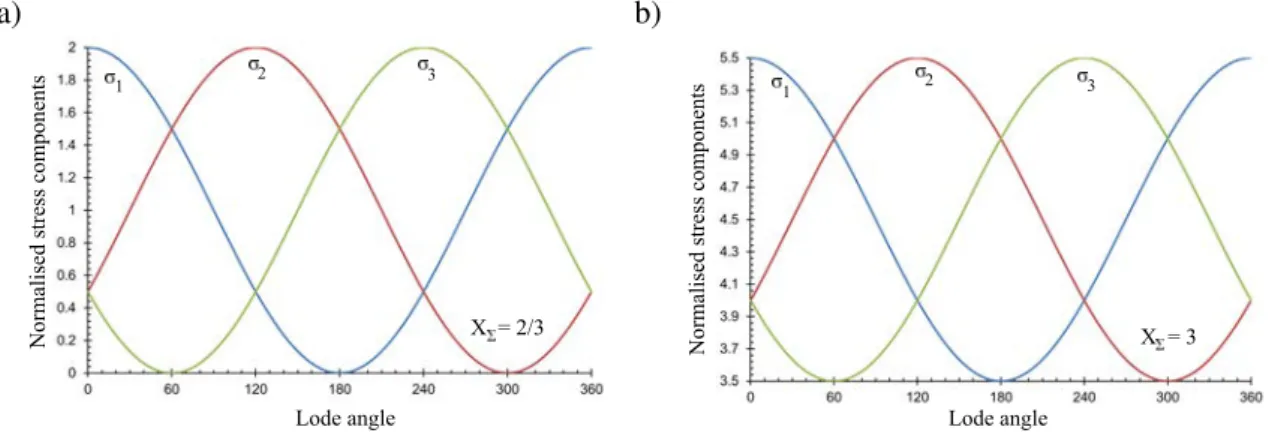
Fig. 2 –Components of normalised stress 3σi/2σeq, i = 1, 2, 3 as a function of the Lode angleθ in the case of (a) XΣ= 2/3 and (b) XΣ= 3.
It is useful to define at this point the overall stress triaxiality, XΣ, and average Lode angle,θ, such that XΣ= σm σeq , cos (3θ) = 27 2 det ( σ′ σeq ) , σm= 1 3σkk, σeq= √ 3 2σ ′: σ′, (2)
with σ′ denoting the stress deviator. Using the definition of equation (2), one can write the principal components of the stress field as a function of XΣandθ, via
3 2σeq{σ1 ,σ2,σ3} = { −cos(θ +π 3 ) ,−cos ( θ −π 3 ) , cosθ } +3 2XΣ{1,1,1}. (3)
The graphical illustration of the above relation is shown in Figure 3, where the normalzed stress compo-nents, 3σi/2σeqare shown as a function of Lode angle for two different triaxialities (a) XΣ= 2/3 and (b) XΣ= 3, respectively. Note that due to the periodicity of the functions used in equation (3), every 60° the three principal stresses interchange values.
a) b) c) A B C D 1 cycle u t O A B C D 1 cycle t Σ X O A B C D 1 cycle θ t θ θ+π O
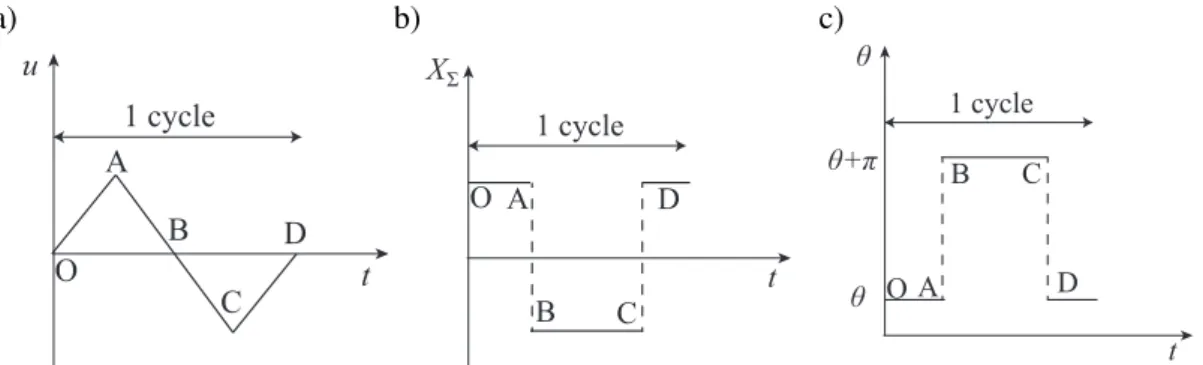
Fig. 3 –Schematic explanation of the application of the cyclic loading and the corresponding qualitative values of (a) the applied displacement u, (b) the applied stress triaxiality XΣand (c) the applied Lode angleθ as a function of time for one cycle.
Using the above definitions, in the present study, each cycle is divided in 4 steps. Each step of each cycle is shown in Fig. 1a, where the displacement u, initially increases from O to A (step 1), unloads from A to B (step 2), reversely loads from B to C (step 3) and unloads from C to D (step 4) defining thus an entire cycle. The average strain-rate D is evaluated such that the stress triaxiality XΣ and Lode angleθ remain constant in each step, as shown in Fig. 1b and Fig. 1c. Note in these figures that in order to obtain full stress reversibility, XΣ has to change sign and θ has to jump to θ + π between A-D. For convenience, hereafter, the notations XΣ andθ are used to denote unambiguously the absolute value of the stress triaxiality and the initial value of the Lode angle in each cycle.
In the present calculations, standard J2 plasticity theory was used to describe the behavior of the
matrix together with an isotropic strain hardening law given by σy=σ0 ( 1 +ε p ε0 )1/N , ε0=σ0/E. (4)
Here,σ0 andε0denote the initial yield stress and yield strain of the matrix material, N is the hardening
exponent and E the Young’s modulus. In the present calculations, the representative values N = 10,
E = 1000σ0and Poisson ratioν = 0.3 are used. The effect of these parameters upon the unit-cell response
will be explored elsewhere due to restriction in space.
2.2 Evolution of the microstructure
In this section, we define the variables used to characterize the evolution of the microstructure, i.e., the change in volume and shape of the void. More specifically, the porosity is defined as f = Vv/V =
1−Vm/V , where Vv is the volume of the void, Vmis the volume of the matrix and V = Vm+ Vv is the
total volume of the unit cell. Here Vmis calculated as the sum of each element volume, while the
unit-cell volume V is evaluated using the coordinates of the upper corner node since due to symmetry of the microstructure and the loading conditions the external faces of the cell remain straight[12].
Due to the finite deformations considered in this study, significant changes in the pore shape are observed. Therefore, appropriate geometrical quantities need to be introduced in order to evaluate these pore shape changes. First, the void shape is characterized by two aspect ratios w1= a3/a1and w2= a3/a2
where 2ai(with i = 1, 2, 3) denote the lengths of the principal axes of the void, as shown on Fig. 4a where
only 1/8 of the void geometry is shown. As a second measure of the pore geometry change, we have also defined an ellipsoidicity ratio. This ratio has been introduced as a measure of the divergence of the void geometry from an equivalent perfect ellipsoid, as depicted in Fig. 4b. While a large number of options can be used to identify this difference, use is made here of a simple measure. First, we set the axes of the ideal ellipsoid equal to the length of the actual void axes. Then, the volume of that ellipsoid, Ve, will in general be different from that of the void Vv due to the nonlinearity of the matrix phase and
the interactions of the neighboring voids of the periodic composite. As a result the ellipsoidicity ratio Ve/Vv gives the difference of the actual void shape from that of a perfect ellipsoid. Consequently, if the
ellipsoidicity is close to unity, the void shape remains almost an ellipsoid.
The above definitions definitions will be used in the following to analyze and understand the micro mechanisms that lead to an overall material softening due to the applied cyclic loading conditions.
a) b) 1/8 Perfect ellipsoid a1 a2 a3 Actual shape Ideal ellipsoid shape
a1
a2
1 2
Cross-section in 1-2 plane
Fig. 4 – (a) Schematic representation of 1/8 of the surface of a perfect ellipsoidal void. (b) Qualitative cross-section in the 1− 2 plane where the qualitative difference between the actual void shape and an ideal ellipsoid shape having the same aspect ratios with the actual void is shown.
3
Results
In this section, we discuss the results obtained by the previously described loading conditions. In this work, two different values of the stress triaxiality XΣ= 2/3, 3 and three different values of the Lode angle θ = 0o, 30o, 60o are used. For the lower triaxiality X
Σ= 2/3, we set the macroscopic strain amplitude
u/L = 5% and for the high triaxiality XΣ= 3, we set the macroscopic strain amplitude u/L = 1%. The
difference in amplitudes has been introduced to accelerate the number of cycles leading to material softening and/or localization of the strain as will be shown in the next. Moreover, for convenience with the meshing, we use an initial porosity f0= 0.01, which corresponds to a void radius a/L = 0.2673.
a) b)
Number of cycles, Nr Number of cycles, Nr
Average value Maximum value
Minimum value
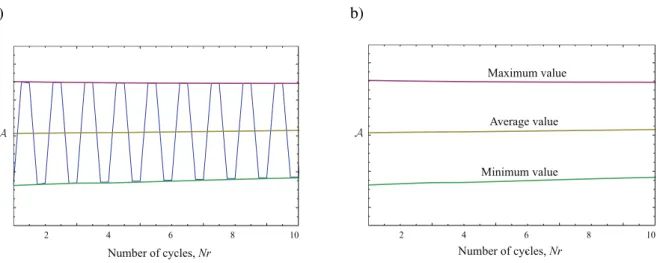
Fig. 5 –Qualitative description of the cyclic response of a variableA as a function of the number of cycles Nr. The minimum, maximum and average values ofAare extracted by the corresponding cyclic response.
In order to clarify further the following results, we include Fig. 5, where for a given variable (e.g., porosity, aspect ratios, ellipsoidicity, etc), the average per cycle is defined as the arithmetic mean of the maximum and the minimum value per cycle. In the following, only average values will be shown except for the stress where the maximum von Mises stress will be shown.
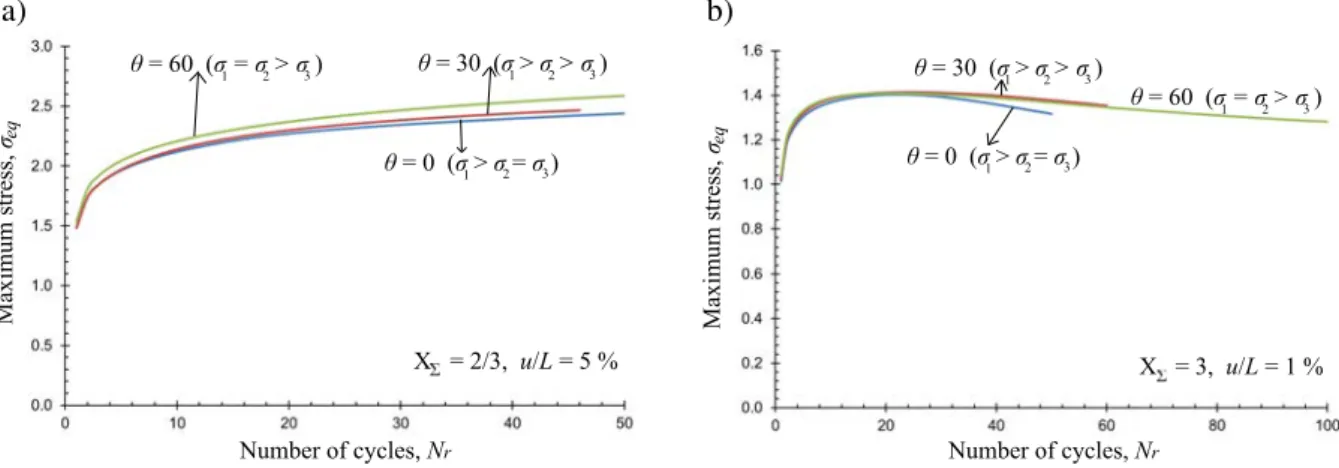
In Fig. 6, we show the maximum equivalent Von Mises stress per cycle σeq as a function of the
number of cycles Nrfor triaxiality XΣ= 2/3 (and amplitude u/L = 5%) and XΣ= 3 (and u/L = 1%) as
well as for three Lode anglesθ = 0,30,60o. As we can observe in Fig. 6a, for XΣ= 2/3, the effect of the Lode angle on the estimation ofσeqis rather weak similar to the one for XΣ= 3 in Fig. 6b. Nonetheless,
for XΣ= 3, we show thatσeqreaches a maximum after nearly 25 cycles while no such observation can
be made for XΣ= 2/3. This result confirms exactly that the triaxiality is a critical parameter in cyclic loading. In particular in Fig. 6b, for XΣ= 3, we observed that theσeqforθ = 0oshows a more pronounced
decrease than the two other cases, i.e.,θ = 30° and θ = 60°.
In order to explain the maximumσeqfor XΣ= 3, we show in Fig. 7 the porosity f as a function of
the number of cycles Nr for the same set of stress trivialities and Lode angles. The main observation
a) b) Number of cycles, Nr Maximum s tress, σeq X = 2/3, u/L = 5 % θ = 60 (σ = σ > σ ) 1 2 3 θ = 0 (σ > σ = σ ) 1 2 3 θ = 30 (σ > σ > σ ) 1 2 3 Number of cycles, Nr θ = 0 (σ > σ = σ ) 1 2 3 θ = 30 (σ > σ > σ ) 1 2 3 θ = 60 (σ = σ > σ ) 1 2 3 X = 3, u/L = 1 % Maximum s tress, σeq
Fig. 6 –Maximum equivalent Von Mises stress evolution in the case of (a) u/L = 5%, XΣ= 2/3 and (b) u/L = 1%,
XΣ= 3 as a function of the number of cycles Nr.
a) b) Number of cycles, Nr θ = 0 (σ > σ = σ ) 1 2 3 θ = 30 (σ > σ > σ ) 1 2 3 θ = 60 (σ = σ > σ ) 1 2 3 Porosity, f X = 2/3, u/L = 5 %Σ Number of cycles, Nr Porosity, f θ = 0 (σ > σ = σ ) 1 2 3 θ = 30 (σ > σ > σ ) 1 2 3 θ = 60 (σ = σ > σ ) 1 2 3 X = 3, u/L = 1 %Σ
Fig. 7 –Porosity evolution in the case of (a) u/L = 5%, XΣ= 2/3 and (b) u/L = 1%, XΣ= 3 as a function of the number of cycles Nr.
Lode angles, when XΣ= 3 is considered in Fig. 7b, we observe a very important increase of f which is in the order of f ∼ 4 f0. It is therefore easy to conclude that this substantial increase of f in the case
of XΣ = 3 leads to the corresponding decrease of σeq in Fig. 6b. In addition, one can also observe a
more pronounced dependence of the porosity evolution on the Lode angleθ for both stress triaxialities, especially in the case of XΣ= 3. It should be noted here that calculations have stopped after nearly 60 cycles for XΣ= 3 andθ = 0 and θ = 30° as a result of strong deformation localization around the void as will be discussed in the following. These results obviously reveal the effect of stress triaxiality and Lode parameter upon porosity ratcheting, which is – as expected – more pronounced at higher stress triaxialities.
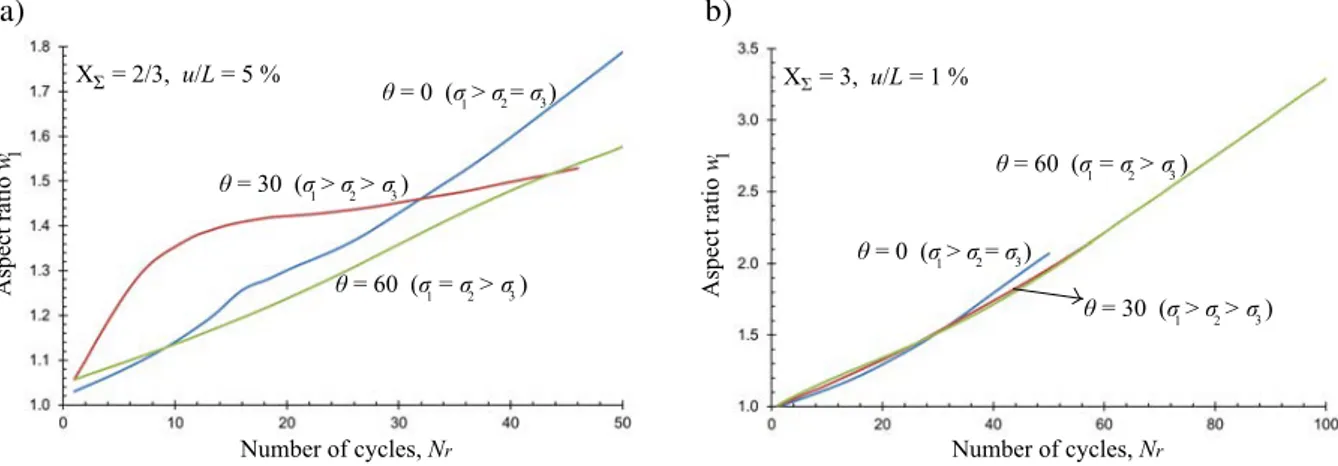
In order to understand, however, the porosity growth after several cycles, we examine, next, the more local void geometry changes. More specifically, Fig. 8 and Fig. 9 show the evolution of the aspect ratios w1 and w2, respectively as a function of the number of cycles Nr for the same set of stress triaxialities
and Lode angles considered previously. The main observation in the context of these two figures is that the evolution of the average aspect ratios w1and w2is non-negligible with increasing number of cycles.
It is, in fact, observed that due to the applied finite deformations, the shape of the void changes from the very first cycle and it tends to grow further as the number of cycles increases. Even more interestingly, the largest change in the void shape occurs for higher stress triaxialities, i.e., XΣ= 3, as shown in Figs. 8b and 9b, contrary to the case of XΣ= 2/3 where both aspect ratios increase but in weaker manner. This result is not intuitive if one extrapolates the knowledge obtained in the context of monotonic loadings (see for instance [14]), where the largest void shape changes occur usually for lower stress triaxialities.
On the other hand, regarding the evolution of the aspect ratio w1, in Fig. 8, we observe that the effect
of the Lode parameter is much stronger in the case of the lower triaxiality XΣ= 2/3, while it becomes negligible for XΣ= 3. On the other hand, as shown in in Fig. 9, the evolution of the aspect ratio w2 is
a) b) Number of cycles, Nr θ = 0 (σ > σ = σ ) 1 2 3 θ = 30 (σ > σ > σ ) 1 2 3 θ = 60 (σ = σ > σ ) 1 2 3 Aspect ratio w1 X = 2/3, u/L = 5 %Σ Aspect ratio w1 θ = 60 (σ = σ > σ ) 1 2 3 θ = 30 (σ > σ > σ ) 1 2 3 θ = 0 (σ > σ = σ ) 1 2 3 X = 3, u/L = 1 % Number of cycles, Nr
Fig. 8 – Evolution of the aspect ratio w1in the case (a) u/L = 5%, XΣ= 2/3 and (b) u/L = 1%, XΣ= 3 as a
function of the number of cycles Nr.
a) b) Aspect ratio w2 Number of cycles, Nr θ = 60 (σ = σ > σ ) 1 2 3 θ = 0 (σ > σ = σ ) 1 2 3 θ = 30 (σ > σ > σ ) 1 2 3 X = 2/3, u/L = 5 %Σ Aspect ratio w2 Number of cycles, Nr θ = 60 (σ = σ > σ ) 1 2 3 θ = 30 (σ > σ > σ ) 1 2 3 θ = 0 (σ > σ = σ ) 1 2 3 X = 3, u/L = 1 %Σ
Fig. 9 – Evolution of the aspect ratio w2in the case (a) u/L = 5%, XΣ= 2/3 and (b) u/L = 1%, XΣ= 3 as a
function of the number of cycles Nr.
strongly dependent upon the Lode angleθ for both stress triaxialities. Note further that for θ = 60o(i.e., σ1=σ2, w1= w2during the entire deformation process, while forθ = 0o(i.e.,σ2=σ3), and w2= a3/a2
is close to unity.
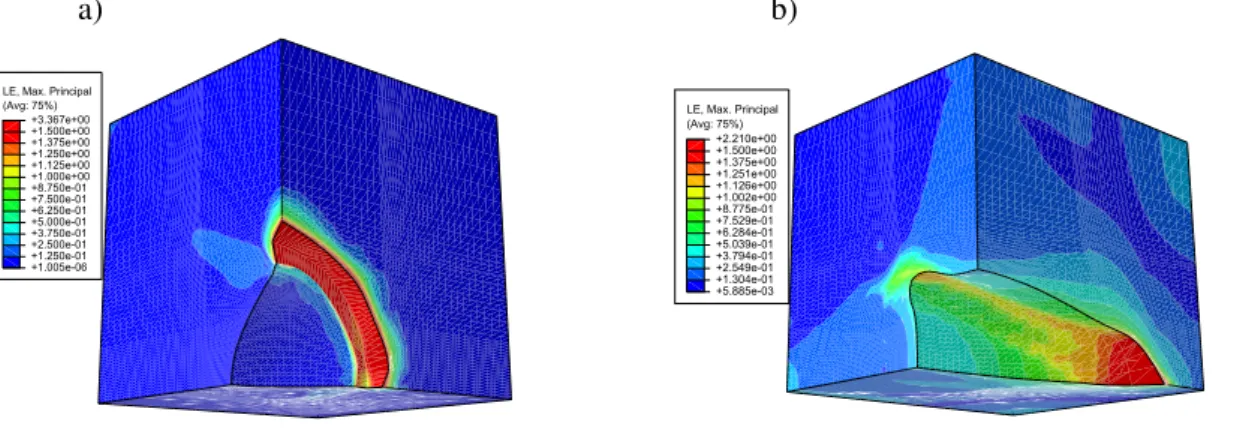
At this point, however, we note that the evolution of the void shape does not describe adequately the deformation mechanisms near the void surface. In fact, for most of the computations presented here (except for the case of θ = 60o) significant localization of the deformation occurs at the surface of the void. To illustrate this, we show, in Fig. 10a, a contour of the deformed unit-cell at 40 cycles for
u/L = 5%, Lode angle of θ = 0 and a stress triaxiality of XΣ = 2/3. In this contour, we observe a
strong localization of the deformation (strains exceeding 300%) in a single line of elements. This same type of localization has been observed in all computations, i.e. for XΣ = 2/3 and XΣ = 3 except for θ = 60°. In this last case, Fig. 10b shows that the void elongates significantly along the x3 axis, i.e.,
along the direction of the minimum absolute stress component (since for θ = 60o,|σ
1| = |σ2| > |σ3|)
and gives rise to coalescence with the neighboring void in this direction. It should be noted here that the observed localization affects only a small region of the void surface and inevitably leads to strong mesh dependence at the local level. As will be seen later, however, this mesh dependence affects only local quantities (such as the aspect ratio) but not macroscopic quantities such as the macroscopic stress, and the porosity evolution.
To assess further the effects of the localization upon the void shape changes, we show in Fig. 11, the ellipsoidicity ratio Ve/Vv (defined in the previous section) as a function of the number of cycles Nr.
In these graphs, the ellipsoidicity ratio reaches high values (more than 1.5) after 30 and 40 cycles for the cases XΣ= 2/3,θ = 0 and XΣ= 3,θ = 0, respectively, as a result of the corresponding deformation localization around the pore surface. The same remark can be made for XΣ= 2/3,θ = 30° and XΣ= 3, θ = 30° but with somewhat lower values of ellipsoidicity, in the order of 1.1−1.5 after 40 and 60 cycles,
a) b)
(Avg: 75%) LE, Max. Principal
+1.005e-06 +1.250e-01 +2.500e-01 +3.750e-01 +5.000e-01 +6.250e-01 +7.500e-01 +8.750e-01 +1.000e+00 +1.125e+00 +1.250e+00 +1.375e+00 +1.500e+00 +3.367e+00 u/L = 5 %, X = 2/3, = 0, 50 cycles Σ (Avg: 75%) LE, Max. Principal
+5.885e-03 +1.304e-01 +2.549e-01 +3.794e-01 +5.039e-01 +6.284e-01 +7.529e-01 +8.775e-01 +1.002e+00 +1.126e+00 +1.251e+00 +1.375e+00 +1.500e+00 +2.210e+00 u/L = 1 %, X = 3, = 60, 100 cycles Σ
Fig. 10 –Contours of the maximum principal logarithmic strain for (a) u/L = 5%,θ = 30oand XΣ= 1 and (b)
u/L = 1%,θ = 60, XΣ= 3.
a) b)
Number of cycles, Nr
Ellipsoidic
ity Actual shape
1 2 X = 2/3, u/L = 5 % θ = 0 (σ > σ = σ ) 1 2 3 θ = 30 (σ > σ > σ ) 1 2 3 θ = 60 (σ = σ > σ ) 1 2 3 a2 1 a Number of cycles, Nr Ellipsoidic ity Actual shape 1 2 a1 a2 θ = 0 (σ > σ = σ ) 1 2 3 θ = 60 (σ = σ > σ ) 1 2 3 θ = 30 (σ > σ > σ ) 1 2 3 X = 3, u/L = 1 %Σ
Fig. 11 –Ellipsoidicity ratio in the case (a) u/L = 5%, XΣ= 2/3 and (b) u/L = 1%, XΣ= 3 as a function of the number of cycles Nr. a) b) Porosity, f Number of cycles, Nr 5.10 elements4 2.10 elements4 10 elements5 Number of cycles, Nr 5.10 elements4 2.10 elements4 10 elements5 Aspect ratio w1
Fig. 12 –(a) Average porosity f and (b) aspect ratio w1for 2× 10⁴, 5× 10⁴and 105number of elements.
respectively. In contrast, the ellipsoidicity is the smallest (and less than 1.2) for θ = 60 in both cases, which is in agreement with the observations made in the context of Fig. 10b.
As a result of the presence of deformation localization, local measures such as the aspect ratios are mesh sensitive, whereas, interestingly, average measures, such as, porosity, average stress or strain are not strongly mesh dependent. This is validated by carrying out calculations with 2×10⁴, 5×10⁴and 105
20−node hexahedral quadratic isoparametric elements as shown in Fig. 12. In the present study, use is
4
Discussion
In this work we have investigated the effects of cyclic loading conditions upon microstructure evo-lution and material softening/hardening using FEM periodic unit-cell calculations at finite deformations. It has been found that the stress triaxiality has a significant effect upon the cyclic response of the unit cell. In contrast, the Lode angle has a significant impact on the evolution of local variables such as the aspect ratios and the ellipsoidicity ratios but has only a weak effect on the macroscopic measures such as the stress and the porosity evolution as a function of the number of cycles. While porosity ratcheting has been observed in both stress triaxialities used in this study, porosity growth has been found to be more important only for the higher stress triaxiality. In this connection, it has also been found that the aspect ratios evolve more in the case of higher stress triaxialities than in lower ones, but more studies are needed to clarify the interplay of these two micro structural variables on the overall material res-ponse when subjected to cyclic loading. Finally, strong deformation localization has been observed in all computations performed here (except for Lode angleθ = 60owhich corresponds to|σ1| = |σ2| > |σ3|).
This localization, which remains near the void surface and does not extend to the exterior faces of the unit-cell, gives rise to a markedly non-ellipsoidal void shape evolution and as a result an ellipsoidicity ratio has been introduced to assess the quantitative character of this effect.
Références
[1] Monchiet, V., Charkaluk, E., Kondo, D., A micromechanical explanation of the mean stress effect in high cycle
fatigue, Mechanics Research Communications 35, 383–391, 2008.
[2] Tabibian, S., Charkaluk, E., Contantinescu, A., Szmytka F., Oudin, A., TMF-LCF life assessment of a Lost
Foam Casting aluminum alloy, International Journal of Fatigue (2012) doi :10.1016/j.ijfatigue.2012.01.012.
[3] Ponte Castañeda, P., The effective mechanical properties of non linear isotropic composites, J. Mech. Phys. Solids 39, 45–71, 1991.
[4] Michel, J.C., Suquet, P., The constitutive law of nonlinear viscous and porous materials, J. Mech. Phys. Solids 40, 783–815, 1992.
[5] Gurson, A.L., Rupture mechanisms in combined tension and shear Experiments, J. Eng. Material. Technol 99, 2–15, 1977.
[6] McMeeking, R.M., Hom, C.L., Finite element analysis of void growth in elastic-plastic materials,International Journal of Fracture 42, 1–19, 1990.
[7] Worswick, M.J., Pick, R.J., Void growth and constitutive softening in a periodically voided solid,J. Mechs. Phys. Solids 38, 601–625, 1990.
[8] Zhang, K.S., Bai J.B., Francois D., Numerical analysis of the influence of the Lode parameter on the void
growth,International Journal of Solids and Structures 38, 5847–5856, 2001.
[9] Kim, J., Gao, X., Tirumalai, S.S., Modeling of void growth in ductile solids : effects of stress triaxiality and
initial porosity, Engineering Fracture Mechanics 71, 379–400, 2004.
[10] Devaux, J., Gologanu, M., Leblond, J.B., Perrin, G. On continued voids growth in ductile metals subjected to
cyclic loadings,Symposium on Nonlinear Analysis of Fracture, J.R. Willis ed., 299–310, 1997.
[11] Besson, J., Guillemer-Neel, C., An extension of the Green and Gurson models to kinematic hardening, Me-chanics of Materials 35, 1–18, 2003.
[12] Suquet, P., Elements of Homogenization for Inelastic Solid Mechanics, In E. Sanchez-Palencia, A. Zaoui (eds), 1987.
[13] Garajeu, M., Michel, J.C., Suquet, P., A micromechanical approach of damage in viscoplastic materials by
evolution in size, shape and distribution of voids, Comput. Methods Appl. Mech. Eng. 183, 223–246, 2000.
[14] Danas K., Aravas N., Numerical modeling of elasto-plastic porous materials with void shape effects at finite