HAL Id: hal-01095282
https://hal.inria.fr/hal-01095282
Submitted on 2 Feb 2015
HAL is a multi-disciplinary open access
archive for the deposit and dissemination of
sci-entific research documents, whether they are
pub-lished or not. The documents may come from
teaching and research institutions in France or
abroad, or from public or private research centers.
L’archive ouverte pluridisciplinaire HAL, est
destinée au dépôt et à la diffusion de documents
scientifiques de niveau recherche, publiés ou non,
émanant des établissements d’enseignement et de
recherche français ou étrangers, des laboratoires
publics ou privés.
Issues, Requirements and Methodology Applied to a
Real Use Case
Manabu Tsukada, José Santa, Satoshi Matsuura, Thierry Ernst, Kazutoshi
Fujikawa
To cite this version:
Manabu Tsukada, José Santa, Satoshi Matsuura, Thierry Ernst, Kazutoshi Fujikawa. On the
Exper-imental Evaluation of Vehicular Networks: Issues, Requirements and Methodology Applied to a Real
Use Case. EAI Endorsed Transactions on Industrial Networks and Intelligent Systems, ICST, 2014,
pp.1-14. �10.4108/inis.1.1.e4�. �hal-01095282�
On the Experimental Evaluation of Vehicular
Networks: Issues, Requirements and Methodology
Applied to a Real Use Case
Manabu Tsukada
12,∗, José Santa
34, Satoshi Matsuura
5, Thierry Ernst
6, Kazutoshi Fujikawa
71INRIA Paris - Rocquencourt, Domaine de Voluceau Rocquencourt - B.P. 105 78153 Le Chesnay Cedex, France 2The University of Tokyo, 1-1-1, Yayoi, Bunkyo-ku, Tokyo, 113-8656 Japan
3University Centre of Defence at the Spanish Air Force Academy, MDE-UPCT , Murcia, Spain 4University of Murcia, Campus de Espinardo, 30100 Murcia, Spain
5Tokyo Institute of Technology, 2-12-1, Ookayama, Meguro-ku, Tokyo, 152-8850, Japan 6Centre de Robotique, MINES ParisTech, Paris, France
7Nara Institute of Science and Technology, Nara, Japan
Abstract
One of the most challenging fields in vehicular communications has been the experimental assessment of protocols and novel technologies. Researchers usually tend to simulate vehicular scenarios and/or partially validate new contributions in the area by using constrained testbeds and carrying out minor tests. In this line, the present work reviews the issues that pioneers in the area of vehicular communications and, in general, in telematics, have to deal with if they want to perform a good evaluation campaign by real testing. The key needs for a good experimental evaluation is the use of proper software tools for gathering testing data, post-processing and generating relevant figures of merit and, finally, properly showing the most important results. For this reason, a key contribution of this paper is the presentation of an evaluation environment called AnaVANET, which covers the previous needs. By using this tool and presenting a reference case of study, a generic testing methodology is described and applied. This way, the usage of the IPv6 protocol over a vehicle-to-vehicle routing protocol, and supporting IETF-based network mobility, is tested at the same time the main features of the AnaVANET system are presented. This work contributes in laying the foundations for a proper experimental evaluation of vehicular networks and will be useful for many researchers in the area.
Keywords: Experimental Evaluation, Vehicular Ad-hoc Networks, Wireless Multihop Communication, Network Mobility, Cooperative ITS, Intelligent Transportation Systems
1. Introduction
Intelligent Transportation Systems (ITS) are systems deployed to optimize the road traffic and realize safe, efficient and comfortable human mobility. There are a number of research fields in ITS but cooperative ITS and vehicular communications have received an especial attention during the last years. Within this area various technologies are considered, such as wireless communications, network management, communication security, navigation, etc. In cooperative ITS, multiple entities share information and tasks to achieve common objectives. Thus, data exchange exists among vehicles, roadside infrastructure, traffic control centers, road users, road authorities and road operators, to support drivers, pedestrians, road authorities and
∗
Corresponding author. Email:tsukada@hongo.wide.ad.jp
operators in different areas of safety, traffic efficiency and infotainment. The European Commission (EC), for instance, published the action plan [1] in Europe followed by ITS standardization mandate [2], to speed up the adoption of these systems in the European Union, but there are a number of initiatives worldwide to encourage the research and development in ITS, mainly from the US Department of Transport and the Japan Ministry of Land, Infrastructure, Transport and Tourism.
There are few barriers in the global road network among countries, and vehicles easily cross country bor-ders, especially in Europe. Thus there is a huge neces-sity that cooperative ITS relies on the same architec-ture, protocols and technologies. As such, standardiza-tion organizastandardiza-tions are developing cooperative ITS stan-dards. The International Organization for Standardiza-tion (ISO) Technical Committee 204 Working Group
on Industrial Networks and Intelligent Systems
Research Article
Received on 31 May 2014, Accepted on 29 October 2014, Published on 09 December 2014
Copyright © 2014 Manabu Tsukada et al., licensed to ICST. This is an open access article distributed under the terms of the Creative Commons Attribution licence (http://creativecommons.org/licenses/by/3.0/), which permits unlimited use, distribution and reproduction in any medium so long as the original work is properly cited.
16 (TC204 WG16) (also known as Communications Architecture for Land Mobile (CALM)) is in charge of standardizing a communication architecture for coop-erative ITS. TC204 WG16 is specially working on a communication architecture supporting all types of access media and applications. In Europe, the European Telecommunications Standards Institute (ETSI) TC ITS is working on building blocks of the same architecture in harmonization with ISO TC204 WG16. In 2010, both ISO TC204 WG16 and ETSI TC ITS defined the ITS Station reference architecture [3,4].
In cooperative ITS and, in general, in vehicular net-works, there are two main communication paradigms, vehicle to vehicle (V2V) and vehicle to infrastructure (V2I), depending on whether the communication is performed directly between vehicles or using nodes locally or remotely installed on the road infrastructure. When the V2V paradigm is considered, the research field is commonly called Vehicular Ad-hoc Networks, or VANET, as an especial case of Mobile Ad-hoc Networks (MANET) where nodes are vehicles. Although there are a lot of works related to VANET applications and basic research at physical, MAC and network layers, there is a significant lack of real evaluation analysis in this field, due to cost and effort implications. Many VANET solutions and protocols could be considered as non-practical designs if they were tested over real scenarios, as it has been proved in MANET [5]. Performance of VANET protocols based on a pure broadcast approach can be more or less expected in simple configurations, even if they are not experimentally tested; but the num-ber of issues concerning the real performance of multi-hop designs is much more tricky. A similar problem can be found in V2I, which has received a great attention by the research community in the last years, due to the idea that V2I technologies and services will find a place in the market before V2V approaches. Nevertheless, a number of experimentation works and supporting tools should be improved in the short term, in order to give real evidences to car manufacturers and road operators of the benefits of vehicular communications.
Conventional network measurement tools (e.g.iperf, ping or traceroute) assume fixed networks and assess
network performances in an end-to-end basis. However, under dynamic network conditions such as in the vehicular networks case, it is difficult to analyze in detail the operation of networks by using solely these tools, because vehicles are always changing their location and the performance of wireless channels fluctuates. In order to solve these issues, we have developed a packet analysis and visualization tool called AnaVANET1, which considers the peculiarities of the vehicular environment for providing an exhaustive
1http://anavanet.net/
evaluation software for outdoor scenarios (Figure 1
includes a preliminary screenshot of the visualization). Both V2V and V2I networks can be efficiently analyzed, thanks to the integrated features for collecting results, post-processing data, generate graphical figures of merit and, finally, publish the results in a dedicated web site (if desired). All tests and results are later available in the form of an animated webpage where both researchers and the general public can access the evaluations. AnaVANET has been successfully exploited for the moment in experimental evaluation campaigns in the GeoNet [6] and ITSSv6 [7] projects.
Figure 1. Screenshot of AnaVANET viewer
In this paper, apart from presenting our tool for assessing the performance of vehicular networks, we analyze in detail the problem of real testing in V2V and V2I, identifying the main issues, requirements, and proposing a general methodology useful for further works in the area. To sum up, the rest of the paper is organized as follows. Section2 introduces the readers in network layer protocols for vehicular networks. Section 3 reviews related works in the area of testing vehicular networks. Then, the issues and requirements for evaluating vehicular networks are listed in Section4. The evaluation methodology desired in this frame is described in Section5and, as a result of our analysis, the design and implementation of the AnaVANET evaluation tool is detailed in Section 6, together with a reference evaluation of a network testbed using the tool in Section 7. As a result of this evaluation, the functionalities provided by AnaVANET are analyzed in Section8according to the previously identified needs. Finally, Section9concludes the paper summarizing the main results and addressing future works.
2. Network protocols in vehicular networks
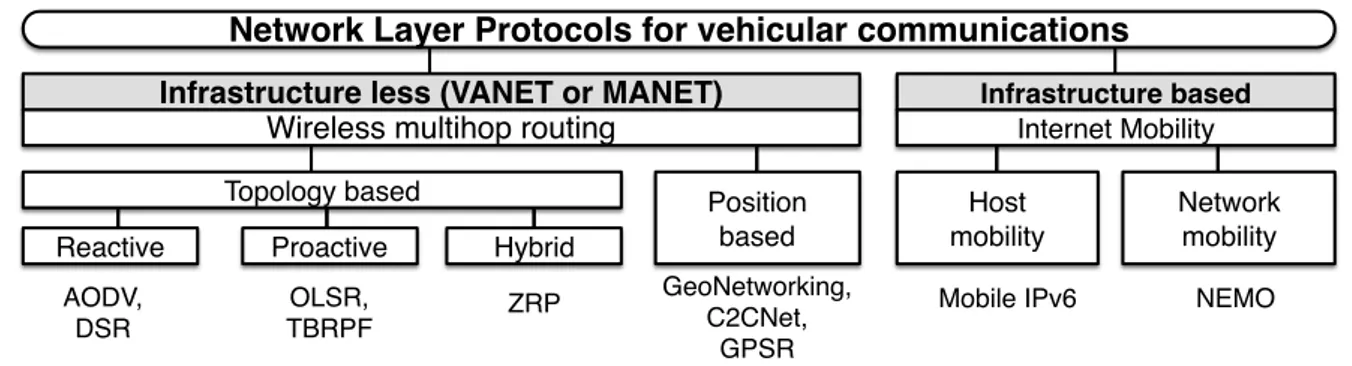
Network protocols in vehicular networks can be classified in infrastructure-less scenarios, i.e. V2V, and infrastructure-based scenarios, i.e. V2I, as showed in Figure2.
The infrastructure-less scenario is well-known in the research areas of VANET and MANET. These approaches are designed to enable wireless commu-nications in dynamic topologies without any infras-tructure. Routing protocols here are further classified as topology-based and position-based routing protocols.
Upon the appearance of vehicular communications, a second class of infrastructure-less protocols added to the list: VANETs. Most of the VANET solutions are based on geographical routing, thus based on the node’s position.
Topology-based protocols were divided into two main branches by the IETF MANET working group:reactive,
where nodes periodically exchange messages to create routes, and proactive, in which control messages are
exchanged on demand when it is necessary to reach a particular node. Generally, proactive protocols have the advantage of starting communication rapidly by making the routing table ahead, however, this makes battery life shorter due to frequent signaling. If the topology is highly dynamic and the data traffic is frequent, a proactive protocol could be better. Reactive protocols, on the contrary, keep the battery life longer by reducing signaling messages when there is no data to transmit. Thehybrid protocols that take the advantage
of both proactive and reactive protocols by maintaining routes to near neighbors regularly and searching the destination in long distance on demand.
Some routing protocols are specified by the IETF MANET working group [8]. Both IPv4 and IPv6 are supported in the working group. Ad hoc On-Demand Distance Vector Routing (AODV) [9] and Dynamic Source Routing Protocol (DSR) [10] are specified as reactive routing protocols. And Optimized Link State Routing (OLSR) [11] and Topology Dissemination Based on Reverse-Path Forwarding (TBRPF) [12] are specified as proactive routing protocols. As an example of a hybrid MANET protocol, Zone Routing Protocol (ZRP) [13] is proposed.
VANETs are a particular case of MANETs, and are not restricted by the battery of the communication nodes and are also characterized by the high speed of nodes, the availability of GPS information, and a regular distribution and foreseeable movements. First, vehicles have a larger battery than mobile terminals or sensor devices, which is also charged when the engine is running. Second, the speed of vehicles is also higher than common portable terminals, and relative speeds can reach 300 Km/h; hence, the duration of the routing entries is extremely short. Third, a GPS
device and digital map can be assumed in many cases, whose information improves the network performance in some proposals.
Unlike topology based routing, position based routing does not need to maintain part of the network structure in order to forward packets towards the destination node. When the routing is based on the position, nodes forward the packets with the aim of reaching the nodes within a geographical location. Thus, position based routing can eliminate the problem that appears in topology based protocols when routes become quickly unavailable in high mobility scenarios. In Greedy Perimeter Stateless Routing (GPSR) [14], for instance, intermediate nodes make a decision based on the destination position and neighbor positions. The Car-to-Car Communication Consortium (C2CC) also specified the C2CNet protocol, which was later enhanced by the GeoNet project to support IPv6. Within the ITS standardization domain, GeoNetworking [15] is being completed by ETSI at the moment, integrating several geo-aware strategies to better route packets in vehicular networks.
On the other side, infrastructure-based protocols have been focused on the global connectivity of nodes to the Internet. Mobile IPv6 [16] solved the mobility problem for mobile hosts and, later, Network Mobility Basic support (NEMO) [17] provided a solution for the mobility of a whole network (e.g. a vehicle or bus), which has been recommended by the ISO TC204 WG16 to achieve Internet mobility for vehicles. NEMO maintains a bi-directional tunnel between the router in the vehicle, known as themobile router (MR), and a
server in the fixed infrastructure, known as the home agent (HA), in order to provide a unchanged network
prefix called mobile network prefix (MNP) to the
in-vehicle network. All the in-in-vehicle nodes calledmobile network nodes (MNN) maintain a permanent address
derived from the MNP even when MR changes the point of attachment to the Internet during the movement (i.e. handover).
3. Experimental evaluation of VANET approaches
in the literature
Because of equipment cost, logistic issues and, in general, the necessary effort, literature in experimental evaluation of vehicular network architectures is limited. However, these works are of key importance for the ITS community. Up to now, there are several works dealing with this issue, although most of them are still focused on studying the operation of WiFi, DSRC (Dedicated Short Range Communications) or IEEE 802.11p technologies in the vehicular field.
Communication between a vehicle and a static terminal is important for some ITS services. In [18] a communication scenario considering a static terminal
AODV, DSR OLSR, TBRPF ZRP GeoNetworking, C2CNet, GPSR
Mobile IPv6 NEMO
Network Layer Protocols for vehicular communications
Topology based Position
based Reactive Proactive Hybrid
Internet Mobility Network
mobility Host
mobility
Wireless multihop routing
Infrastructure based
Infrastructure less (VANET or MANET)
Figure 2. Network protocols in vehicular networks
and a moving vehicle is studied in detail. Among all metrics considered in this work, the transmission power is the more original one, determining the maximum communication range. The type of data traffic used to test the performance of the communication channel is also of interest. Most VANET designs use UDP packets, due to poor TCP performance over wireless channels [19, 20]. The evaluations performed in [21] with IEEE 802.11p reveal that the packet delivery ratio achieved by this technology is highly dependent on the distance between sender and receiver. These results are also confirmed in [22], where it is also concluded that the vehicle speed does not imply a noticeable performance degradation of the communication. A similar evaluation is performed in [23], but this time carrying out a great testing campaign in a city.
When V2V scenarios are considered, most of the previous works only consider two terminals in performance tests, what is not too representative when multi-hop schemes are evaluated. In [24], the applicability of 802.11b in V2V communications is evaluated over urban and highway scenarios, and it is demonstrated that a direct line of sight is one of the most important issues in the network performance. Two works evaluate a multi-hop VANET over real conditions, using three [25] and even six vehicles [26]. These papers offer a wide study about a real VANET set-up, and the last one includes an interesting analysis describing the impact of the number of hops on the final performance. Nonetheless, static routes are used in that work, presenting a non-realistic vehicular network. Our prior work [27], by contrast, considered a real and standardized ad-hoc routing protocol to dynamically modify communication paths. The hardware testbed presented is also suited for future ITS research, with a flexible in-vehicle and inter-vehicle IPv6 network based on mobile routers.
To the best of our knowledge, there exists a few works dealing with the evaluation of IPv6-based communications at network level in vehicular
communications, and some of them are within our research line [28, 29]. However, our prior evaluations are only focused on IPv6 network mobility. In this work, the operation of NEMO over a V2V protocol is evaluated, using an implementation of GeoNetworking. This way, an integrated V2V and V2I approach is considered for providing an integral vehicular connectivity using IETF and ETSI standardized protocols. The novelty of this work is twofold, since not only this routing approach is experimentally analyzed, but also an evaluation tool especially designed for vehicular networks is used. As far as the authors know, no specific tools for assessing the performance of vehicular networks have been developed or used in previous research works.
4. VANET evaluation: issues and requirements
4.1. Issues
As said above, the experimental evaluations carried out in vehicular networks are mostly based on single-hop studies. In the case of multi-hop experiments, a static route configuration is often employed, but dynamic routing presents a more realistic view in vehicular communications.
Using multi-hop and dynamic routing strategies presents a challenge in the evaluation of vehicular networks. Common end-to-end evaluation tools such as
ping6 and iperf are useless to track the effect of route
change, because they are unaware of the path taken during a communication test. An additional lack of these tools is the possibility to measure the performance of hop-by-hop links, since the study is carried out end-to-end. Also, geographical and external factors such as nodes position, distance between nodes or obstacles are not linked with network performance figures of merit. Therefore, the performance comparison of various dynamic routing protocols is essentially missing.
4.2. Requirements
With the aim of summarizing these main requirements when evaluating multi-hop vehicular networks, the next needs are found essential by the software tools used in experimental campaigns for evaluating both V2V and V2I:
Path detection. The topology and communication path of a vehicular network changes frequently with dynamic routing as vehicles move. Thus, the tool should take note of the communication path used in every moment.
Communication performance in links. The communication performance between ends is the sum of the links on the way between them. Once the communication path is tracked, the tool should measure the performance link by link as well as end-to-end.
Geographical awareness. The network performance in a link depends on various geographical factors. For example, the distance between the nodes affects the packet loss probability of the link; the movement speed and the direction are also important factors for the packet loss in the link; and the existence of obstacles between the nodes may screen the wireless radio propagation. Thus, the evaluation tool should take the above geographical factors into account.
Intuitive visualization. It is important to visualize the geographical factors such as node movement (speed, direction), distance and signal obstacles in order to analyze which of them affect the network performance. For intuitive visualization, performance figures of merit and environmental information should be shown together in a synchronized way. Moreover, the spatio-temporal data series should be available in post process to play them at different speeds, stop when desired, or replayed freely as he or she wants.
Independence from network protocols. As shown in Section2, there are many network layer protocols in the literature for vehicular scenarios, both infrastructure-less and infrastructure based. The evaluation tool should be independent from the network protocols employed in the target vehicular network. This includes that the tool does not require changes to adapt to neither specific protocols nor special message or data transported.
Independent from devices. Depending on the experiment, the configuration of the used devices may differ in both vehicle and infrastructure sides. The devices include the antenna, wireless chipset, CPU, memory, GPS and so on. The tools should not rely on any of the specific devices functionalities. Most favorably, the same software and settings for an experimental test should work on multiple devices.
Adaptation to various scenarios. There are a number of possible networking scenarios in vehicular communica-tions, such as using parked vehicles, slow speeds with surrounding buildings in a urban situation, vehicles moving at higher speeds in a highway, overtaking, vehi-cles crossing in a two-way road, different topological locations of the ends in a V2I setting, etc. The software evaluation tool should accommodate to all of these scenarios.
Easiness for data collection. In order to compare the network performance obtained when using different network protocols, a lot of experiments could be needed. This may require installing data collector software on many devices, depending on the scenario. Thus, the easiness of the installation of these software modules is very important. Of course, the most favorable case is to employ common software in all of them, such astcpdump or cat.
Flexible experimental data format. The experimental data should be stored in a well-organized way. Therefore, the data format needs to be flexible for future extension. For example, the user of the system could require adding new attributes to the data format of evaluation results. We must consider flexible data formats in order not to impact the process of adding new attributes.
5. Evaluation methodology
As it is later described, the evaluation tool presented in this work (AnaVANET) copes with the previous requirements, but first it is important to identify a generic testing methodology that allow a researcher to success in a testing campaign with a vehicular network. In general, the evaluation goals in computer networks are to analyze whichtesting conditions affect which data flows or network protocols. For achieving this end it is
necessary to design a proper evaluation methodology. Within it, we should consider the tendency of results by repeating tests with the same settings or varying parameters under study, such as the network protocol, the mobility of nodes or the data volume. A proper evaluation tool, such as the later presented AnaVANET, should support the overall analysis. This section considers both the testing conditions and the possible routing protocols to consider in vehicular networks, as it is summarized in Figure 3, by introducing the concept and presenting our real use case for testing the performance of NEMO over IPv6 GeoNetworking.
5.1. Testing conditions
Testbed platform. The testbed used for the evaluation of network architecture should be carefully chosen to implement most relevant nodes in real software and hardware. In vehicular communications, this is
Distance Static Urban Highway
Packet size, Send rate
TCP window size, Max segment size
Packet size, send interval Testing Scenarios
Data Flows
Hardware (CPU, Memory), Antenna, Wireless setting(frequency, data rate) Testbed platform
Performance Indicators
AnaVANET
PDR, throughput, Jitter,
Hop count Throughput
RTT, PDR, Hop count Infrastructure-based Infrastructure less
(NEMO) (OLSR / C2CNet / IPv6 GeoNetworking)
T
esting
Conditions
Target Network Protocols (Examples)
Number of Vehicles
UDP TCP ICMPv6
Figure 3. Evaluation methodology
extremely important, since a good deployment could be needed in case of testing V2V multi-hop networks.
In our particular case, the testbed comprises a set of four vehicles and two roadside stations, as illustrated in Figure4. Each vehicle is equipped with a mobile router (MR), with at least two interfaces: an Ethernet link to connect mobile network nodes (MNNs) within the in-vehicle network, and a wireless adapter in ad-hoc mode used for both V2V and V2I communications. On the roadside, access routers (ARs) are fixed on the top of a building or any other elevated point near the road. Each one provides two interfaces: an Ethernet link for a wired Internet access, and a wireless adapter in ad-hoc mode to connect with vehicles in the surroundings. At a backend point on the Internet, a home agent (HA) is installed to support Internet mobility of MRs by using NEMO.
Among the various testbed conditions, the hardware specifications (CPU, memory, etc), antenna and wireless settings are important factors for the evaluation, since they will highly affect the results. In our case, MRs are Alix3d3 embedded boxes provided with a Linux 2.6.29.6 kernel. Each MR has a mini-pci wireless card Atheros AR5414 802.11 a/b/g Rev 0, and an antenna 2.4GHz 9dBi indoor OMNI RP-SMA6 is used. The frequency used has been 2.422Ghz and the data rate has been fixed to 6 Mbits/s.
Testing scenarios. Fixing the evaluation scenarios beforehand is essential in the planning of a testing campaign. In general, the main factors that determine the possible scenarios are:
Mobility Vehicle mobility is a key issue to cope with realistic vehicular network conditions. This way, we can consider not only static scenarios, to test the network operation in a controlled way, but also dynamic scenarios under common speed situations. Of course, field operational tests
Wireless Wireless MR1 MNN1 cable MR2 MNN2 cable MR3 MR4 Vehicular Network Infrastructure Network AR1 AR2 IPv6 Internet HA1
Figure 4. Reference network configuration
should be conducted to confirm the expected results, taking into account the proper handling of mobility, i.e. Doppler shifting, fast fading, etc. Location Urban and interurban environments affect
communication performance in a different way, because the signal propagation can be interfered by buildings (among other elements), and the line of sight between vehicles is not always possible. Two environments are considered in our tests: a semi-urban one located at INRIA-Rocquencourt, which contains a set of small buildings surrounded by streets, and a highway stretch, the A-12 one, near INRIA-Rocquencourt. Number of vehicles The number of hops between the
source and the destination vehicles affect the communication delay and the higher probability of packet looses, due to route changes or MAC transmission issues. Up to four conventional
vehicles (Citroën C3) are considered in our case. This testing fleet is showed in Figure5.
Figure 5. Testing vehicles
A set of possible testing scenarios when evaluating multi-hop vehicular networks is summarized in Fig-ure6. These have been divided into urban and highway. Mobility has been set to static, urban-like speed and high speed. In our particular evaluation, these scenarios have been considered with our fleet of vehicles, with the aim of covering a wide range of communication conditions. The obstacles have been in our case a set of building blocks located at the Paris - Rocquencourt premises. The chosen highway has been the French A13, near Versalles. Distance Static Urban Highway parked ~10km/h Obstacle Obstacle parked parked parked parked packet ~100km/h ~100km/h ~100km/h Obstacle ~30km/h ~30km/h ~30km/h
Figure 6. Proposal of movement scenarios
5.2. Data flows and performance indicators
A number or protocols and data flows can be set for evaluations, however, only the most representative and more used in the literature should be considered to study concrete performance indicators. For instance, in our case UDP, TCP and ICMPv6 are used to measure the network performance between two communication end-nodes (MNN to MNN) mounted within two vehicles:
UDP is a connection-less unidirectional transmission flow. The traffic is generated by iperf in our case. It is considered that with UDP the performance indicators under consideration can be the packet delivery ratio, throughput and jitter.
TCP is a connection-oriented bidirectional transmis-sion flow. This traffic is also generated by iperf in our case. The performance indicator under con-sideration here has been the maximum through-put.
ICMPv6 is a bi-directional transmission flow. The traffic is generated by ping6 in our case. The performance indicator under consideration can be the road trip delay time and packet deliveries. The set of performance indicators most used in the literature are detailed next:
Round-Trip Time (RTT) can be measured using ICMPv6, as in our case. A host on the source vehicle, or located at an infrastructure point, sends ICMPv6 echo request to a host on the destination vehicle, or located at an infrastructure point. The destination host replies with an ICMPv6 echo reply. The period between the time that the request is sent and the time that the reply is received can be obtained by using ping6. Throughput can be measured using UDP or TCP. It can
be measured with a traffic generator tool, such as theiperf tool in our case. In UDP, iperf is executed
in both the sender and the receiver nodes. The UDP packet transmission rate is set with a fixed rate and the sender is not able to see the result because the communication is unidirectional from the sender to the receiver. The throughput is shown on the receiver side. On the other hand, when using a TCP transmission, the sending rate is automatically adjusted with the TCP congestion control mechanism. The sending rate is adjusted depending on the acknowledgement messages received. The throughput appears in both the sender and receiver nodes.
Jitter is a measure of the variability over time of the packet latency across a network. A network with a constant latency has a null jitter. In general, the jitter is expressed as an average of the deviation from the network mean latency, and can be calculated using the RTT, as in our case.
Packet Delivery Ratio (PDR) is the percentage of packets received by the target node as compared with the number of packets sent by the source. iperf, for instance, shows this value at the receiver side when using TCP in an end-to-end manner, but AnaVANET is also able to calculate the PDR
on each hop between the sender and destination nodes.
6. System design and implementation of
AnaVANET
6.1. Overview of the software
AnaVANET (initially standing for Analyzer of VANET) is an evaluation tool implemented in Java to assess the performance of vehicular networks. It takes as input the logs generated by the iperf, tcpdump and/or ping6, together with navigation information in NMEA
format, to compute the next performance metrics: network throughput, delay, jitter, hop count and list of intermediate nodes in the communication path, PDR end-to-end and hop-by-hop, speed, and instantaneous position.
In this part of the work AnaVANET is put in the context of the evaluation scenario described in the previous section in Figure 7, showing also the main inputs and outputs of the tool. The sender MNN (left most vehicle) is in charge of generating data traffic, and both the sender and the receiver (right most vehicle) MNNs record a high level log, according to the application used to generate network traffic (iperf andping6 for the moment). All MRs record information
about forwarded data packets by means of thetcpdump
tool, and log the vehicle position continuously. All this data is post-processed by the AnaVANET core software and then analyzed. The tool traces all the data packets transmitted from the sender node to detect packet losses and calculate statistics for each link and end-to-end, and then merge all these per-hop information with transport level statistics of the traffic generator. As a result, AnaVANET outputs a JSON file with statistics on a one-second basis (see Section6.2 for details), and a packet trace file with the path followed by each data packet.
Once generated, performance metrics can be graph-ically showed through plots generated by gnuplot and
a website where all tests are available. The screenshot of the website is shown on the left bottom corner of Figure 7 (which is also enlarged in the previous Figure 1). Accessing the website one can replay the tests on a map to see momentary figures of merit. Previous experiments can be chosen to monitor the main performance metrics at any time of the tests. Users can play and stop at any arbitrary point of the test with the control buttons on the upper left part of the window. The player speed, one step forward and one step backward are also implemented. On the map, the position and movement of the vehicle are depicted with the speed of each vehicle and the distance between them. The transferred data size, bandwidth, packet loss rate, RTT and jitter, for each link and end-to-end are
displayed. The network performance is visualized by the width of links and the colors used to draw them.
6.2. Data format of experimental results
In this part, we describe the problems of the former AnaVANET data format [30], which was based on XML, and we detail the recent changes to improve the flexibility of the results using the JSON format [31].
There is a fundamental trade-off between flat data format and structured data format. Flat data format is more flexible than structured one, because if developers want to add a new attribute, they just put the attribute next to the other attributes. On the other hand, in a structured format, developers have to consider the layers and relationships to add a new attribute and they sometimes cannot add the new attribute because of its structure. However, when a flat data format is used, developers have to revise and adjust their applications, since the relationships among attributes can vary. In this line, a normalized way of calling the attributes is also important. If there is no rule of normalization, developers have to handle differences of an attribute name (e.g., temperature, Temperature, temp).
AnaVANET was initially developed to analyze the real operation of VANETs. The initial data format used as output of an evaluation had some problems regarding its flat format and the dynamic columns available per each data record. Hence it took several hours to check the results after carrying out new experiments. To solve these problems, we have designed a structured and normalized format, considering the features of vehicular networks. Our format is extensible and independent from concrete experimental environments and visualization tools. We have also adapted the initial visualization tool with an internal converter module within the web application, and an additional command line tool has been implemented to process the output logs of AnaVANET in a text-based basis. The new data format and tools enable us to check the results in several seconds after carrying out experiments, considering that users could require a fast evaluation to continue with new experiments.
The new structured and normalized data format of AnaVANET considers three layers, as it is shown in Figure 8. AnaVANET summarizes data on each time slot following the next scheme. The top layer is the “experiment” layer. This layer mainly manages static attributes (e.g. ID of experiment or the name of experiment). The second layer is the “data” layer. This layer manages results of an experiment on each time slot. This layer has time, total packet delivery ratio (PDR), total RTT and other attributes. The third layer is comprised by the “node” and “link” parts. The node part manages each node’s statuses, whereas the link part
MNN1 (Sender)
MNN2 (Receiver)
MR1 MR4 MR2
Cable Wireless Wireless Cable
UDP / ICMPv6 traffic generation iperf / ping6 log tcpdump log GPS log tcpdump log GPS log tcpdump log GPS log iperf log
AnaVANET
(optional) (optional) JSON statistics Packet traceGnuplot
Web font-end (Google maps) AnaVANET Web viewerGraphs http://anavanet.net/ MR3 tcpdump log GPS log Wireless
Figure 7. Overview of AnaVANET
manages each link’s statuses. Link means a relationship between two nodes and especially represents wireless link statuses. An experiment has a series of data and each data has several nodes and links. We have also normalized the names of the attributes considered in each layer.
This data format based on time-series for saving node and link information is an abstracted representation that can be used to collect results from any kind of network. Moreover, by using this three-layer representation, the system can be easily adapted to future requirements.
7. Evaluation of NEMO over IPv6 GeoNetworking
Early versions of AnaVANET were designed for evaluating infrastructure less network protocols, as used in our previous works for analyzing OLSR in vehicular environments [32] and later tests of IPv6 over C2CNet [33] in the FP7 GeoNet project. The current version of AnaVANET can also analyze infrastructure-based network protocols such as NEMO.
In this section, we report a summary of the results collected in the evaluation of NEMO over IPv6 GeoNetworking when a vehicle connects with a node located in the Internet using two roadside units as access routers. Theumip.org2implementation of NEMO is used, whereas the cargeo6.org3 software is used for
2http://umip.org 3http://www.cargeo6.org { "exp_id":1303883952, "name":"[ICMP] 27/4/2011 5:59:12”, "exp_type":"ICMP”, "timezone":9, "data":[ {"time":1303883952, "jitter":0, "bandwidth":0, "bytes":64, "rtt":3.78, "req_pdr":0, "nodes":[ { "node_id":"MR1”, “lat”:34.73193383216858, “lng”:135.73369348049164, “speed”:1.433448 }, {"node_id":"MR2”, “lat”:34.731985330581665, “lng”:135.73398900032043, “speed”:0.40373600000004 }, {} ], [] "links":[ {"src":"MR1”, "dest":“MR2”, “name”:"MR1_MR2”, “distance”:27.639465545, “req_pdr”:1.0, “res_pdr”:1.0 }, {} ], [] ], [] } Experiment exp_id, name, exp_time, …
data time, jitter, bandwidth, ….
data data data node node_id, lat, lng, … node node link src, dest, name, …. link data
Figure 8. Three-layer model of the structured data format used
by AnaVANET
IPv6 GeoNetworking. ICMPv6 and UDP evaluations in handover scenarios were performed at INRIA Paris-Rocquencourt campus with the two ARs previously presented in the testbed description. The speed of the
vehicle was limited to less than 15 km/h, like in a low speed urban scenario.
The reader can directly click in from Figure 9 to Figure 12 to see the correspondent results in the AnaVANET web viewer, to further perceive the details of the gathered results.
7.1. ICMP evaluation in a handover scenario
ICMPv6 echo requests (64 bytes) are sent from the MNN to a common computer located in the wired network twice a second, which replies with ICMPv6 echo replies. The results collected in the ICMPv6 tests are plotted in Figure 9. The lower part shows the itinerary of the vehicle and the locations of AR1 and AR2 on the map, whereas the upper part shows the RTT, the packet loss and the result of the mobility signaling. The X-axis and the Y-axis of the upper part are the latitude/longitude of the vehicle, corresponding to the road stretch indicated in the lower part of the figure. When either the request or the reply is lost, the RTT is marked with a zero value and, at the same time, a packet loss is indicated. A binding registration success is plotted when the NEMO binding update (BU) and the corresponding binding acknowledgment (BA) are successfully processed. On the contrary, if either of them is lost, a binding registration fail is plotted at the position.
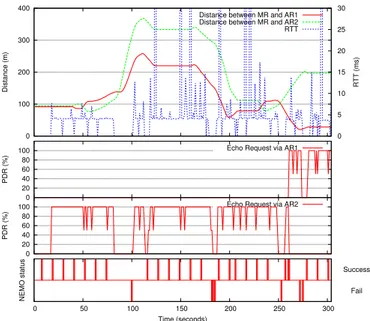
Figure 10 shows the same result of the test, but referred to the test time. The upper graph shows the RTT and the distance to the two ARs; the middle one shows the PDR obtained with the two ARs; and, finally, the lower plot shows the status of the NEMO signaling. A NEMO success means that the binding registration has been successfully performed, and a fail indicates that either the BU or the BA has been lost.
As can be seen in Figure 9 and Figure10, the RTT is stable at the beginning of the test near AR2, with a value of around five milliseconds. AR2 is installed at about 100 meters away the road. It sends constant BU messages and, consequently, the MR successfully performs the binding registration every twelve seconds, without any packet loss. Soon, after the vehicle turns the first corner (north west of the square), packets start to be dropped until the second corner. This is because a near building screens the wireless radio. The binding signaling is dropped as well in the period. Then it recovers when the vehicle comes to the straight road on the south. The mobility signaling is successfully sent again with a regular interval.
The lower straight road of the stretch is less stable than the one on the north, because of two reasons. First, the location of the south straight road is 250 meters further to AR2 than the one on the north. Thus the signal strength is weaker now. Second, the trees at this location interfere the wireless radio, especially at the
AR2 AR1 MR 0 20 40 60 80 100 RTT (ms) RTT Packet loss Binding registration Success Binding registration Fail
RTT (ms)
Figure 9. Map-based RTT, packet losses and mobility signaling
in an ICMP evaluation under a handover scenario
0 50 100 150 200 250 300 NEMO status Time (seconds) Fail Success 0 20 40 60 80 100 PDR (%)
Echo Request via AR2 0 20 40 60 80 100 PDR (%)
Echo Request via AR1 0 100 200 300 400 0 5 10 15 20 25 30 Distance (m) RTT (ms)
Distance between MR and AR1 Distance between MR and AR2 RTT
Figure 10. RTT, packet looses and mobility signaling in an ICMP
evaluation under a handover scenario
end of this part of the circuit, as can be seen with the three consecutive binding registration fails. When the MR fails to receive a valid matching response within the selected initial retransmission interval, the MR should retransmit the message until a response is received. The retransmission by the MR must use an exponential back-off in which the timeout period is doubled upon each retransmission, until either the MR receives a
response or the timeout period reaches the value of maximum timeout period as specified in [16]. In our particular case the mobility daemon tries to deliver the BU one second after the first failure of the binding. Then, when it fails, it increases the retransmission time in two, four, eight seconds, and so on.
The performance in the final part of the testing circuit is more stable, and no binding messages are lost. In this period the vehicle approaches AR2 and then leaves it turning right at the end of the test.
The MR starts receiving router advertisement (RA) messages from AR1 when the distance to AR1 is 50 meters, however, the RA messages from AR2 also reaches the zone. As the result, the vehicle triggers the movement detection, and sends the mobility signaling via the AR where it receives the RA. When the MR associates with AR2 some ICMP packets and mobility signaling messages are lost because of the distance and a near building. When the MR later switches to AR1, the packets are more stably transmitted.
7.2. UDP evaluation in a handover scenario
The results collected in the UDP tests are plotted in Figure11. UDP packets are sent from the MNN to the wired node at a rate of 1 Mbps and a length of 1250 bytes. The lower part of the figure shows the itinerary of the vehicle, and the upper part corresponds to the PDR obtained with the ARs and the binding registration results, as in the previous case. The road stretch is the same one used above, but the vehicle moves on the contrary direction in this case.
Figure12shows the time-mapped results of the same UDP test. The upper graph shows the UDP throughput from the MNN to the wired node, the middle part shows the PDR to the two ARs, and the lower plot includes the status of the NEMO signaling.
The throughput of the UDP traffic is below 30% of the sending rate of 1Mbps (i.e. 300Kbps), however the
PDR with the two ARs reaches 100%. This is because the throughput is measured between end nodes (MNN and a node in the Internet) byiperf and the PDR in the
wireless links are calculated hop-by-hop by AnaVANET. In this case, it shows that more than 70% of the UDP packets are dropped outside the wireless links. In fact, the CarGeo6 software experimented a bottleneck in the processing of so many UDP packets at that time. This also explains the phenomenon where the binding registration messages are lost while none of the UDP packets are lost (this can be seen in the straight road in the south part of the circuit). In this case, the BUs are lost in the CarGeo6 software and are not transmitted from the wireless interface. We can detect where a packet is lost, especially the loss in a wireless link, thanks to the AnaVANET system (although the cause of the packet losses was not in the wireless links in the
AR2 AR1 MR 0 20 40 60 80 100 PDR (%) PDR to AR1 PDR to AR2 Binding registration Success Binding registration Fail
PDR (%)
Figure 11. Map-based PDR of UDP evaluation using NEMO
over IPv6 GeoNetworking
0 20 40 60 80 100 120 140 160 180 NEMO status Time (seconds) Fail Success 0 20 40 60 80 100 PDR (%) PDR to AR2 0 20 40 60 80 100 PDR (%) PDR to AR1 0 100 200 300 400 0 100 200 300 400 500 Distance (m) Throughput (Kbits/sec)
Distance between MR and AR1 Distance between MR and AR2 Throughput
Figure 12. PDR of UDP evaluation using NEMO over IPv6
GeoNetworking
present case). This is because AnaVANET is capable of measuring both the hop-by-hop network performance and the end-to-end one.
As can be seen in Figure 11, AR2 is available most of the test period (especially, around the square) except for the end of the test. When the vehicle moves in the first straight road in the east, the PDR to AR2 is almost 100%. During this period, no binding message
is dropped. The BUs are sent regularly at intervals of twelve seconds.
The packets start being dropped on the west of the square because the building on the north west corner of the square blocks the wireless radio. When the beacons exchanged between GeoNetworking nodes twice in a second are dropped, the correspondent entry of the location table expires in five seconds.
As can be seen in Figure 12, after the southwest corner, the end-to-end throughput drops to zero and the binding registration fails, while the hop-by-hop PDR to AR2 is still almost 100%. This shows that the mobility signaling packets are lost in CarGeo6 as explained earlier. Since the binding life time is configured as 24 seconds, the binding entry in the HA expires 24 seconds after the last successful binding registration. After the expiration of the binding, HA discards all the packet from the MR. During the period, the MR try to send the BUs in exponentially increased interval from 1 second to 32 seconds (1, 2, 4, 8, 16 and 32 seconds).
Then, at time 139 seconds, when the vehicle is 20 meters away from AR1, the first binding registration through AR1 successes. UDP packets are switched to AR1 from this moment. Then at time 155 seconds, the binding registration is successfully performed via AR2 again. During the handover from AR1 to AR2, from time 155 seconds to time 158 seconds, three seconds of disconnection are present in the iperf log. At time 166 seconds, the path to the Internet is switched to AR1 again. In this handover, UDP packets are lost during four seconds from time 166 seconds.
8. Qualitative evaluation of the system
As a result of the experience working with the recent version of AnaVANET, including the results presented above, we have revisited the requirements for an efficient testing environment in vehicular networks detailed in Section 4, with the aim of evaluating the advantages of the system. Table1summarizes the most important features, which demonstrate that AnaVANET fulfills the most important requirements and it is an efficient evaluation tool.
9. Conclusions and future work
The paper has presented the peculiarities of evaluating vehicular networks experimentally, through presenting the most used protocols and detailing the needs of the software tools to be used for this task. After that, the importance of the testing methodology is described, and a reference design of a vehicular network evaluation is used to exemplify it. The testbed design and implementation, testing scenarios, routing protocols and data flows, are found essential to be fixed beforehand to avoid improvisation during the testing campaign. The AnaVANET platform is then presented
Requirement Proposal
Path detection AnaVANET can track the nodes of the communication path for each transmission
Communication performance in links
The system can measure the PDR of each link as well as the end-to-end PDR
Geographical awareness
The system outputs the performance indicators in a geo-referenced way, which facilitates the analysis of results
Intuitive visualization
The movement of vehicles is showed using Google Maps in a Web
application, together with the graphs of the desired performance metrics. It allows a step-by-step visual analysis of the results. Independence
from network protocols
The system adopts the MAC address for packet tracing. Therefore any kind of network layer protocol can be evaluated.
Independent from devices
The system does not require specific hardware.
Adaptation to various scenarios
The system can be used in a number of scenarios, including distance, static, urban and highway tests. Also it allows both V2V and V2I tests. Easiness for data
collection
The system does not require special software to gather experimental data. Packet dumps are taken with
tcpdump, and GPS NMEA data is obtained directly from a serial interface, to finally generate results. Flexible
experimental data format
We have adopted a structured and normalized format defining a three-layer model in order to increase the flexibility for future extension.
Table 1. Qualitative evaluation of the system
as an efficient evaluation software to process the data gathered by common testing tools, and then generate lots of performance indicators of the trials. All of these performance parameters are put in the spatio-temporal context, through the collection and correlation of GPS information, and most important figures of merit can be exported in the form of graphics or showed interactively in a web front-end.
The capabilities of AnaVANET are exploited in a novel evaluation of NEMO over IPv6 GeoNetworking, using the tool to gather RTT, PDR and channel throughput information. The results reveal that mobile IPv6 connectivity can be maintained in a V2I case using
GeoNetworking over WiFi to pass NEMO IPv6 traffic between vehicles and infrastructure.
Our future work includes, first, a link layer extension of the system to analyze the channel quality (RSSI) and load ratio. This data will allow the development of coverage maps for the communication nodes. Second, it is considered the support for multicast data flows, since it is essential for the dissemination of events in vehicular networks. Third, we plan to evaluate a real application developed for cooperative ITS.
Acknowledgment
This work has been sponsored by the European 7th FP, through the ITSSv6 (contract 270519), FOTsis (contract 270447) and GEN6 (contract 297239) projects, and the Spanish Ministry of Science and Innovation, through the Walkie-Talkie project (TIN2011-27543-C03).
References
[1] Action plan for the deployment of Intelligent Transport Systems in Europe, December 2008. COM(2008) 886 final.
[2] Standardisation mandate addressed to CEN, CENELEC and ETSI in the field of information and communication technologies to support the interoperability of co-operative systems for intelligent transport in the european community, October 2009.
[3] ISO 21217:2010 Intelligent transport systems – Commu-nications access for land mobiles (CALM) – Architecture, April 2010.
[4] Intelligent Transport Systems (ITS); Communications Architecture, September 2010. ETSI EN 302 665 V1.1.1 (2010-09).
[5] C. Tschudin, H. Lundgren, and E. Nordstrom. Embed-ding MANETs in the real world.Lecture notes in computer science, 2775(1):578–589, September 2003.
[6] T. Ernst, M. Goleva, I. Ben Jemaa, A. Kovacs, H. Menouar, C. Noguchi, S. Schulze, M. Tsukada, P. Zhang, and W. Zhang. GeoNet STREP No.216269 Deliverable 7.1 GeoNet Experimentation Results. 2010. GeoNet-D7.1-ExperimentationResults-v1.0.
[7] J. Santa, A. Kovacs, A. Varadi, A.F. Skarmeta, P.J. Fernandez, F. Bernal, M. Tsukada, B. Cama, F. Pereniguez, R. Marin, C. Schulze, A. Fitzner, O. Shagdar, and Y. Bouchaala. ITSSv6 STREP Grant Agreement 210519 Deliverable 4.2 Final Validation & Evaluation Results. March 2014. ITSSv6-D4.2-FinalValidation&EvaluationResults-v1.1.
[8] IETF: Mobile Ad-hoc Networks (MANET) Working
Group, 1997. http://datatracker.ietf.org/wg/
manet/charter/.
[9] C. Perkins, E. Belding-Royer, and S. Das. Ad hoc On-Demand Distance Vector (AODV) Routing. RFC 3561 (Experimental), July 2003.
[10] D. Johnson, Y. Hu, and D. Maltz. The Dynamic Source Routing Protocol (DSR) for Mobile Ad Hoc Networks for IPv4. RFC 4728 (Experimental), February 2007.
[11] T. Clausen and P. Jacquet. Optimized Link State Routing Protocol (OLSR). RFC 3626 (Experimental), October 2003.
[12] R. Ogier, F. Templin, and M. Lewis. Topology Dissemi-nation Based on Reverse-Path Forwarding (TBRPF). RFC 3684 (Experimental), February 2004.
[13] Zygmunt J. Haas, Marc R. Pearlman, and Prince Samar.
The Zone Routing Protocol (ZRP) for Ad Hoc Networks, July
2002. IETF work in progress, draft-ietf-manet-zone-zrp-04.
[14] Brad Karp and H. T. Kung. Gpsr: Greedy perimeter stateless routing for wireless networks. In 6th Annual International Conference on Mobile Computing and Networking, MobiCom 2000, August 6.-11., 2000, Boston, Massachusetts, USA, pages 243–254. ACM / IEEE, August
2000.
[15] Intelligent Transport Systems (ITS); Vehicular Commu-nications; Part 4: Geographical Addressing and Forward-ing for Point-to-Point and Point-to-Multipoint Commu-nications; Sub-part 1: Media-Independent Functionality, June 2011. ETSI TS 102 636-4-1 V1.1.1 (2011-06). [16] C. Perkins, D. Johnson, and J. Arkko. Mobility Support
in IPv6. RFC 6275 (Proposed Standard), July 2011. [17] V. Devarapalli, R. Wakikawa, A. Petrescu, and P. Thubert.
Network Mobility (NEMO) Basic Support Protocol. RFC 3963 (Proposed Standard), January 2005.
[18] C. Wewetzer, M. Caliskan, K. Meier, and A. Luebke. Experimental evaluation of umts and wireless lan for inter-vehicle communication. InProc. 7th International Conference on ITS Telecommunications ITST ’07, pages 1–
6, 6–8 June 2007.
[19] F. Hui and P. Mohapatra. Experimental characterization of multi-hop communications in vehicular ad hoc network. In ACM international workshop on Vehicular ad hoc networks, pages 85–86, Cologne, Germany,
September 2005.
[20] A. Festag, H. Fußler, H. Hartenstein, A. Sarma,
and R. Schmitz. FLEETNET: BRINGING
CAR-TO-CAR COMMUNICATION INTO THE REAL WORLD.
Computer, 4(L15):16, 2004.
[21] Oyunchimeg Shagdar, Manabu Tsukada, Masatoshi Kakiuchi, Thouraya Toukabri, and Thierry Ernst. Experimentation Towards IPv6 over IEEE 802.11p with ITS Station Architecture. In International Workshop on IPv6-based Vehicular Networks (colocated with IEEE Intelligent Vehicles Symposium), Alcala de Henares, Spain,
June 2012.
[22] Jia-Chin Lin, Chi-Sheng Lin, Chih-Neng Liang, and Bo-Chiuan Chen. Wireless communication performance
based on IEEE 802.11p R2V field trials. IEEE
Communications Magazine, 50(5):184 –191, may 2012.
[23] J. Gozalvez, M. Sepulcre, and R. Bauza. IEEE
802.11p vehicle to infrastructure communications in urban environments. IEEE Communications Magazine,
50(5):176 –183, may 2012.
[24] Víctor González, Alberto Los Santos, Carolina Pinart, and Francisco Milagro. Experimental demonstration of the viability of ieee 802.11b based inter-vehicle
communications. In TridentCom 2008, pages 1–
7, ICST, Brussels, Belgium, Belgium, 2008. ICST (Institute for Computer Sciences, Social-Informatics and
Telecommunications Engineering).
[25] M. Jerbi, S. M. Senouci, and M. Al Haj. Extensive experi-mental characterization of communications in vehicular ad hoc networks within different environments. In Proc.
VTC2007-Spring Vehicular Technology Conference IEEE 65th, pages 2590–2594, 2007.
[26] M. Jerbi and S. M. Senouci. Characterizing multi-hop communication in vehicular networks. In Proc. IEEE Wireless Communications and Networking Conference WCNC 2008, pages 3309–3313, 2008.
[27] Manabu Tsukada, José Santa, Olivier Mehani, Yacine Khaled, and Thierry Ernst. Design and Experimental Evaluation of a Vehicular Network Based on NEMO and MANET. In The special issue for Vehicular Ad Hoc Networks, EURASIP Journal on Advances in Signal Processing, 2010.
[28] Jose Santa, PedroJ. Fernandez, Fernando Pereniguez, Fernando Bernal, Antonio Moragon, and AntonioF. Skarmeta. Ipv6 communication stack for deploying cooperative vehicular services. International Journal of Intelligent Transportation Systems Research, 12(2):48–60,
2014.
[29] J. Santa, F. Pereniguez-Garcia, F. Bernal, P.J. Fernandez,
R. Marin-Lopez, and A.F. Skarmeta. A framework
for supporting network continuity in vehicular ipv6 communications. Intelligent Transportation Systems Magazine, IEEE, 6(1):17–34, Spring 2014.
[30] M. Tsukada, J. Santa, S. Matsuura, T. Ernst, and K. Fujikawa. Anavanet: an experiment and visualization tool for vehicular networks. In 9th International Conference on Testbeds and Research Infrastructures for the Development of Networks & Communities (TRIDENTCOM 2014), May 2014.
[31] T. Bray. The JavaScript Object Notation (JSON) Data Interchange Format. RFC 7159 (Proposed Standard), March 2014.
[32] Jose Santa, Manabu Tsukada, Thierry Ernst, Olivier Mehani, and A. F. Gomez-Skarmeta. Assessment of vanet multi-hop routing over an experimental platform.Int. J. Internet Protoc. Technol., 4(3):158–172, September 2009.
[33] Manabu Tsukada, Ines Ben Jemaa, Hamid Menouar, Wenhui Zhang, Maria Goleva, and Thierry Ernst. Exper-imental evaluation for IPv6 over VANET geographic routing. In IWCMC ’10: Proceedings of the 6th Inter-national Wireless Communications and Mobile Computing Conference, pages 736–741, New York, NY, USA, 2010.