1
World Mycotoxin Journal, 2016; 9 (2): 149-161Comparison of approaches to deal with matrix effects in LC-MS/MS based determinations of
mycotoxins in food and feed
N. Fabregat-Cabello
1, P. Zomer
2, J.V. Sancho
1, A.F. Roig-Navarro
1and H.G.J. Mol
2*
1Research Institute for Pesticides and Water, Universitat Jaume I, 12071, Castellón, Spain
2
RIKILT Wageningen University and Research Centre, Akkermaalsbos 2, 6708 WB Wageningen, the
Netherlands; hans.mol@wur.nl
Received: 19 December 2014 / Accepted: 8 June 2015
© 2015 Wageningen Academic Publishers
RESEARCH ARTICLE
Abstract
This study deals with one of the major concerns in mycotoxin determinations: the matrix effect
related to LC-MS/ MS systems with electrospray ionization sources. To this end, in a first approach,
the matrix effect has been evaluated in two ways: monitoring the signal of a compound (added to
the mobile phase) during the entire chromatographicrun, and by classical post-extraction addition.
The study was focused on nine selected mycotoxins: aflatoxin B1, fumonisins B1, B2 and B3,
ochratoxin A, deoxynivalenol, T-2 and HT-2 toxins and zearalenone in various sample extracts giving
moderate to strong matrix effects (maize, compound feed, straw, spices). Although the permanent
monitoring of a compound provided a qualitative way of evaluating the matrix effects at each
retention time, we concluded that it was not adequate as a quantitative approach to correct for the
matrix effect. Matrix effects measured by post-extraction addition showed that the strongest ion
suppression occurred for the spices (up to -89%). Five different calibration approaches to
compensate for matrix effects were compared: multi-level external calibration using isotopically
labelled internal standards, multi-level and single level standard addition, and two ways of
singlepoint internal calibration: one point isotopic internal calibration and isotope pattern
deconvolution. In general, recoveries and precision meeting the European Union requirements could
be achieved with all approaches, with the exception of the single level standard addition at levels too
close to the concentration in the sample. When an isotopically labelled internal standard is not
available, single-level standard addition is the most efficient option.
Keywords: matrix effects, calibration, isotope dilution mass spectrometry, ion suppression, standard
addition
1. Introduction
Mycotoxins are low-molecular-weight products of the secondary metabolism of some fungi, mainly
from the genera Aspergillus, Penicillium and Fusarium, which are produced after a period of active
growth or response to stress conditions (Bennett and Klich, 2003). These fungi grow mainly in
cereals, but can also be found in fruits, spices, nuts or fodder. The interest of controlling the
presence of the mycotoxins in food and animal feeds lies in the health problems they can induce due
to their toxicity, including hepatic, gastrointestinal and carcinogenic diseases (Fung and Clark, 2004).
For this reason maximum levels for food and feed have been established by the European Union (EC,
2002, 2006a,b, 2013).
In order to be able to determine the mycotoxins at the levels required by legislation, a wide range of
analytical methods are developed each year (Berthiller et al., 2014; Shephard et al., 2013). For
2
screening and semi-quantitative analysis, various immunochemical assays have been developed,
including radio-immunoassays, enzymelinked immunosorbent assays (ELISA) and Sandwich ELISA,
chemiluminiscent and fluorescent immunoassays, and lateral flow and flow-through immunoassays.
For confirmatory and quantitative analysis, methods based on gas chromatography (GC) or
high-performance líquid chromatography (HPLC) are commonly employed. In GC analysis, typically
involving derivatisation, the mycotoxins are detected by electron capture detection, flame ionisation
or mass spectrometry (MS). In HPLC the most common detectors are ultraviolet, diode array,
fluorescence and MS (Pascale, 2009). A clear trend can be seen to develop multi-mycotoxin methods
based on liquid chromatography coupled to tandem mass spectrometry (LC-MS/MS) for the
simultaneous identification and quantification of the sought compounds (Beltran et al., 2013;
Berthiller et al., 2014).
LC-MS/MS is one of the most powerful tools for orgànic compound analysis due to its high selectivity,
sensitivity, and throughput. However, its quantitative performance can be affected by the matrix
effect, especially when an electrospray ionisation source (ESI) is used.
The matrix effect is the alteration of the ionisation efficiency of a compound, due to the presence of
substances coeluting with the target analyte (Taylor, 2005). Matrix effects can depend on source
design and therefore differ from instrument to instrument. It can cause either an enhancement or
suppression of the compound signal but the latter is more common (Furey et al., 2013).
Consequently, it is necessary to test and study the matrix effect during the development and
validation of each new method. The evaluation of the matrix effect can be performed mainly by two
approaches: by extraction addition or by postcolumn infusion (Trufelli et al., 2011). The
post-extraction addition is based on the comparison between the peak area of a standard prepared in
solvent and the area obtained after spiking an extract of a blank sample at the same concentration.
In the case of post-column infusion the target compound is added to the eluent through a T-piece
after the LC column. The signal of the target compound is monitored after injection of a blank sample
extract. Response fluctuations of the target compound reflect the matrix effect.
A wide variety of strategies can be employed in order to overcome the matrix effect (Furey et al.,
2013; Trufelli et al., 2011). The simplest possibility is a dilution of the sample extract in solvent, but
since it diminishes the amount of analyte introduced in the system, this is only a viable option when
the required limit of quantitation (LOQ) can still be achieved (Stahnke et al., 2012). In the same line, a
low injection volume combined with a high flow rate can also decrease the matrix effect. Other
options are a more exhaustive method development by the optimisation of chromatographic
separation (avoiding compounds to coelute with the target analytes), improving sample clean-up and
selective extraction. Measuring the analytes as negative ion can also reduce matrix effects. The main
drawbacks of these approaches are that the total time for method development is considerably
increased and that the method becomes less suitable for simultaneous determination of multiple
mycotoxins with different physical-chemical properties.
An alternative to the elimination of the matrix effect is compensating for it by using certain
calibration approaches. These include matrix-matched calibration, the Standard addition method, or
the use of internal standards. Matrixmatched calibration requires the availability of
noncontaminated material of the same composition as the sample and assumes that the matrix
effect for a certain product is the same for different samples from that product which is not
necessarily true (Matuszewski et al., 2003). In case different matrices are to be analysed, separate
matrixmatched calibration standards need to be prepared for each matrix. This is also the case for
standard addition approaches, but here the advantage is that no a priori knowledge of the sample
composition is required which facilitates the analyses of composite products (e.g. multiingredient
food products, compound feed).
Matrix-matched calibration using one individual model-sample is inferior to standard addition or the
internal standardisation, where the compensation isphysically performed in each sample. In case of
internal standardisation, as the use of a homologue cannot always compensate such variability,
isotope labelled internal standard (ILIS) seems a better option. Among the available labelled internal
3
standards, 13C-labelled are preferred over deuterated analogues in order to guarantee the perfect
co-elution with their natural analogue. The use of ILIS is recognised as the most efficient way to
compensate for matrix effects; however, availability and cost may límit the applicability in routine
practise (Hewavitharana, 2011). Nevertheless, it has been shown that the additional cost can be as
low as 2 euro per sample when the labels are added to a small volume of the final extract (Varga et
al., 2012). A common approach is to add the label to the sample (or extract), and to the
solvent-calibration standards. The responses are normalised to that of the label and all samples can be
quantified based on one solvent-based calibration curve. An alternative and even more
straightforward way of using the isotope labels is one-point isotopic internal calibration (OPIC) often
used as a compromise between the necessary calibration and workload (Peters and Maurer, 2007).
Here the label is added to the sample (or extract) as well but no external calibration standards are
used, i.e. the concentration in the sample is calculated based on the response of the label in that
same sample and only one injection is required for both analysis of the sample and calibration. The
isotope patern deconvolution (IPD) method also makes use of this way of calibration but using a
different quantification procedure. This alternative approach is based on the determination of the
molar fractions for each pure isotope pattern (natural abundance or labeled) contributing to the
isotope patern observed in the mixture (spiked sample) by multiple linear regression in which a least
square fitting can be applied. A simple equation is employed for the determination of the
concentration of the analyte as the ratio of molar fractions is equal to the ratio of molar
concentrations in the mixture. (Castillo et al., 2013; Gonzalez-Antuna et al., 2013).
An interesting and completely different approach that would eliminate the need for matrix-matching,
standard addition, and isotope labels, is the use of the signal suppression (or enhancement)
measured for one specific ‘matrix-marker’ substance monitored throughout the chromatographic
run, to compensate for the matrix effect. This idea from Stahnke et al. (2009) relies on their
observation that different compounds experience the same matrix effect at the same retention time.
This article reports on a comparative study of diferent strategies to account for matrix effects in
LC-ESI-MS/MS. First the applicability of the approach proposed by Stahnke et al. (2009) to mycotoxins in
highly complex matrices was investigated. Subsequently, we compared the following calibration
approaches to compensate for matrix effects with respect to accuracy and efficiency: multi-level
external calibration using isotopically labelled internal standards (IL-IS), the standard addition
method (multi-level and single level), and two single-injection methods (OPIC and IPD). This was
done for nine mycotoxins in five matrices of increasing complexity.
As far as we know, the comparison of different methodologies of matrix effect compensation in
mycotoxin determination has only been recently evaluated in ochratoxin A (OTA) in grapes, musts
and wines by stable isotope dilution assay and diastereomeric dilution assay methods (Roland et al.,
2014).
2. Materials and methods
Reagents and materials
HPLC grade solvents methanol and acetonitrile were purchased from Biosolve (Valkenswaard, the
Netherlands). Ultra-pure water was obtained from a Milli-Q System (Millipore Co., Bedford, MA,
USA). Formic acid (>98% purity), ammonium formate (>99%), ammonium acetate (>99%) and
13C3-caffeine (>99%) were obtained from Sigma- Aldrich (Zwijndrecht, the Netherlands) and carbendazim
and chlormequat from Dr. Ehrenstorfer (Augsburg, Germany).
Biopure® mycotoxin standard solutions of unlabelled HT-2 and T-2 toxins in acetonitrile, uniformly
[13C]- labelled (U-labelled) compounds aflatoxin B1 (AFB1), deoxynivalenol (DON), T-2 and HT-2
toxins (T-2 and HT-2), ochratoxin A (OTA) and zearalenone (ZEA) in acetonitrile and fumonisins B1, B2
and B3 (FB1, FB2 and FB3) in acetonitrile:water were purchased from Romer Labs Diagnostic GmbH
(Tulln, Austria). FB3 standard solution in acetonitrile:water was acquired from PROMEC Unit (Medical
Research Council, Tygerberg, South Africa). The other unlabelled mycotoxins standards were
4
supplied by Sigma-Aldrich: FB1, FB2, DON, OTA and ZEA as a pure solid (purity higher than 98%) and
AFB1 in an acetonitrile solution. Individual stock solutions of fumonisins were prepared in
acetonitrile:water (1:1), DON, T-2 and HT-2, OTA and ZEA solutions were prepared in acetonitrile.
The stocks of the unlabelled and the U-labelled compounds were combined into two working
solutions (one for the unlabelled mycotoxins in acetonitrile:water (80:20, v/v) and one for the
U-labelled analogues in acetonitrile). The working solution of the unU-labelled mycotoxins had the
following concentrations: AFB1, 20 ng/ml; DON, 4,000 ng/ml; FB1, 2,000 ng/ml; FB2, 800 ng/ml; FB3,
400 ng/ml; HT-2, 400 ng/ml; OTA, 40 ng/ml; T-2, 400 ng/ml; ZEA, 1000 ng/ml. For the internal
calibration method the exact concentration of the labels need to be known. Therefore, the
concentrations of the [13C]-labelled working solutions obtained were determined by reverse isotope
dilution analysis and established to be: [13C17]-AFB1, 10.78 ng/ ml; [13C15]-DON, 1,290 ng/ml;
[13C34]-FB1, 462 ng/ml; [13C34]-FB2, 270 ng/ml; [13C34]-FB3, 130 ng/ml; [13C22]- HT-2, 250 ng/ml;
[13C20]-OTA, 28 ng/ml; [13C24]-T-2, 224 ng/ml and [13C18]-ZEA, 700 ng/ml. All standard solutions
(stock, intermediate and working solutions) were stored in amber glass bottles in a fridge. Prior to
usage, the working solutions were brought to room temperature and were mixed thoroughly.
Samples
Feed samples (soybean meal and wheat straw) and spice samples (nutmeg, paprika, curcuma and
ginger) were used to study the feasibility of the compensation of matrix effects through of a
‘matrix-marker’ substance. The comparison of different calibration strategies was carried out using five
different food and feed commodities: maize, compound feed, wheat straw, nutmeg and curcuma.
The selection of the matrices was based on the moderate to strong signal suppression associated
with these types of matrices. Maize was chosen as the least complex matrix in this work, but its
relative high matrix effects have been widely described (Beltran et al., 2009; De Girolamo et al.,
2013).
Sample preparation
Ground and homogenised samples (2.50±0.01 g) were weighed into 50-ml polypropylene tubes.
Samples were extracted by shaking with 10 ml acetonitrile/water/formic acid (84:16:1) (extraction
solution) on a mechanical shaker (SM 30 control, Edmund Buhler, Hechingen, Germany) (170-200
movements/min) for 2 h. Afterwards, the tubes were centrifuged at 3,000 rpm for 5 min and 200 μl
of supernatant was two-fold diluted with HPLC-grade wàter directly in a filter vial (Mini-UniPrep, 0.45
μm, Whatman,
Forham Park, NJ, USA). In case internal standards were added, this was done at this
stage (for details see below). The vials were closed with the corresponding filters and mixed by
vortex for 3 s. After being stored in the fridge for 30 min in order to precipitate part of the
co-extracted matrix, the extracts were filtered by pressing down the filters.
Due to the high absorption capability of straw samples, the volume of extraction liquid was increased
to 20 ml for these samples. Besides, the high degree of homogeneity of spice samples permitted to
reduce the amount of sample to (0.50±0.01 g) and consequently the volume of extraction solution to
2 ml. These samples were weighed in 15 ml Falcon tubes and extracted as described above.
LC-MS/MS analysis
An UPLC™ system (Acquity, Waters, Etten-Leur, the Netherlands) coupled to a Micromass Quattro
Ultima triple quadrupole mass spectrometer was used (Waters). The analytical column was an Ultra
aqueous C18 (3 μm particle size, 2.1.100 mm; Restek, Bellefonte, PA, USA), at a flow rate of 0.4
ml/min. The column temperature was set at 35 °C and the injection volume was 5 μl. The mobile
phase was a time programmed gradient using A (H2O) and B (MeOH:H2O, 95:5, v/v). For positive
electrospray conditions both mobile phases were modified with ammonium formate (1 mM) and
formic acid (1% v/v). Zearalenone in cúrcuma samples was analysed separately in a second run by
5
negative ionisation using mobiles phases modified with ammonium acetate (5 mM) and acetic acid
(0.1%). The percentage of organic modifier (B) was changed linearly as follows in both conditions: 0
min, 0%; 1 min, 0%; 2min, 50%; 3 min 50%; 8 min, 100%; 10 min, 100%; 10.5 min, 0%; 15 min, 0%.
The mass spectrometer was operated with electrospray ionisation in selected reaction monitoring
(SRM) mode (Table 1). Transitions monitored for 13C3-caffeine, carbendazim and chlormequat were
198 > 140, 192.2 > 160 and 122.2 > 58.3 respectively. Capillary voltages of 2.5 kV (positive ionisation
mode) and 3.5 kV (negative ionisation mode) were applied. Nitrogen was used as the nebulizer gas
and argon as the collision gas. The desolvation gas temperature was set to 350 °C and the source
temperature to 120 °C. The cone gas and desolvation flow were set at 200 and 550 l/h respectively.
Dwell times of 80 ms/ transition were used. Instrument control, data acquisition and evaluation
(integration and quantification) were done with MassLynx software (v. 4.1, Waters).
Continuous measurement of a ‘matrix-marker’ substance to correct for matrix effects
The set-up used was based on that described by Stahnke et al. (2009). However, instead of
permanent post-column infusion of the matrix-marker substance into the eluent through a T-piece,
which requires an additional pump, the monitored substance was introduced by adding it to the
mobile phases.
Three different compounds (13C3-caffeine, carbendazim and chlormequat) were selected as
candidate matrixmarker substances and added at a level of 2.5 ng/ml to both organic and aqueous
mobile phases. This level was in accordance with the post-column infusion conditions described by
Stahnke et al. (2009). Carbendazim was evaluated as candidate to correct for matrix effects because
of its successful use in the Stahnke work. Labelled caffeine was selected as an alternative and has the
advantage that it will not be present in samples. Chlormequat, a catiònic compound, was also
employed since it presented no interaction with the C18 column and eluted completely unretained.
Experiments were performed under positive electrospray conditions presented in Table 1. Sample
extracts (200 μl) were spiked with 12.5 μl of the unlabelled mix solution and adjusted to a final
volume of 400 μl with water. Standards were prepared in extraction solution:water (1:1, v/v) and
injected after every 5 samples.
6
The matrix effect (ME) profile at each retention time was constructed by calculating the ratio, at each
point of the chromatogram, between the signal intensity (SI) obtained with the sample extract and
that of the reference solvent (reagent blank) with the following expression (Equation 1):
ME(%) = (((SI(sample extract) / SI(reference solvent)) x 100) - 100
(1)
Once the matrix effect profile is calculated, recoveries corrected for matrix effects can be obtained
using the vàlues around the retention time for each compound (Stahnke et al., 2009).
7
For comparison of different quantification approaches nine mycotoxins were spiked to five food and
feed matrices at levels in the range of legislative or recommended màximum levels. For maize,
compound feed and straw 2.5 g were fortified with 625 μl of the working solution of unlabelled
mycotoxins. For nutmeg and curcuma 0.5 g were spiked with 125 μl of the same solution. The
concentration in fortified samples was established as level 0 (L0), which corresponded to following
concentration of mycotoxins in samples: AFB1, 0.005 μg/g; DON, 1 μg/g; FB1, 0.5 μg/g; FB2, 0.2 μg/g;
FB3, 0.1 μg/g; HT-2, 0.1 μg/g; OTA, 0.01 μg/g; T-2, 0.1 μg/g; ZEA, 0.25 μg/g. Samples were
equilibrated for 30 min before the extraction.
When measurements involved the use of the labelled mycotoxins, one aliquot of 200 μl of the initial
extract was spiked with 20 μl of the labelled mixture and diluted with 180 μl of deionised water. The
fortified samples were quantitatively analysed on three different days. From the data obtained the
average recovery and the precision (expressed as relative standard deviation (RSD) in %) were
determined using five different calibration approaches:
Multi-level external calibration using isotopically labelled internal standards
For this 20 μl of the labelled mycotoxin mix was added to 200 μl of the sample extract and deionised
water was added to obtain a final volume of 400 μl. Calibration standards in extraction solvent:water
(1:1) were prepared containing the mycotoxins at concentrations corresponding to 0, 0.5, 1, 2.5 and
10 times the concentration corresponding to L0 in sample and the IL-IS at the same level as in the
final sample extracts. The response of the mycotoxin was normalised to that of the corresponding
labelled internal standard. The concentration of the mycotoxins were determined using the equation
of the calibration curve obtained using the normalised responses. For comparison, the calculations
were also done without using the labels (i.e. without correction for matrix effects).
Multi-level standard addition
Four aliquots from the same sample extract were used to perform the recovery calculations based on
Standard additions. These were prepared by adding successively the mixture of the natural
compounds to 200 μl of extract of the fortified samples to obtain a final level of 1.5 times (level 1,
L1), 3 times (level 2, L2) and 4.5 times (level 3, L3) the level added to the spiked samples (L0).
Deionised water was added to obtain a final volume of 400 μl. The concentration of mycotoxin was
determined from the intercept of the calibration curve with the X-axis.
Single-level standard addition
For this quantification method the data from the multilevel standard addition method were used.
The concentration was calculated by:
with Lx being the standard addition level, and L0 the level in the fortified sample. This single-point
Standard addition calibration was performed for each of the three levels individually.
One-point isotopic internal calibration
One IL-IS for each compound, and a simple crossmultiplication is used to determine the
concentration in the extracts for each sample injection. No calibration curve is used. For this 20 μl of
the labelled mycotoxin mix was added to 200 μl of the extract (blank or fortified) and deionised
water was added to obtain a final volume of 400 μl. The concentration of the IL-IS in the extract
corresponded to that of the fortification levels in the samples. The concentration of the mycotoxin
was calculated by:
8
Isotope pattern deconvolution
IPD as used in this work is an alternative form of OPIC. IPD is a mathematical tool employed in
isotope dilution MS to obtain the concentration of each compound in the sample by multiple linear
regressions without the need to build any calibration curve. This approach assumes that, after spiking
the sample with the labelled analogue, the final isotòpic composition observed in the mixture is a
combination of the analyte and the isotopically enriched spike. Afterwards, solving the system of
equations formed by the abundances, the ratio of molar fractions is obtained and consequently the
concentration of analyte in sample. This approach
needs the measurement of the isotopic
composition of both natural and labelled compounds by mass spectrometry (Gonzalez-Antuna et al.,
2010). Taking into account the limited number of transitions that can be simultaneously measured by
LC-MS/MS, the most sensitive transitions should be known in advance. It is possible to calculate the
most abundant isotopomer combination for a selected transition by the use of the software Isopatrn
(Ramaley and Cubero Herrera, 2008), but the molecular formula of both precursor and product ions
must be available. The proposed molecular formula has been obtained by either previous works
(Bartok et al., 2006; Varga et al., 2012) or deducted by using Xcalibur software (Thermo Fisher
Scientific, San Jose, CA, USA) and was double checked with in-house exact mass databases
(Supplementary Table S1). The selected transitions for IPD calculations are included in Table 1. For
IPD calculations 3 transitions are used: the most abundant for natural and labelled compounds and a
third one, sensitive enough and free of interferences. A minimum number of three transitions is
necessary in order to be able solve the system of equations formed by the abundances by multiple
linear regression with a least square fitting.
In this system of equations
values corresponds to the measured abundance of the compound
in the mixture for the SRM transition of nominal masses i>j,
and
experimentally
measured abundances for the pure natural and labelled mycotoxins and ei>j is the error vector of the
multiple linear regression. By solving the previous system of equations, molar fractions for natural
and labelled compounds (Xnat and Xlab) in the mix are obtained, and the amount (mols) of natural
abundance mycotoxin in the sample, Nnat, is then calculated using Equation (5) where the amount
(mols) of each labelled mycotoxins added, Nlab, must be known.
It should be noted the probability of errors caused by the contribution of fragmentation before Q1.
For example, the transition 319
→
283, which starts at the [M+H] of native ZEA may be theoretically
influenced by the fragment ion [M+H-H2O]+ of 13C18-ZEA. However, our measurements will be
biased only if [M+H-H2O] of 13C18-ZEA has also a main fragment in Q2 of m/z 283 which it is not the
case.
The samples used for this study turned out to be contaminated with certain mycotoxins
(Supplementary Table S2). In these cases, the amount present in the non
fortified samples was
subtracted from that of the fortified samples in all quantification approaches. Since no blank samples
were available for the majority of the matrices, an unspiked sample was prepared for each matrix. A
volume of 200 μl of the final extract was fortified with 20 μl of the labelled mixture and 180 μl of
water in order to be able to subtract the amount of each mycotoxin found in the samples by all the
quantification methodologies.
9
Determination of matrix effects by post-extraction addition
Matrix effects were calculated by comparison of the response of a mycotoxin in sample extract with
the response of the same concentration in a solvent standard. This was done at the L2 level.
Endogenous concentrations of mycotoxins in the samples were taken into account (subtracted) in
the calculations.
3. Results and discussion
Assessment of the feasibility of compensation of matrix effects through the signal of a
continuously monitored substance
The work of Stahnke et al. (2009) establishes that the ion suppression or enhancement for a
monitored substance can be extrapolated to other analytes if they elute at the same retention time,
and therefore can be used to correct for matrix effects. To study the applicability of this approach,
three ‘matrix-marker’ substances (13C-caffeine, carbendazim and chlormequat) were tested. In this
work, in order not to complicate the instrumental configuration, the substances were added to the
mobile phase rather than by post-column infusion as done by Stahnke et al. At least one injection for
stabilisation of the system when starting a new sequence was performed. By doing so, no indications
for concentration fluctuations of the marker substance due to absorption in the LC-pump or valve
were observed. First the signal intensities of the three substances during the entire chromatographic
run were measured without matrix (injection of reagent blank; Figure 1A).
10
This basically shows
the effect of the mobile phase gradient on the response of each of the three
substances. Next, the signal intensities were measured after injection of extracts of diferent matrices
known to cause moderate to strong matrix effects (a soy by-product used as feed ingredient, wheat
straw, nutmeg (shown in Figure 1B), paprika, curcuma and ginger). Then, the matrix effect profiles
were constructed based on the ratio of the signals obtained after injection of sample extract and
reagent blank versus retention time (Figure 1C for nutmeg, Figure 2 for curcuma and wheat straw,
more examples in the Supplementary Figure S1). One limitation of the set-up to add the substances
to the mobile phase (instead of post-column infusion) was that due to the interaction of carbendazim
and 13C-caffeine with the stationary phase (retention time 2.8 and 3.3 min, respectively), these
compounds were initially accumulated in the column until their constant elution. For this reason, the
usable matrix-effect profiles ranged from 3.5 to 9 min.
11
The graphs very nicely show that the matrix effects, mostly suppression, varies widely for different
matrices and at different retention times. The objective of these graphs was to obtain the matrix
effect values at the retention time of each of the mycotoxins and then use these values to correct for
the matrix effect. The first observation that can be made from the matrix-effect profiles for the three
marker substances is that they overlap to a certain extent, but not consistently, and that remarkable
differences do occur. For example, in Figure 2A in the elution range of the mycotoxins (up to approx.
7 min) the magnitude of suppression for carbendazim and 13C-caffeine is similarly strong, but much
less suppression occurs for chlormequat. The different values obtained between chlormequat and
the other two compounds can be explained, at first, by the different psychochemical properties since
chlormequat is a highly ionised compound. However, for wheat straw, 13C-caffeine and chlormequat
are overlapping quite well while carbendazim is clearly more suppressed. In certain matrices and at
certain retention times, very large variations in matrix effects between the three marker substances
can be seen, for example for ginger (Figure S1) at 5.0 min, the suppression of 13C-caffeine and
chlormequat is similar and carbendazim is deviating, while at 5.5 min 13C-caffeine and carbendazim
are similar and chlormequat is deviating.
These differences cannot be readily explained by the physico-chemical properties of the monitored
compounds. In Figure 1C and 2 the actual matrix effects for individual mycotoxins, determined by
comparison of the response in matrix versus the response in solvent standards, are also included.
From this is it clear that similar observations can be made for the other mycotoxins and matrices
(Figure 1C, Figure 2). Also for mycotoxins that co-elute (e.g. aflatoxin B1 and HT-2 toxin) substantial
differences occur (see also Table 2 and 3, and Supplementary Tables S2-S4). The results
demonstrate
that the correction of the matrix effect by monitoring a ‘matrix-marker’ substances is an unsuitable
approach for the correction of matrix effects for the tested conditions. Although the approach seems
12
appropriate for the pesticides and matrices from the work by Stahnke et al. (2009), it was not suited
for the mycotoxins and matrices studied in the present work. The reasons for this were not fully
clear, but might be related to the type of matrix, the higher degree of suppression (especially spices)
and/or the instrumental conditions used. However, the method provides a qualitative assessment of
the matrix effect and enables the researcher to evaluate the alteration of the analyte response at
each retention time.
Comparison of different calibration approaches
In the comparison nine mycotoxins (AFB1, DON, FB1, FB2, FB3, HT-2, OTA, T-2 and ZEA) were
selected based on the availability of the isotopically labelled analogues of the sought compounds
and, except for FB3, their inclusion in the European Union food legislation. Maize, compound feed,
straw, nutmeg and curcuma were selected due to their known moderate to high signal suppression.
The average matrix effects and its variability (standard deviation) for the different mycotoxin/matrix
combinations as measured on three different days are included in Table 2 (maize), Table 3 (nutmeg),
Supplementary Table S3 (compound feed), Supplementary Table S4 (wheat straw), and
Supplementary Table S5 (curcuma). Matrix effects were calculated according to Equation 6. To this
end, the ratio between the areas of the standard prepared in solvent and in sample extract were
compared. In view of these results, the compounds affected by a higher suppression were AFB1 and
DON for all the matrices. Moreover, the signal of ZEA was also affected by the matrix of both studied
spices, while T-2 and OTA were mostly affected by the cúrcuma matrix. In general, matrix effects for
all analytes were more pronounced in spice samples, in particular curcuma, than in maize, compound
feed or straw. Malachova et al. (2014) have previously reported this in green pepper.
For the evaluation of trueness, samples were spiked with working solution (unlabelled mycotoxins) at
one level before extraction. The concentration levels were selected according to typical legislative or
recommended limits and were established as level 0 (L0) (see materials and methods for specific
values). Recoveries of the selected mycotoxins were first calculated by the standard addition method
(addition to the extract). As the quantification is carried out in the same matrix, the standard
addition method compensates for any matrix effect and the extraction recovery can be assessed. The
standard addition calculations were performed by adding the working solution of natural mycotoxins
to different aliquots of the same extract to obtain a final level of 1.5 times (level 1, L1), 3 times (level
2, L2) and 4.5 times (level 3, L3) the level spiked to sample (L0). This permitted to obtain a four-point
calibration graph built with the spiked sample and the three post-extraction levels. Moreover, the
recoveries were also calculated based on single Standard addition using each of the three levels.
Alternatively, the isotope-labelled mycotoxins, added to an extract aliquot of L0, were used as
internal standard for calculating the recoveries by a five-point calibration curve in solvent, and by
two single-point calibration approaches: OPIC and IPD (see materials and methods for details). The
main difference between the single-point calculations is the use of three isotopomer abundances in a
multiple linear regression (IPD) instead of a cross-multiplication (OPIC) to determine the
concentration in the sample.
Satisfactory linearity by standard addition and internal standard calibration curve with correlation
coeficients above 0.995 in all sample matrices was obtained, excepte for OTA in straw and curcuma
for the standard addition method. For this reason this analyte was excluded in the comparison by
standard additions (either, multiple or single addition) in straw and curcuma. Besides, OTA was
affected by a co-eluting isobaric interference in nutmeg samples. Finally, due to the lower sensitivity
in cúrcuma samples, no second transition, needed for IPD calculations, was observed and
consequently the recovery calculations could not be performed. All the difficulties regarding OTA
calculations were related to the low levels and lower sensitivity (partly due to the high suppression)
of this compound.
13
Regarding the three-day recovery study, the trueness (recovery) and precision are shown in Tables 2
and 3 and Supplementary Tables S3 to S5 for maize, nutmeg, compound feed, straw and curcuma,
respectively. Recovery and precision are assessed according to EU Regulation 519/2014 (EC, 2014).
The recovery requirements in this regulation vary for the different mycotoxins and concentrations
(for the fortification levels in this work: 50-120% for AFB1, 60-130% for T-2/H-T2-toxins, 60- 120% for
fumonisins, 70-120% for DON and ZEA, and 70-110% for OTA). For precision, the repeatability (RSDr)
requirement from EU Regulation 519/2014 were used, even though the data were generated under
within-lab reproducibility conditions. The RSDr requirements vary for the different mycotoxins and
range from 20-30%. For the standard addition method, recoveries and RSDr met the requirements in
all cases with the following exceptions: OTA in maize (Table 2), and DON, AFB1, and ZEA in Straw
(Supplementary Table S4). Quantification methods based on a single-level standard addition can
provide appropriate results except when the addition level is too close to the level present in the
sample. Here that was the case for level L1 resulting in a small response difference with L0. Minor
variations in response of either L0 or L1 will lead to wide variations in the analysis result. This
explains the high RSD values and the recoveries outside the EU Regulation 519/2014 acceptance
criteria. As long as the addition is 3 or 4.5 times the level in the sample, similar results were obtained
as compared to multi-level standard addition. Considering that only two injections instead of four for
each quantitation were needed for the single-addition method, this approach considerably reduced
the total analysis time and could be the best option when no IL-IS is available.
Quantification using the calibration curve with the internal standard method also provided accurate
results together with proper precision values. When available, quantification using IL-IS has been
demonstrated as a proper alternative to correct matrix effect.
The results obtained using single point calibration (OPIC and IPD), with several recovery values
outside the requirements, were worse than expected, although precision was comparable with those
based on a calibration curve. One explanation for the observed bias might be deviations in the true
14
concentrations of labelled mycotoxins. OPIC and IPD should, at first, show some advantages.
Standard (labelled compounds) are added to the sample and relative signal (OPIC) or isotopomer
abundances (IPD) are directly measured in matrix. Thus, the matrix effect should be corrected as in
the standard addition method and in external calibration using the isotope labels to normalise the
response. On the other hand no calibration curve is used and quantitation can be performed by only
one injection per sample, making it a fast method (Castillo et al., 2013; Gonzalez-Antuna et al., 2013;
Peters and Maurer, 2007). However, incorrect high recoveries were obtained for fumonisins, OTA
and T-2 in some of the matrices studied, especially for the OPIC method as can be seen in maize
(Table 2), nutmeg (Table 3), compound feed (Supplementary Table S3) and straw (Supplementary
Table S4). In any case, with the exception of FB2 in maize, FB2 and FB3 in nutmeg and the three
studied mycotoxins in straw, recoveries (and precision) calculated by IPD and OPIC are comparable to
the calibration curve methods but with a considerable reduction of the total analysis time.
The comparison of the different calibration approaches shows that there are various ways to achieve
acceptable results. It should be noted that some of the recovery and precision data were affected by
the subtraction of the endogenous amount of mycotoxins in the samples (Supplementary Table S2),
as no blank samples were available, and to the fact that the additions (Standard additions or internal
standard) were performed to the final extract rather than to the sample itself. Thus, the sample
treatment process effect on precision was not corrected. However, post-extraction addition is a less
expensive method, since lower quantities can be added, especially for the expensive labelled
mycotoxins.
4. Conclusions
An exhaustive study on the extent of matrix effects and applicability of four mathematical
methodologies for their correction in LC-ESI-MS/MS mycotoxins analysis in challenging matrices has
been reported. The correction of the matrix effect by monitoring the signal of a continuously added
15
substance was studied but without satisfactory results. The assumption that the matrix effect for a
monitored compound can be extrapolated to other analytes if it occurs at the same retention time is
not applicable for the mycotoxins and matrices in the present study. Otherwise, this approach
permitted a qualitative evaluation of the signal suppression and enhancement phenomena at each
retention time.
The evaluation of absolute matrix effects exhibited by the electrospray source in the LC-MS/MS
system showed that the signal was particularly supressed in spice samples. Generally, DON and AFB1
were the analytes affected by the highest suppression. The majority of recovery and RSD values were
between 70-120% and below 20%, respectively, for the standard addition method (both for multiple
or single addition at adequate concentration levels) and when using a calibration curve with an IL-IS.
Thus, those methodologies all compensate sufficiently for the matrix effect, and trueness and
precision meet the EU Regulation 519/2014 acceptance criteria. When suitable internal standards are
not available, single-level standard addition methods can be the choice as it reduces considerably the
total analysis time.
This study has also demonstrated that single-point calibration approaches (OPIC and IPD) provide
similar results, in terms of recovery and precision, to the vàlues obtained with the whole calibration
curve. Nevertheless, recoveries for single-point calculations with isotope labelled internal standards
occasionally led to unacceptable high recoveries. Further verification of the trueness of the
concentration of the labelled mycotoxin solutions is needed to resolve this given that those methods
are the fastest (only one injection per sample is needed) and can correctly compensate the matrix
effect.
Acknowledgements
The Dutch Ministry of Economic Affairs is acknowledged for financially supporting this work. The
authors acknowledge the financial support from Generalitat Valenciana (Research group of
excellence Prometeo 2009/054 and Collaborative Research on Environment and Food Safety
ISIC/2012/016). N. Fabregat-Cabello also acknowledges the Generalitat Valenciana for her Ph.D.
research grant under the Program VALi+D.
References
Bartok, T., Szecsi, A., Szekeres, A., Mesterhazy, A. and Bartok, M., 2006. Detection of new fumonisin
mycotoxins and fumonisinlike compounds by reversed-phase high-performance líquid
chromatography/electrospray ionization ion trap mass spectrometry. Rapid Communications in Mass
Spectrometry 20: 2447-2462.
Beltran, E., Ibanez, M., Portoles, T., Ripolles, C., Sancho, J.V., Yusa, V., Silvia, M. and Hernandez, F.,
2013. Development of sensitive and rapid analytical methodology for food analysis of 18 mycotoxins
included in a total diet study. Analytica Chimica Acta 783: 39-48.
Beltran, E., Ibanez, M., Sancho, J.V. and Hernandez, F., 2009. Determination of mycotoxins in
different food commodities by ultrahigh pressure liquid chromatography coupled to triple
quadrupole mass spectrometry. Rapid Communications in Mass Spectrometry 23: 1801-1809.
Bennett, J.W. and Klich, M.,2003. Mycotoxins. Clinical Microbiology Reviews 16: 497-516.
Berthiller, F., Burdaspal, P.A., Crews, C., Iha, M.H., Krska, R., Lattanzio, V.M.T., MacDonald, S.,
Malone, R.J., Maragos, C., Solfrizzo, M., Stroka, J. and Whitaker, T.B., 2014. Developments in
mycotoxin analysis: an update for 2012-2013. World Mycotoxin Journal 7: 3-33.
Castillo, A., Gracia-Lor, E., Roig-Navarro, A.F., Sancho, J.V., Rodriguez- Gonzalez, P. and Garcia Alonso,
J.I., 2013. Isotope patern deconvolution-tandem mass spectrometry for the determination and
confirmation of diclofenac in wastewaters. Analytica Chimica Acta 765: 77-85.
De Girolamo, A., Solfrizzo, M., Lattanzio, V.M.T., Stroka, J., Alldrick, A., Van Egmond, H.P. and
Visconti, A., 2013. Critical evaluation of LC-MS-based methods for simultaneous determination of
16
deoxynivalenol, ochratoxin A, zearalenone, aflatoxins, fumonisins and T-2/HT-2 toxins in maize.
World Mycotoxin Journal 6: 317-334.
European Commission (EC), 2002, Commission Directive No. 2002/32/ EC of 7 May 2002 of the
European Parliament and of the Council on undesirable substances in animal feed, Official Journal of
the European Communities L 140: 10-21.
European Commission (EC), 2006a. Commission Recommendation 2006/576/EC of 17 August 2006
on the presence of deoxynivalenol, zearalenone, ochratoxin A, T-2 and HT-2 and fumonisins in
products intended for animal feeding. Official Journal of the European Union L 229: 7-9.
European Commission (EC), 2006b. Commission Regulation (EC) No. 1881/2006 of 19 December 2006
setting maximum levels for certain contaminants in foodstuffs. Official Journal of the European Union
L 364: 5-24.
European Commission (EC), 2013. Commission Recommendation 2013/165/EU of 27 March 2013 on
the presence of T-2 and HT-2 toxin in cereals and cereal products. Official Journal of the European
Union L 91: 12-15.
European Commission (EC), 2014, Commission Regulation (EU) No 519/2014 of 16 May 2014
amending Regulation (EC) No 401/2006 as regards methods of sampling of large lots, spices and food
supplements, performance criteria for T-2, HT-2 toxin and citrinin and screening methods of analysis.
Official Journal of the European Union L147: 29-43.
Fung, F. and Clark, R.F., 2004. Health effects of mycotoxins: a toxicological overview. Clinical
Toxicology 42: 217-234.
Furey, A., Moriarty, M., Bane, V., Kinsella, B. and Lehane, M.,2013. Ion suppression; A critical review
on causes, evaluation, prevention and applications. Talanta 115: 104-122.
Gonzalez-Antuna, A., Dominguez-Romero, J.C., Garcia-Reyes, J.F., Rodriguez-Gonzalez, P., Centineo,
G., Garcia Alonso, J.I. and Molina-Diaz, A., 2013. Overcoming matrix effects in electrospray:
quantitation of β-agonists in complex matrices by isotope dilution liquid chromatography-mass
spectrometry using singly (13) C-labeled analogues. Journal of Chromatography A 1288: 40-47.
Gonzalez-Antuna, A., Rodriguez-Gonzalez, P., Centineo, G. And Garcia Alonso, J.I., 2010. Evaluation of
minimal 13C-labelling for stable isotope dilution in organic analysis. Analyst 135: 953-964.
Hewavitharana, A.K., 2011. Matrix matching in liquid chromatography – mass spectrometry with
stable isotope labelled internal standards – is it necessary ? Journal of Chromatography A 1218:
359-361.
Malachova, A., Sulyok, M., Beltran, E., Berthiller, F. and Krska, R., 2014. Optimization and validation
of a quantitative líquid chromatography-tandem mass spectrometric method covering 295 bacterial
and fungal metabolites including all regulated mycotoxins in four model food matrices. Journal of
Chromatography A 1362: 145-156.
Matuszewski, B.K. and Constanzer, M.L., 2003. Strategies for the assessment of matrix effect in
quantitative bioanalytical methods based on HPLC-MS/MS. Analytical Chemistry 75: 3019-3030.
Pascale, M., 2009. Detection methods for mycotoxins in cereal grains
and cereal products. Zbornik Matice srpske za prirodne nauke
117: 15-25.
Peters, F.T. and Maurer, H.H., 2007. Systematic comparison of bias and precision data obtained with
multiple-point and one-point calibration in six validated multianalyte assays for quantification of
drugs in human plasma. Analytical Chemistry 79: 4967-4976.
Ramaley, L. and Cubero Herrera, L., 2008. Software for the calculation of isotope patterns in tandem
mass spectrometry. Rapid Communications in Mass Spectrometry 22: 2707-2714.
Roland, A., Bros P., Bouisseau, A., Cavelier, F. and Schneider, R., 2014. Analysis of Ochratoxin A in
grapes, musts and wines by LC-MS/MS: first comparison of stable isotope dilution assay and
diastereomèric dilution assay methods. Analytica Chimica Acta 818: 39-45.
17
Shephard, G.S., Berthiller, F., Burdaspal, P.A., Crews, C., Jonker, M.A., Krska, R., Lattanzio, V.M.T.,
MacDonald, S., Malone, R.J., Maragos, C., Sabino, M., Solfrizzo, M., Van Egmond, H.P. and Whitaker,
T.B., 2013. Developments in mycotoxin analysis: an update for 2011-2012. World Mycotoxin Journal
6: 3-30.
Stahnke, H., Kittlaus, S., Kempe, G. and Alder, L., 2012. Reduction of matrix effects in liquid
chromatography-electrospray ionizationmass spectrometry by dilution of the sample extracts: how
much
dilution is needed? Analytical Chemistry 84: 1474-1482.
Stahnke, H., Reemtsma, T. and Alder L., 2009. Compensation of matrix effects by postcolumn infusion
of a monitor substance in multiresidue analysis with LC-MS/MS. Analytical Chemistry 81: 2185-2192.
Taylor, P.J., 2005. Matrix effects: the Achilles heel of quantitative high-performance liquid
chromatography-electrospray-tandem mass spectrometry. Clinical Biochemistry 38: 328-334.
Trufelli, H., Palma, P., Famiglini, G. and Cappiello, A., 2011. An overview of matrix effects in liquid
chromatography-mass spectrometry. Mass Spectrometry Reviews 30: 491-509.
Varga, E., Glauner, T., Koppen, R., Mayer, K., Sulyok, M., Schuhmacher, R., Krska, R. and Berthiller, F.,
2012. Stable isotope dilution assay for the accurate determination of mycotoxins in maize by
UHPLCMS/ MS. Analytical and Bioanalytical Chemistry 402: 2675-2686.
Supplemental Information
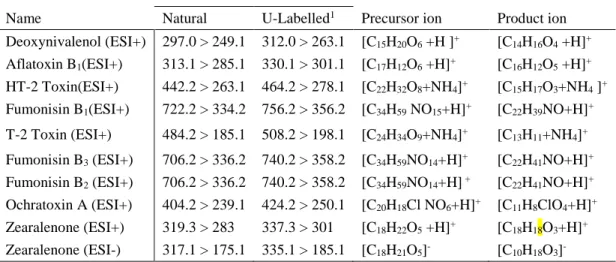
Table S - 1. Name, selected reaction monitoring (SRM) transition and formula for precursor for the natural and
isotopically labelled mycotoxin.
SRM transition
Name Natural U-Labelled1 Precursor ion Product ion
Deoxynivalenol (ESI+) 297.0 > 249.1 312.0 > 263.1 [C15H20O6 +H ]+ [C14H16O4 +H]+
Aflatoxin B1(ESI+) 313.1 > 285.1 330.1 > 301.1 [C17H12O6 +H]+ [C16H12O5 +H]+
HT-2 Toxin(ESI+) 442.2 > 263.1 464.2 > 278.1 [C22H32O8+NH4]+ [C15H17O3+NH4 ]+
Fumonisin B1(ESI+) 722.2 > 334.2 756.2 > 356.2 [C34H59 NO15+H]+ [C22H39NO+H]+
T-2 Toxin (ESI+) 484.2 > 185.1 508.2 > 198.1 [C24H34O9+NH4]+ [C13H11+NH4]+
Fumonisin B3 (ESI+) 706.2 > 336.2 740.2 > 358.2 [C34H59NO14+H]+ [C22H41NO+H]+
Fumonisin B2 (ESI+) 706.2 > 336.2 740.2 > 358.2 [C34H59NO14+H] + [C22H41NO+H]+
Ochratoxin A (ESI+) 404.2 > 239.1 424.2 > 250.1 [C20H18Cl NO6+H]+ [C11H8ClO4+H]+
Zearalenone (ESI+) 319.3 > 283 337.3 > 301 [C18H22O5 +H]+ [C18H18O3+H]+
Zearalenone (ESI-) 317.1 > 175.1 335.1 > 185.1 [C18H21O5]- [C10H18O3]
18
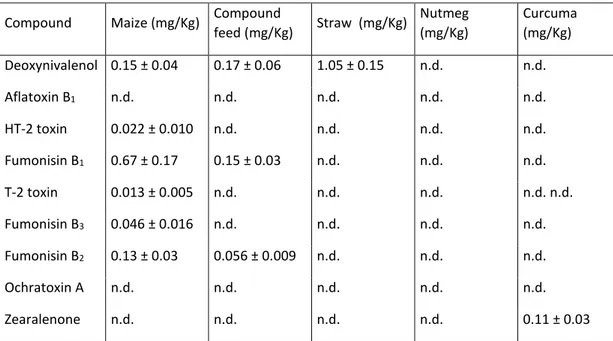
Table S -2. Concentration obtained in positive samples by single-level standard addition.aThe
uncertainty of the values corresponds to 1s standard deviation. n.d.=non detected Compound Maize (mg/Kg) Compound
feed (mg/Kg) Straw (mg/Kg) Nutmeg (mg/Kg) Curcuma (mg/Kg) Deoxynivalenol 0.15 ± 0.04 0.17 ± 0.06 1.05 ± 0.15 n.d. n.d. Aflatoxin B1 n.d. n.d. n.d. n.d. n.d. HT-2 toxin 0.022 ± 0.010 n.d. n.d. n.d. n.d. Fumonisin B1 0.67 ± 0.17 0.15 ± 0.03 n.d. n.d. n.d. T-2 toxin 0.013 ± 0.005 n.d. n.d. n.d. n.d. n.d. Fumonisin B3 0.046 ± 0.016 n.d. n.d. n.d. n.d. Fumonisin B2 0.13 ± 0.03 0.056 ± 0.009 n.d. n.d. n.d. Ochratoxin A n.d. n.d. n.d. n.d. n.d. Zearalenone n.d. n.d. n.d. n.d. 0.11 ± 0.03
19
Table S - 3. Matrix effect and recoveries in percentage of mycotoxins in compound feed using different calibration approaches.
Multi-level calibration Single-level calibration
Standard addition Internal calibration
Compound Matrix effect±SD
Solvent STD w/o IL-IS
Solvent STD with IL-IS
L1-L3 L1 L2 L3 OPIC IPD
Recovery (RSD) n=3, three different days)
Deoxynivalenol -58 ± 6 42 (14) 101 (10) 97 (7) 113 (25) 102 (5) 96 (12) 112 (4) 105 (4) Aflatoxin B1 -37 ± 11 63 (16) 105 (19) 92 (8) 104 (38) 100 (14) 94 (7) 103 (13) 110 (14) HT-2 toxin 5 ± 20 103 (6) 113 (17) 92 (10) 117 (17) 108 (14) 97 (7) 107 (16) 118 (14) Fumonisin B1 -6 ± 22 73 (21) 85 (18) 81 (5) 79 (18) 79 (9) 73 (8) 104 (12) 95 (12) T-2 toxin -10 ± 21 100 (23) 111 (16) 98 (16) 111 (52) 114 (29) 99 (20) 126 (17) 112 (17) Fumonisin B3 -10 ± 15 93 (24) 101 (26) 81 (11) 111 (38) 101 (12) 84 (15) 119 (3) 106 (2) Fumonisin B2 1 ± 5 93 (19) 86 (14) 89 (9) 92 (13) 92 (13) 84 (15) 111 (16) 107 (15) Ochratoxin A -12 ± 15 108 (10) 116 (35) 77 (4) 486 (117) 107 (6) 90 (14) 129 (24) 134 (23) Zearalenone -11 ± 16 92 (18) 95 (16) 95 (14) 106 (26) 109 (8) 95 (13) 97 (12) 98 (12)
aFigures in bold: recoveries or RSDr outside range EU 519/2014.
20
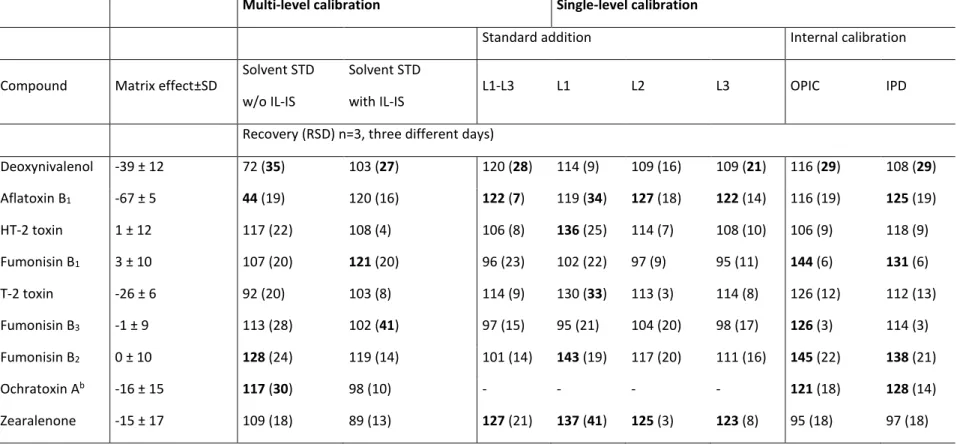
Table S - 4. Matrix effect and recoveries in percentage of mycotoxins in wheat straw using different calibration approaches.
Multi-level calibration Single-level calibration
Standard addition Internal calibration
Compound Matrix effect±SD
Solvent STD w/o IL-IS
Solvent STD with IL-IS
L1-L3 L1 L2 L3 OPIC IPD
Recovery (RSD) n=3, three different days)
Deoxynivalenol -39 ± 12 72 (35) 103 (27) 120 (28) 114 (9) 109 (16) 109 (21) 116 (29) 108 (29) Aflatoxin B1 -67 ± 5 44 (19) 120 (16) 122 (7) 119 (34) 127 (18) 122 (14) 116 (19) 125 (19) HT-2 toxin 1 ± 12 117 (22) 108 (4) 106 (8) 136 (25) 114 (7) 108 (10) 106 (9) 118 (9) Fumonisin B1 3 ± 10 107 (20) 121 (20) 96 (23) 102 (22) 97 (9) 95 (11) 144 (6) 131 (6) T-2 toxin -26 ± 6 92 (20) 103 (8) 114 (9) 130 (33) 113 (3) 114 (8) 126 (12) 112 (13) Fumonisin B3 -1 ± 9 113 (28) 102 (41) 97 (15) 95 (21) 104 (20) 98 (17) 126 (3) 114 (3) Fumonisin B2 0 ± 10 128 (24) 119 (14) 101 (14) 143 (19) 117 (20) 111 (16) 145 (22) 138 (21) Ochratoxin Ab -16 ± 15 117 (30) 98 (10) - - - - 121 (18) 128 (14) Zearalenone -15 ± 17 109 (18) 89 (13) 127 (21) 137 (41) 125 (3) 123 (8) 95 (18) 97 (18)
aFigures in bold: recoveries or RSDr outside range EU 519/2014. bUnsatisfactory linearity were obtained for standard addition method
21
Table S -5. Matrix effect and recoveries in percentage of mycotoxins in curcuma using different calibration approaches.
Multi-level calibration Single-level calibration
Standard addition Internal calibration
Compound Matrix effect±SD
Solvent STD w/o IL-IS
Solvent STD with IL-IS
L1-L3 L1 L2 L3 OPIC IPD
Recovery (RSD) n=3, three different days)
Deoxynivalenol -42 ± 5 56 (11) 95 (10) 92 (9) 104 (22) 99 (5) 95 (2) 108 (16) 100 (16) Aflatoxin B1 -85 ± 1 13 (26) 107 (26) 100 (19) 69 (29) 88 (18) 92 (23) 111 (39) 119 (36) HT-2 toxin -26 ± 12 56 (17) 101 (20) 91 (16) 81 (53) 84 (36) 86 (28) 96 (14) 106 (13) Fumonisin B1 -9 ± 9 82 (15) 65 (35) 77 (13) 102 (30) 92 (13) 84 (15) 84 (29) 77 (29) T-2 toxin -65 ± 1 36 (6) 88 (6) 97 (13) 100 (39) 107 (9) 97 (9) 102 (6) 91 (6) Fumonisin B3 -11 ± 12 80 (10) 86 (35) 85 (25) 101 (25) 89 (7) 88 (12) 109 (28) 99 (29) Fumonisin B2 -6 ± 9 91 (11) 80 (34) 94 (11) 120 (17) 98 (3) 99 (9) 95 (37) 90 (37) Ochratoxin A -76 ± 11 21 (20) 92 (18) - - - - 84 (48) -c Zearalenone -89 ± 4 6 (34) 77 (11) 82 (4) 86 (22) 76 (12) 77 (7) 96 (11) 100 (11)
aFigures in bold: recoveries or RSDr outside range EU 519/2014. bUnsatisfactory linearity were obtained for standard addition method. cNo second transition available for IPD calculations.