Spread of hatch and delayed feed access affect post hatch
performance of female broiler chicks up to day 5
Y. Wang
1, Y. Li
1,2, E. Willems
1, H. Willemsen
1, L. Franssens
1, A. Koppenol
1,3,
X. Guo
1,4, K. Tona
5, E. Decuypere
1, J. Buyse
1†and N. Everaert
11Laboratory of Livestock Physiology, Department of Biosystems, KU Leuven. Kasteelpark Arenberg 30, 3001 Leuven, Belgium;2Lab of Translational Medicine, Jiangsu
Province Academy of Traditional Chinese Medicine, Nanjing, Jiangsu, P R China;3Animal Sciences Unit, ILVO, Scheldeweg 68, 9090 Melle, Belgium;4College of
Animal Science and Technology, Jiangxi Agricultural University, 330045, Jiangxi, P R China;5Department of Animal Production, School of Agriculture University of
Lome 1515, Togo
(Received 14 July 2013; Accepted 22 December 2013)
It is not rare that newly hatched chicks remain without feed for about 24 to 48 h before they are placed on farms due to a series of logistic operations. Furthermore, the spread in hatching time can also mount up to 30 to 48 h for latev.early hatchers. In other words, the practice is a complex combination of spread of hatch and delayed feed access. The present study was aimed to investigate the combined effects of hatching time with a delay in feed access of 48 h, starting from their hatch-time (biological age). When chicks had access to feed immediately after hatch, late hatchers had a higher feed intake and relative growth rate up to day 5 compared with their early hatched counterparts. Feed deprivation during thefirst 48 h resulted in retarded early growth rate, which was further aggravated by an impaired feed intake after refeeding. In addition, the differential effects of hatching time on relative growth rate and feed intake observed in immediately fed chicks were eliminated by the 48 h feed delay. The yolk utilization after hatch was faster for the late hatchers up to biological day 2 regardless of the feeding treatments. Hatching muscle glycogen content was higher in the late hatchers compared with that of their early counterparts at hatch and at biological day 2 independent of feeding treatment. Moreover, the liver glycogen content of the late hatchers was also higher at hatch. For the immediately fed chicks, the proportional breast muscle weight of the late hatchers was higher at biological day 2 and 5. For the starved chicks, on the other hand, this effect was only observed after they had access to feed (biological day 5). The different plasma T3levels at hatch may have contributed to the different post hatch performance. It is concluded that the spread of hatch
influenced post hatch performance, especially appetite and growth at least until day 5. Moreover, the delay in feed access interacted with the hatching time and caused adverse effects on the post hatch performance.
Keywords: hatching time, delayed feed access, feed intake, post hatch growth, broiler
Implications
Incubation of chicken eggs has a duration of about 21 days. Thefirst hatched chicks are 30 to 48 h ahead of the last ones. In addition, before the start of rearing on the farm, chicks are sometimes deprived of feed and water for 24 to 48 h. In the present study, it was aimed to investigate the effects of hatching time and to combine this with the often seen practice in the poultry industry: delay in feed access after hatch. The interaction and underlying mechanisms are not only an interesting scientific topic, but also provide useful insight for animal husbandry.
Introduction
Early feeding after hatch improves the initiation of growth in neonatal chicks (Bigot et al., 2003a), and this growth pro-moting effect lasts until marketing (Noy and David, 1999). However, it is not rare that newly hatched chicks remain without feed for up to 48 h before they are placed on farms due to a series of operations, such as sexing, vaccination and transportation. Furthermore, there is also an inevitable spread of hatch of 30 to 48 h for late v. early hatchers. In other words, the early hatchers will undergo even longer feed deprivation due to the spread of hatch. Hence, in practical situations, a complex combination of spread of hatch and delayed feed access is present.
Several studies have paid close attention to the spread of hatch. Previous study indicated that the spread of hatch
†E-mail: johan.buyse@biw.kuleuven.be
resulted in chicks of different qualities (Tonaet al., 2003a). Careghi et al. (2005) studied the interaction of spread of hatch and feed delay, and introduced the concept of biological age (BA: age counted from the precise time of hatch), which is more relevant than the chronological age (CA: age counted from end of hatch of the whole batch) for comparison between early, middle and late hatching chicks. Interestingly, they found that the spread of hatch had effects on relative growth rate and plasma triiodothyronine (T3) levels up to BA day 7. A recent study demonstrated that
the spread of hatch not only affected the post hatch growth (CA was employed in this study), but also had interaction with hatching systems (van de Venet al., 2011).
Early access to feed is of crucial importance. Delayed feed access and early feed restriction will cause detrimental effects on juvenile performance. Layer chicks with 48 h delayed feed access had a lower BW and decreased serum glucose, total protein and triglycerides concentration up to 56 days (Gaglo-Disse et al., 2010). Newly hatched broiler chicks subjected to 14 days of feed restriction (feed provided on alternate days) had lower BW and lateral gastrocnemius weight accompanied by reduced serum T3levels and changes
of mRNA expression for growth-related genes in muscle (Liet al., 2007).
Despite the notable progress, as yet, it is still elusive how the spread of hatch and early feed deprivation interact and what the effects are on chicken post hatch performance and metabolism. Therefore the aim of the present study was to investigate the effects of hatching time, combined with a delay in feed access of 48 h, on chicken development, especially on the post hatch performance up to day 5 and underlying causal physiological mechanisms.
Material and methods
Incubation and hatch
A total of 1200 eggs produced by a commercial flock of Ross 308 breeders were obtained from a local hatchery (Belgabroed, Merksplas, Belgium). All eggs were set in a forced-draft incubator at specific dry bulb temperature of 37.6°C and wet bulb temperature of 29°C. The eggs were turned every hour until day 18 of incubation, when the eggs were candled and those with evidence of living embryos were transferred from turning trays to hatching baskets. Between 480 and 524 h of incubation, the eggs were checked every 2 h, and hatched chicks were sexed, marked with leg tags and weighed individually. Only female chicks were employed in this study. Newly hatched female chicks were evenly divided into immediate feed access and 48 h feed delay groups forthwith after removing from the incubator.
Early, middle and late hatchers and spread of hatch
After the total hatching period, a hatching curve of all the female chicks, approaching normal distribution, was obtained. Three hatching groups were defined according to
the standard deviation (σ) and average hatching time (µ) of the hatching curve: early hatchers (µ− 2σ ~µ− 1σ), middle hatchers (aroundµbut withµ− 1σ~µ+ 1σ as limits), and late hatchers (µ+ 1σ~µ+ 2σ). The duration of spread of hatch was calculated as the confidence interval of the hatching curve, namely spread of hatch = 4 ×σ.
According to the hatching time and feeding status of chicks, six experimental groups were established: namely early hatcher access to feed immediately (EI), early hatcher 48 h feed delay (ED), middle hatcher access to feed imme-diately (MI), middle hatcher 48 h feed delay (MD), late hatcher access to feed immediately (LI) and late hatcher 48 h feed delay (LD).
Feed intake and BW
The chicks (n= 45 per group) were raised at standard
conditions of light and temperature. A broiler corn-wheat-soybean-based starter diet (AVEVE, Merksem, Belgium) was provided ad libitum immediately when they were removed from the incubator or ad libitum after the 48 h feed delay process based on BA. Chicks had always free access to water. For daily feed intake study, 25 chicks from each group were further divided into three pens (n= 8, 8 and 9).
Feed intake and BW were recorded daily exactly at their BA up to 5 days post hatch. These BWs together with the hatch weight were used to calculate relative growth rate or BW loss. Relative growth= 100 × (Wt5−Wt0)/Wt0; Weight
loss = 100 × (Wt0−Wt2)/Wt0 where Wt0 is the weight at
hatch, Wt2 the weight at BA day 2; Wt5 the weight at
BA day 5.
Sampling
Ten chicks per hatching time were sampled at BA day 0 (immediately after being removed from the incubator; early, middle and late time of hatch was estimated based on experience of the hatching process, and verified by the hatching curve after the termination of complete hatching process). On BA day 2 (before the feed-delay group had access to feed) and BA day 5, 10 chicks from each group were sacrificed. At each sampling time, blood samples from the vena jugularis, residual yolk sac (BA day 0 and 2), breast muscle, liver and hatching muscle (BA day 0 and 2) were collected. Blood was centrifuged (3000 r.p.m., 15 min, 4°C) to obtain plasma which was stored at −20°C for further analysis. Liver and breast muscle were weighed to calculate the proportional organ weight (proportional organ weight (%) = 100 × organ weight/BW). The absolute weight of residual yolk sacs (at hatch and BA day 2) was recorded for yolk utilization comparison. The present experiment was approved by the Ethical Commission for Experimental Use of Animal of the KU Leuven.
Radioimmunoassay (RIA) of plasma T3
Plasma T3concentrations were measured by RIA as described
by Darras et al. (1991). The antisera for T3was purchased
Plasma glucose determination
Plasma glucose concentration was determined by a com-mercial kit (no. 298-65701; WAKO Pure Chemical Industries Ltd., Osaka, Japan). The assay was carried out according to manufacturer’s protocol.
Glycogen determination
A protocol based on the method of Dreilinget al.(1987) was employed to determine the glycogen concentration in the hatching muscle or liver. In short, tissue was homogenized in 7% HClO4(1µl/mg tissue). Homogenates were centrifuged
at 4°C at 14 000× g until a clear supernatant was obtained. The supernatant was washed with 1 ml of petroleum ether and stored at−20°C. An iodine colour reagent (0.39 ml of an iodine solution (0.104 g I2, 1.04 g KI2 in 4 ml of MQ
water)+ 30 ml of 10% CaCl2) was added to standards or
tissue extracts in a microtiter plate. After mixing and a reacting period of 10 min, the absorbance was measured at 450 nm (Victor 1420 Multilabel counter; PerkinElmer, MA, USA). Tissue glycogen concentration was calculated using a standard curve prepared with rabbit liver glycogen (Sigma, Bornem, Belgium).
Statistical analysis
All statistical analyses were performed with SAS version 9.2 (SAS Institute Inc., Cary, NC, USA). Comparisons between groups were performed using one-way ANOVA or a general linear model, with access to feed (yes/no) and time of hatching (early, middle and late) and their interaction as factors. The level of significance was set atP< 0.05. When
the means of the general linear model were statistically different, means were compared using least squares means with Tukey’s adjustment for multiple comparisons. All data are shown as average ± s.e.m.
Results
The hatching time and spread of hatch
Based on the hatching time of all the female chicks, a hatching curve approaching normal distribution was obtained (Figure 1). Theσ of the hatching curve of female chicks was 6 h 55 min. The hatching time (early, middle and late) of female chicks was divided by the µ and σ. The complete hatching period of female chicks lasted 44 h, but the spread of hatch of female chicks was 27 h 40 min (4×σ).
Daily feed intake
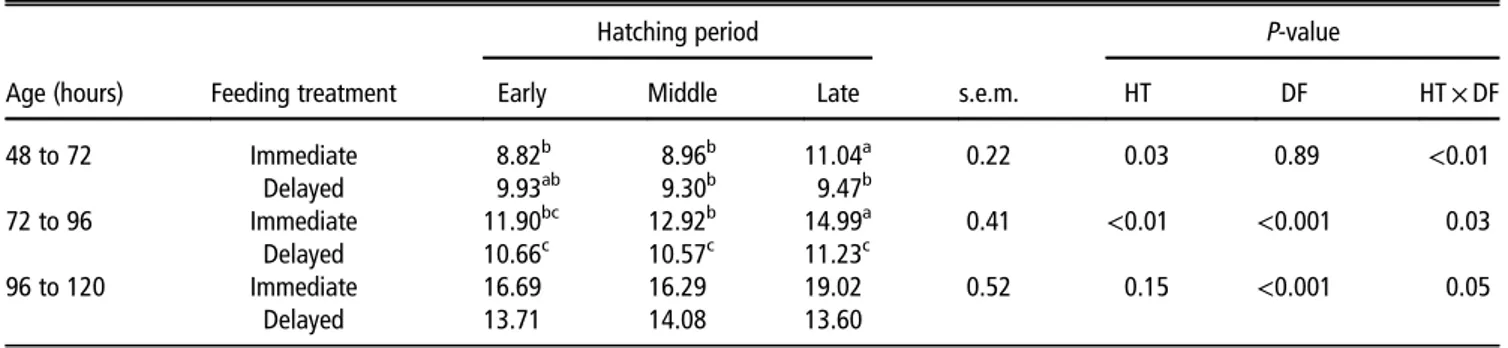
The interaction of feed delay and hatching time on daily feed intake was significant on BA day 3 (BA 48 to 72 h,P= 0.01)
and BA day 4 (BA 72 to 96 h, P= 0.03), and almost
significant on day 5 (BA 96 to 120 h, P= 0.05; Table 1).
Furthermore, spread of hatch had a significant effect on feed intake on BA day 3 (P= 0.03) and day 4 (P= 0.01), but not
on day 5. LI chicks had markedly higher daily feed intake than the EI and MI chicks on day 3 and day 4 (P< 0.01). At
BA day 5 feed intake of LI chicks was also 14% and 17%
higher than that of the EI (P= 0.15) and MI (P= 0.07)
groups, although these differences were not significant. After 48 h delay in feed access, the feed intake of the three hatch groups was similar. The effect of feeding treatment was significant on day 4 (P< 0.001) and day 5 (P< 0.001), but
not on day 3.
BW and relative growth rate
The three hatch groups had similar BW at hatch (Figure 2). The effect of hatching time, delay in feed access and their interaction were all significant from BA day 2 up until day 5 (P< 0.01). When chicks were fed immediately after hatch,
the BW of late hatchers was higher than their early and middle counterparts from day 2 up to day 5 (P< 0.01).
Moreover, after the 48 h fasting, the weight loss of each hatch group was not different, and the BW among the feed delay chicks was equal up to BA day 5 (data not shown).
The effect of hatching time and feeding treatment on the relative growth rate up to day 5 was significant (P< 0.01; P< 0.001), and they showed a pronounced interaction
(P< 0.001, Figure 3). More specifically, the LI chicks had
greater relative growth rate compared with the EI and MI chicks (P< 0.01), which were similar in this respect. When
feed access was delayed, there was no difference in relative growth rate between the three hatching groups.
Proportional breast muscle and liver weights
The hatching time did not affect the proportional breast muscle weight at hatch (data not shown). However, hatching time affected the proportional breast muscle on BA day 2 (P= 0.02, Table 2) and day 5 (P< 0.001, Table 3). The effect
of the feeding treatment was significant on BA day 2 (P< 0.01) and day 5 (P< 0.001). Moreover, the interaction
of hatching time and delay in feed intake was significant on BA day 2 (P= 0.03, Table 2), and almost significant on day 5
(P= 0.07, Table 3). When chicks were fed immediately after
hatch, the late hatchers had a higher proportional breast Figure 1 Hatching curve, early, middle and late hatchers and spread of hatch of female chicks (n= 469). Distance between two close dotted lines isσ.
muscle weight on BA day 2 compared with their early (P= 0.03) and middle (P< 0.01) hatched counterparts,
however this parameter did not differ between the fasted chicks (Table 2).
The spread of hatch did not influence the proportional liver weight at hatch. No effect of hatching time and feeding treatment or interactions were observed on BA day 2 and 5 (data not shown).
Absolute residual yolk weights
There was no effect of spread of hatch on the residual yolk weight at hatch (Table 4). However, the hatching time significantly affected the yolk weight on post hatch day 2 (P< 0.01, Table 2): the late hatchers had lower yolk sac
weights than their early and middle counterparts. The feeding treatment had no effect on the residual yolk weight on BA day 2, nor was there an interaction with the hatching time.
Liver glycogen content
At hatch, even though the effect of spread of hatch on the liver glycogen content was not statistically significant (P= 0.09, Table 4), the liver glycogen content of the late
hatchers was 111% higher than that of the early hatchers, and the middle hatchers had an intermediate value. The liver glycogen of LI chicks was 25% lower than that of MI and 18% lower than EI on BA day 2, but they were not statistically different (data not shown). In the chicks
subjected to 48 h of feed delay, on the other hand, the liver glycogen level was below the detection limit on BA day 2. The previous starvation significantly decreased the liver gly-cogen content on BA day 5 (P= 0.02). No effect of hatching
time, nor the interaction with the feeding treatment on the liver glycogen content was observed on BA day 5 (Table 3).
Hatching muscle glycogen contents
At hatch, the effect of spread of hatch on hatching muscle glycogen content was almost statistically significant (P= 0.07, Table 4). The glycogen content in the hatching
muscle was 69% higher for late hatchers than that of the early hatchers, and the middle hatchers had an intermediate value. The hatching muscle glycogen content was decreased at BA day 2 compared with that at hatch (Table 2). Delayed feed intake resulted in a lower hatching muscle glycogen content (P< 0.001). The effect of the hatching time was also
significant on BA day 2 (P= 0.02): the late hatchers had
higher hatching muscle glycogen content than the early hatchers (P= 0.02), and the middle hatchers had an
inter-mediate value. On BA day 2, no interaction between spread of hatch and feeding treatment was seen on this parameter.
Plasma glucose levels
The plasma glucose levels of newly hatched chicks were not affected by the hatching time (Table 4). The 48 h starvation period dramatically decreased the blood glucose level on BA Table 1Effects of hatching time and delay in feed intake on daily feed intake from BA 48 h up to BA 120 h
Hatching period P-value
Age (hours) Feeding treatment Early Middle Late s.e.m. HT DF HT× DF
48 to 72 Immediate 8.82b 8.96b 11.04a 0.22 0.03 0.89 <0.01 Delayed 9.93ab 9.30b 9.47b 72 to 96 Immediate 11.90bc 12.92b 14.99a 0.41 <0.01 <0.001 0.03 Delayed 10.66c 10.57c 11.23c 96 to 120 Immediate 16.69 16.29 19.02 0.52 0.15 <0.001 0.05 Delayed 13.71 14.08 13.60
BA= biological age; HT = hatching; DF = delay in feed intake; Immediate = fed immediately; Delayed = delay in feed intake.
a–cValues within the same age with different superscripts differ significantly atP< 0.05.
Figure 2 Effect of hatching time and feeding treatments (immediate access to feed and 48 h delay in feed access) on absolute BW up to biological age day 5 (n= 25). Data sharing no common letter are different between hatching times within the same feeding treatment (P < 0.05).
day 2 (P< 0.001). Moreover, the effect of spread of hatch
was significant (P= 0.04): the plasma glucose level was
higher in early hatchers than the late hatchers (P= 0.05),
and the middle hatchers had an intermediate value (Table 2). No interaction of hatching time and feeding treatment on the blood glucose level was observed on BA day 2.
Table 2Effects of hatching time and delay in feed intake on proportional breast muscle weight, residual yolk, hatching muscle glycogen content, plasma glucose and T3levels on BA day 2
Hatching period P-value
Performance parameters Feeding treatment Early Middle Late s.e.m. HT DF HT× DF
Proportional BM (%) Immediate 0.62bc 0.62c 0.74a 0.01 0.02 <0.01 0.03
Delayed 0.72ab 0.71abc 0.71abc
Residual yolk (g) Immediate 3.40 3.38 2.44 0.13 <0.01 0.92 0.78
Delayed 3.58 3.16 2.56 HM glycogen (µg/g) Immediate 115.0ab 149.7ab 197.2a 11.6 0.02 <0.001 0.30 Delayed 29.6c 99.4bc 75.1bc Glucose (mg/dl) Immediate 229.5a 227.3a 217.0ab 3.0 0.04 <0.001 0.99 Delayed 197.0bc 192.3c 185.7c Plasma T3(ng/ml) Immediate 1.89a 1.70a 1.68a 0.07 0.28 <0.001 0.53 Delayed 0.93b 0.97b 0.82b
BA= biological age; HT = hatching; DF = delay in feed intake; BM = breast muscle; Immediate = fed immediately; Delayed = delay in feed intake; HM = hatching muscle; Glucose= plasma glucose.
a–cValues within the same parameter with different superscripts differ significantly atP< 0.05.
Table 3Effects of hatching time and delay in feed intake on proportional breast muscle weight, liver glycogen content and plasma glucose level on BA day 5
Hatching period P-value
Performance parameters Feeding treatment Early Middle Late s.e.m. HT DF HT× DF
Proportional BM (%) Immediate 1.47b 1.72a 1.88a 0.04 <0.001 <0.001 0.07
Delayed 1.16c 1.43b 1.36bc
Liver glycogen (µg/mg) Immediate 4.13 4.96 7.76 0.58 0.62 0.02 0.16
Delayed 3.96 2.73 2.40
Glucose (mg/dl) Immediate 190.2b 197.4b 205.2ab 2.9 0.02 <0.01 0.49
Delayed 208.5ab 204.1ab 226.2a
BA= biological age; HT = hatching; DF = delay in feed intake; BM = breast muscle; Immediate = fed immediately; Delayed = delay in feed intake; Glucose = plasma glucose.
a–cValues within the same parameter with different superscripts differ significantly atP< 0.05.
Figure 3 Effect of hatching time and feeding treatments (immediate access to feed and 48 h delay in feed access) on relative growth up to biological age day 5 (n= 25). Data sharing no common letter are different between hatching times within the same feeding treatment (P < 0.05). HT = hatching time; DF= delay in feed intake.
On BA day 5, the blood glucose level was significantly higher in the chicks fed with a delay than their immediately fed counterparts (P< 0.01). The spread of hatch significantly
influenced the blood glucose on BA day 5 (P= 0.02): the
late hatchers had a higher level than the early hatchers (P= 0.03), and the middle hatchers had an intermediate
value (Table 3). There was no interaction between hatching time and feeding treatments on blood glucose level on BA day 5.
Plasma T3levels
The plasma T3levels at hatch were significantly higher in the
early hatchers than the middle and late hatchers (P= 0.02,
0.04, Table 4). However, on BA day 2, the spread of hatch had no effect on the blood T3 levels. The feed delay
decreased the plasma T3 levels on day 2 compared with
chicks that had access to feed immediately (P< 0.001,
Table 2). No interaction of hatching time and feeding treat-ment was observed on BA day 2. The effect of hatching time, feeding treatment and their interaction on T3level were not
significant on BA day 5 (data not shown). Discussion
Spread of hatch
The spread of hatch is a factor that potentially contributes to the different chick qualities and physiological traits in one batch of hatched chicks (Decuypere et al., 2001; Careghi
et al., 2005). Therefore, the effect of spread of hatch on post hatch performance and its potential mechanisms are of interest and importance.
Hatching time is known to be influenced by factors such as parental age, egg storage time and conditions, and incuba-tion condiincuba-tions (temperature, humidity, air velocity, etc.) and gender (Tonaet al., 2003b; Careghiet al., 2005; Decuypere and Bruggeman, 2007). To limit the number of affecting factors, eggs from the same youngflock, that were laid on the same day were chosen, with very short storage period (1 to 2 days) before incubation and were incubated in one incubator but switched eggs location in the incubator daily. After hatch, only female chicks were employed in the
present study. Hence, genetic and nutritional variation between eggs might be two major factors that affected the spread of hatch in this experiment. Additionally, the standard deviation was used as a criterion to partition the different hatching time, which resulted in a quantifiable and repea-table design to perform experiments investigating the spread of hatch.
The present study showed that the spread of hatch did not affect the hatch weight, which is consistent with observation of Careghi et al. (2005) and van de Ven et al. (2011). In addition, no difference in residual yolk weight was found at hatch, which agrees with Careghiet al. (2005). van de Ven
et al. (2011), on the other hand, observed a lower residual yolk weight at hatch for the late hatchers, whereas in the present study this was only seen on BA day 2.
The process of hatching is dependent on the proper development of the supporting musculature, especially the hatching muscle (Musculus complexus), and the available energy storage (Decuypereet al., 1990). The higherliver and hatching muscle glycogen at hatch of the late hatchers sug-gests that the late hatchers stored more energy during incubation, and/or consumed less which brought about the later hatching of these birds. As embryonic metabolism and the hatching time are known to be determined by regulators of thyroid hormone availability and action (Becket al., 2005; Van Hercket al., 2013), differences concerning these factors between eggs of one batch might also have induced differences in the spread of hatch.
It is well known that thyroid hormones affect the time of hatching and hence the length of incubation and play a crucial role during chicken post hatch development (Decuypereet al., 1990). In accordance with the study of van de Venet al. (2011), the early hatchers had higher levels of plasma T3 in the present study, which also agrees with
findings of Decuypereet al. (1990) showing that treatment of embryos with T3on embryonic day 19 advanced hatching
time. As it was reported that T3could decrease the liver and
skeletal muscle glycogen (Potenzaet al., 2009; Ribeiroet al., 2012), through glycogen synthase kinase 3 β (GSK 3 β) (Kuzman et al., 2005), the higher plasma T3level of early
hatchers at hatch is consistent with the lower glycogen in liver and hatching muscle.
When chicks had access to feed immediately after hatch, the late hatchers grew faster than chicks that hatched earlier. This improved growth performance of the late chicks, when measured on their BA, is in agreement with Careghi et al. (2005). However, it is notable that when the CA was used to measure the BW in former investigations, no difference or even a decreased growth performance was observed for the late hatchers (Careghiet al., 2005; van de Venet al., 2011). Interestingly, despite the higher BW of the late hatchers on BA day 2 and 5, the proportion of the breast muscle to BW of the late chicks was still higher than the other two fed hatchers.
It is worth noting that the augmented metabolic rate caused by T3is normally accompanied by an increased feed
intake (Konget al., 2004). In the present study, however, the early hatched chicks were characterized by higher plasma T3
Table 4Effect of hatching time on residual yolk weight, liver glycogen content, hatching muscle glycogen content, plasma glucose and T3
levels at hatch (BA day 0)
Hatching period
Performance parameters Early Middle Late s.e.m. P-value Residual yolk (g) 8.47 8.08 8.98 0.38 0.64 Liver glycogen (µg/mg) 1.82 3.04 3.84 0.37 0.09 HM glycogen (µg/g) 179.1 279.1 301.8 23.3 0.07 Plasma glucose (mg/dl) 205.4 208.6 209.4 3.0 0.87 Plasma T3(ng/ml) 4.68a 2.69b 2.90b 0.37 0.04
BA= biological age; HM = hatching muscle.
a,bValues within the same parameter with different superscripts differ significantly
levels yet had lower feed intake at the beginning of their post hatch life, indicating that factors other than T3are involved in
manipulating the energy intake.
The different hatching time did not affect the blood glucose level at hatch, which disagrees with van de Venet al. (2011) who observed a higher plasma glucose for the late hatchers compared to their earlier hatched counterparts, suggesting that more glucose was available for the late hatchers. In our study, as the late hatchers started their post hatch life with a higher hepatic glycogen reserve and had equal (or even somewhat lower) levels of hepatic glycogen on day 2, they consumed more glucose than their early counterparts, as also implicated by the higher feed intake but a lower plasma glucose concentration on BA day 2. The available glucose on these first two post hatch days might have stimulated the utilization of yolk lipids, as the intermediate of the TCA cycle is then used for lipolysis (Bergman and Kon, 1964; Ørngreenet al., 2009), resulting in a lower residual yolk of the late hatched chicks on day 2. This glucose and yolk consumption hypothesis was also true for the fasted chicks. Consequently, all these factors together with the higher feed intake and increased yolk utilization more than probably caused the higher BW (from day 2 onwards) of the fed late hatchers.
Delay in feed access
In practice, thefirst feed of chicks is commonly delayed due to the logistics of commercial production (Kornasio et al., 2011). The 48 h of feed delay resulted in retarded early growth which is in agreement with reports from Bigotet al.
(2003a) and Careghi et al. (2005). According to Noy and Sklan (2001), feed deprivation results in a slower yolk con-sumption in the newly hatched chicks, which is caused by a poor stimulation of the development of the gastro-intestinal tract. Nevertheless, in this experiment no effect of fasting was observed on yolk sac utilization, which is analogous to some previous observations (Careghi et al., 2005; Gaglo-Disseet al., 2010).
Interestingly, when these chicks had access to feed, the feed intake was lower than their immediately fed counter-parts, which implies that delayed feed access had impaired the feed intake which potentially further aggravated the growth retardation. In addition, the effects of hatching time on feed intake and relative growth observed in immediately fed chicks were eliminated by the 48 h feed delay. The reduction in relative growth rate caused by the delayed feed access was larger in the late hatchers than the other two hatching time groups (Figure 3, the smaller figure), which indicated that the 48 h feed delay had more impact on the late hatchers. Indeed, the advantage of the late hatchers, whether caused by nutrient availability or genetic potential, disappeared due to the 48 h feed delay. In the same line, Bigotet al. (2003a) found that post hatch starvation reduced interfamily variation in BW that is expressed in chicks given immediate access to feed, which may mask the expression of the genetic potential. Surprisingly, the increased yolk con-sumption of late hatchers from hatch to day 2 compared with
their earlier counterparts, was also observed for the feed deprived chicks, however, without any effect on BW (loss).
In accordance with previous studies (Decuypere and Kühn, 1984; Careghiet al., 2005), decreased plasma T3levels were
observed immediately after the feed delay, which might be an adaptation in order to reduce oxygen consumption and metabolism.
Very similar to a former report (Decuypere and Kühn, 1984), the blood glucose level of previous starved chicks was significantly higher than their immediately fed counterparts after refeeding (BA day 5), although their feed intake was markedly lower at that time.
The proportional breast muscle weight on day 2 was higher when chicks were starved for thefirst 48 h of their life, while it was proportionally lower on day 5 compared with their fed counterparts. As the intestines are barely develop-ing durdevelop-ing the early post hatch starvation, the breast muscle takes a good proportion of the BW, while on day 5, when the starved chicks had access to feed, their intestines were most probably developing fast, which resulted in a proportionally lower breast muscle weight compared with their fed coun-terparts. The retardation in muscle development has been shown by several authors. Bigot et al. (2003b) concluded that muscle ribosomal S6 kinase 1 (S6K1), a key element in the control of protein synthesis, is activated only when food is available, without an altered improvement on the response of the S6K1 pathway after post hatch starvation. Addition-ally, another study suggested that early nutritional status affected the percentage of musclefiber type and changed the mRNA expression for the growth-related genes in muscle (Liet al., 2007). Interestingly, Kornasioet al. (2011) reported that delayed feed access (36 h post hatch) declined the number of the breast muscle cells and myofiber diameter in post hatch chicks.
In conclusion, when chicks were immediately fed after hatch, the spread of hatch influenced post hatch perfor-mance: chicks hatched later benefitted from a better appetite and faster growth at least until day 5. In this experimental set-up, the spread of hatch was due to their genetic poten-tial, or the availability/consumption of less nutrients during embryonic development. The different T3levels at hatch may
have contributed to the distinct post hatch performance, although other factors might be involved in the differential feed intake, which is under further investigation in our lab. Delayed feed intake diminished the‘non-uniformity’ caused by the different hatching time, but induced growth retarda-tion compared with the chicks immediately fed after hatch, which was more pronounced for the late hatchers.
Acknowledgements
The authors would like to thank the technical staff Andre Respen, Marcel Samain, Inge Vaesen and Daniel Vermeulen of the Division of Livestock-Nutrition-Quality of the KU Leuven. This research was funded by the ‘Fonds Wetenschappelijk Onderzoek– Vlaanderen’ (FWO G.0620.11N). Dr Nadia Everaert is a post-doctoral fellow of FWO.
References
Beck V, Roelens SA, Maervoet J, Schepens P and Darras VM 2005. Interaction of PCBs with thyroid hormone levels and time of hatching in chicken embryos. Annals of the New York Academy of Sciences 1040, 224–226.
Bergman EN and Kon K 1964. Acetoacetate turnover and oxidation rates in ovine pregnancy ketosis. The American Journal of Physiology 206, 449–452. Bigot K, Mignon-Grasteau S, Picard M and Tesseraud S 2003a. Effects of delayed feed intake on body, intestine, and muscle development in neonate broilers. Poultry Science 82, 781–788.
Bigot K, Taouis M, Picard M and Tesseraud S 2003b. Early post-hatching starvation delays p70 s6 kinase activation in the muscle of neonatal chicks. The British Journal of Nutrition 90, 1023–1029.
Careghi C, Tona K, Onagbesan O, Buyse J, Decuypere E and Bruggeman V 2005. The effects of the spread of hatch and interaction with delayed feed access after hatch on broiler performance until seven days of age. Poultry Science 84, 1314–1320. Darras VM, Vanderpooten A, Huybrechts LM, Berghman LR, Dewil E, Decuypere E and Kühn ER 1991. Food intake after hatching inhibits the growth hormone induced stimulation of the thyroxine to triiodothyronine conversion in the chicken. Hormone and Metabolic Research 23, 469–472.
Decuypere E and Kühn ER 1984. Effect of fasting and feeding time on circadian rhythms of serum thyroid hormone concentrations, glucose, liver monodeiodinase activity and rectal temperature in growing chickens. Domestic Animal Endocrinology 1, 251–262.
Decuypere E and Bruggeman V 2007. The endocrine interface of environmental and egg factors affecting chick quality. Poultry Science 86, 1037–1042. Decuypere E, Dewil E and Kuhn ER 1990. The hatching process and the role of hormones. In Avian incubation (ed. SG Tullett), pp. 239–256. Butterworth-Heinemann Publishing, London, UK.
Decuypere E, Tona K, Bruggeman V and Bamelis E 2001. The day-old chick: a crucial hinge between breeders and broilers. World’s Poultry Science Journal 57, 127–138.
Dreiling CE, Brown DE, Casale L and Kelly L 1987. Muscle glycogen: comparison of iodine binding and enzyme digestion assays and application to meat samples. Meat Science 20, 167–177.
Gaglo-Disse A, Tona K, Aliou S, Debonne M, Aklikokou K, Gbeassor M and Decuypere E 2010. Effect of delayed feed access on production and blood parameters of layer-type chicks. Acta Veterinaria Hungarica 58, 211–219. Kong WM, Martin NM, Smith KL, Gardiner JV, Connoley IP, Stephens DA, Dhillo WS, Ghatei MA, Small CJ and Bloom SR 2004. Triiodothyronine stimulates food intake
via the hypothalamic ventromedial nucleus independent of changes in energy expenditure. Endocrinology 145, 5252–5258.
Kornasio R, Halevy O, Kedar O and Uni Z 2011. Effect of in ovo feeding and its interaction with timing offirst feed on glycogen reserves, muscle growth, and body weight. Poultry Science 90, 1467–1477.
Kuzman JA, Gerdes AM, Kobayashi S and Liang Q 2005. Thyroid hormone activates Akt and prevents serum starvation-induced cell death in neonatal rat cardiomyocytes. Journal of Molecular and Cellular Cardiology 39, 841–844. Li Y, Yuan L, Yang X, Ni Y, Xia D, Barth S, Grossmann R and Zhao RQ 2007. Effect of early feed restriction on myofibre types and expression of growth-related genes in the gastrocnemius muscle of crossbred broiler chickens. The British Journal of Nutrition 98, 310–319.
Noy Y and David S 1999. Different types of early feeding and performance in chicks and poults. The Journal of Applied Poultry Research 8, 16–24. Noy Y and Sklan D 2001. Yolk and exogenous feed utilization in the posthatch chick. Poultry Science 80, 1490–1495.
Ørngreen MC, Jeppesen TD, Andersen ST, Taivassalo T, Hauerslev S, Preisler N, Haller RG, Van Hall G and Vissing J 2009. Fat metabolism during exercise in patients with McArdle disease. Neurology 72, 718–724.
Potenza M, Via MA and Yanagisawa RT 2009. Excess thyroid hormone and carbohydrate metabolism. Endocrine Practice : Official Journal of the American College of Endocrinology and the American Association of Clinical Endocrinologists 15, 254–262.
Ribeiro LFP, Teixeira IP, Aparecido da Silva G, Dalia RA, Júnior MC, Bertolini NO, Rostom de Mello MA and Luciano E 2012. Effects of swimming training on tissue glycogen content in experimental thyrotoxic rats. Canadian Journal of Physiology and Pharmacology 90, 587–593.
Tona K, Bamelis F, De Ketelaere B, Bruggeman V, Moraes VMB, Buyse J, Onagbesan O and Decuypere E 2003a. Effects of egg storage time on spread of hatch, chick quality, and chick juvenile growth. Poultry Science 82, 736–741. Tona K, Malheiros RD, Bamelis F, Careghi C, Moraes VMB, Onagbesan O, Decuypere E and Bruggeman V 2003b. Effects of storage time on incubating egg gas pressure, thyroid hormones, and corticosterone levels in embryos and on their hatching parameters. Poultry Science 82, 840–845.
Van de Ven LJF, Van Wagenberg AV, Debonne M, Decuypere E, Kemp B and Van den Brand H 2011. Hatching system and time effects on broiler physiology and posthatch growth. Poultry Science 90, 1267–1275.
Van Herck S, Geysens S, Delbaere J and Darras VM 2013. Regulators of thyroid hormone availability and action in embryonic chicken brain development. General and Comparative Endocrinology 190, 96–104.