Cofactor Binding Modulates the Conformational Stabilities and
Unfolding Patterns of NAD
ⴙ-dependent DNA Ligases from
Escherichia coli and Thermus scotoductus*
Received for publication, July 18, 2003, and in revised form, September 12, 2003 Published, JBC Papers in Press, September 30, 2003, DOI 10.1074/jbc.M307761200 Daphne´ Georlette‡§, Vinciane Blaise‡, Christophe Dohmen‡, Fabrice Bouillenne¶,
Benjamin Damien储, Eric Depiereux储, Charles Gerday‡, Vladimir N. Uversky**‡‡, and Georges Feller‡§§
From the ‡Laboratory of Biochemistry, Institute of Chemistry B6 and¶Laboratoire d’Enzymologie et Centre d’Inge´nierie des Prote´ines, Institute of Chemistry B6, University of Lie`ge, B-4000 Lie`ge, Belgium,储Unite´ de Biologie Mole´culaire, De´partement de Biologie, Faculte´s Universitaires Notre-Dame de la Paix, B-5000 Namur, Belgium, **Institute for Biological Instrumentation, Russian Academy of Sciences, Pushchino, Moscow Region 142290, Russia, and
‡‡Department of Chemistry and Biochemistry, University of California, Santa Cruz, California 95064
DNA ligases are important enzymes required for cel-lular processes such as DNA replication, recombination, and repair. NADⴙ-dependent DNA ligases are essentially restricted to eubacteria, thus constituting an attractive target in the development of novel antibiotics. Although such a project might involve the systematic testing of a vast number of chemical compounds, it can essentially gain from the preliminary deciphering of the conforma-tional stability and structural perturbations associated with the formation of the catalytically active adenylated enzyme. We have, therefore, investigated the adenyla-tion-induced conformational changes in the mesophilic Escherichia coli and thermophilic Thermus scotoductus NADⴙ-DNA ligases, and the resistance of these enzymes to thermal and chemical (guanidine hydrochloride) de-naturation. Our results clearly demonstrate that an-choring of the cofactor induces a conformational rear-rangement within the active site of both mesophilic and thermophilic enzymes accompanied by their partial compaction. Furthermore, the adenylation of enzymes increases their resistance to thermal and chemical de-naturation, establishing a thermodynamic link between cofactor binding and conformational stability enhance-ment. Finally, guanidine hydrochloride-induced unfold-ing of NADⴙ-dependent DNA ligases is shown to be a complex process that involves accumulation of at least two equilibrium intermediates, the molten globule and its precursor.
DNA ligases form a large family of evolutionarily related proteins that play important roles in a wide range of DNA transactions, including chromosomal DNA replication, DNA
repair, and DNA recombination in all three kingdoms of life (1). Cofactor requirements divide the ligases into two subfamilies, the NAD⫹-dependent DNA ligases and the ATP-dependent DNA ligases. Regardless of their energy source, they catalyze the sealing of 5⬘-phosphate and 3⬘-hydroxyl termini at nicks in duplex DNA by means of three distinct catalytic events (1). The first step involves activation of the ligase through the forma-tion of a covalent adenylated intermediate by transfer of the adenyl group of NAD⫹ or ATP to the⑀-NH2 of a conserved lysine residue in the DNA ligase. In the second step the AMP moiety is transferred from the DNA ligase to the 5⬘-phosphate group at the single-strand break site, creating a new pyrophos-phate bond. Finally, the phosphodiester bond formation is achieved upon an attack of the 3⬘-OH group of the DNA on the activated 5⬘-group with the concomitant release of AMP (1).
At least one NAD⫹-dependent DNA ligase (referred to as LigA) is found in every bacterial species (2). The bacterial LigA enzymes are of fairly uniform size (⬃70 kDa) and display extensive amino acid sequence conservation throughout the entire protein (3– 4). The atomic structures of the LigA en-zymes from Bacillus stearothermophilus (N-terminal domain) (5) and Thermus filiformis (3) have been determined by x-ray crystallography. The catalytic core of the bacterial NAD⫹ -de-pendent DNA ligase consists of adenylation (also named nucle-otidyltransferase) and oligomer binding-fold domains (domain 1 and 2, respectively) and corresponds to the catalytic domain described for eukaryotic ATP-dependent DNA ligases. The core is flanked by a short N-terminal domain (Ia) and three C-terminal domains, a tetracysteine domain that binds a single zinc atom (subdomain 3a), a helix-hairpin-helix domain (sub-domain 3b), and a BRCT (sub-domain (named after the C terminus of the breast cancer susceptibility gene product BRCA1) (do-main 4). ATP-dependent ligases are essentially found in bacte-riophages, Archaea, viruses, and eukaryotes. Compared with NAD⫹ligases they are more diverse in size but share a common ligase domain (formed by domains 1 and 2) referred to as the “catalytic core.” This domain contains six conserved sequence motifs, I, III, IIIa, IV, V-VI, that define a family of related nucleotidyltransferases including mRNA-capping enzymes as well as RNA and tRNA ligases (6). Some ATP ligases are flanked by additional domains that are likely to be implicated in the enzyme specialization, targeting the various ATP DNA ligases to different pathways in DNA repair and replication (for review see Refs. 7 and 8). NAD⫹and ATP DNA ligases have minimal sequence identity. However, the tertiary structures of * This work was supported by European Union Grant CT970131,
Re´gion Wallonne Grants Bioval 981/3860, Bioval 981/3848, and Initia-tive 114705, Fonds National de la Recherche Scientifique Belgium Grant 2.4515.00, and by the Institut Polaire Franc¸ais. The purchase of the Jasco 810 equipment was supported in part by a grant from the Fonds de la Recherche Fondamentale et Collective (Contract 2.4545.01). The costs of publication of this article were defrayed in part by the payment of page charges. This article must therefore be hereby marked “advertisement” in accordance with 18 U.S.C. Section 1734 solely to indicate this fact.
§ Present address: Dept. of Molecular and Cell Biology, Division of Biochemistry and Molecular Biology, University of California, Berke-ley, CA 94720-3204.
§§ To whom correspondence should be addressed. Tel.: 32-4-366-33-43; Fax: 32-4-366-33-64; E-mail: gfeller@ulg.ac.be.
the catalytic cores (made up of adenylation and oligomer bind-ing-fold domains) are quite well conserved (4, 5, 7), and NAD⫹ -dependent DNA ligases exhibit some homology with motifs I-VI that are conserved in ATP-dependent DNA ligases (4, 9). Fur-thermore, as observed for the ATP-dependent isozymes, motifs I-V are located within the catalytic core of the NAD⫹ligases, indicating that the active site has been conserved between both types of enzymes (4). The conservation and similarity of these structural features strongly suggest that the two types of li-gases have evolved from a common ancestor and are likely to have a similar basic reaction mechanism. The divergence may have largely arisen from the need to accommodate different nucleotide cofactors (9).
The high degree of conservation of eubacterial DNA ligases and their cofactor specificity have led to the assumption that these enzymes may be a potential target for new bactericidal drugs (5). Such inhibitors would act by blocking the reaction of the enzyme with NAD⫹, leading to an inactive enzyme and, thus, growth arrest of the eubacterium. The drug binding site would ideally be unique to, and conserved among NAD⫹-DNA ligases but absent from ATP-dependent ligases and other es-sential NAD⫹-requiring enzymes. To date some effective inhib-itors of NAD⫹-dependent DNA ligase have been isolated (10 – 11). The development of an efficient bactericidal drug can essentially gain from the understanding of the conformational changes accompanying the catalysis of NAD⫹ligases and from the deciphering of the structural components of NAD⫹ligases interacting specifically with NAD⫹. Comprehension of these mechanisms would allow the identification of the enzyme re-gion(s) that are targeted by drugs. In this view, major advances have been brought out by the resolution of the structure of the NAD⫹ligase from T. filiformis DNA ligase (3). In this work it has been suggested that adenylation acts as a conformational switch, leading to the closure of the enzyme and the adoption of an active toroidal conformation able to bind DNA. Such a conformational change is likely to prevent the formation of non-productive ligase-DNA complexes in the cell. Additional information has also been drawn from the investigation of the role of Escherichia coli domain Ia (12). This domain, unique to NAD⫹-dependent ligases, is essential for the reaction with NAD⫹. To gain further advances in the comprehension of the structural changes occurring upon adenylation, we have inves-tigated the unfolding pathways of deadenylated and adeny-lated DNA ligase from the mesophile E. coli and compared them with those obtained for the thermophile Thermus
scotoductus.
EXPERIMENTAL PROCEDURES
Chemicals—3-(1-Pyridinio)-1-propane sulfonate and acrylamide were from Fluka (Buchs, Switzerland).-NAD⫹,-NMN, and
8-anilino-1-naphtalene sulfonic acid (ANS)1were from Sigma-Aldrich. Guanidine
hydrochloride (GdmCl, ultra pure) was from ICN Biomedicals Inc. (Irvine, CA). Water used for the experiments was purified over a Milli-Q water purification system from Millipore, and all solutions were filtered through 0.22-m filters before use.
Protein Expression and Purification—Plasmid encoding E. coli DNA
ligase (Eclig) was a generous gift from V. Sriskanda and S. Shuman (13). The pET-EcoLIG plasmid (13) was digested with NdeI and BamHI, and the insert was cloned into pET23a plasmid, leading to the pression of an untagged protein. The recombinant Eclig was overex-pressed and purified as previously described (14). Plasmid encoding Tslig was a kind gift from Z. O. Jo´nsson and G. Eggertsson (15). The recombinant wild-type Tslig was overexpressed and purified as
previ-ously described (14). Protein concentration was determined with the Coomassie protein assay reagent (Pierce) using bovine serum albumin as standard. N-terminal sequencing confirmed the integrity of recom-binant proteins. As previously reported for NAD⫹-dependent DNA
li-gases (5, 16 –24), the native recombinant enzymes are produced in an adenylated form; differential scanning calorimetry (DSC) and fluores-cence and circular dichroism profiles of the native and adenylated Eclig and Tslig (after incubation with NAD⫹) are almost superimposable.
Deadeny(ly)lation/Adeny(ly)lation of NAD⫹-DNA Ligases—Strictly
speaking, the proteins are deadenylylated or adenylylated. The short-ened terms in use in the literature will be also used here. Eclig and Tslig stock solutions were either deadenylated or adenylated according to Timson and Wigley (25) by adding excess-NMN or -NAD⫹, respec-tively. The ratio [NMN/NAD⫹]/[ligase] was⬃80.
Deadenylated/adeny-lated mixtures were then incubated at 25 °C (Eclig) and 65 °C (Tslig) for 30 min and then cooled rapidly on ice. Under such conditions, efficiency of the deadenylation/adenylation reactions was more than 95%. When required, protein solutions were dialyzed against the appropriate buffer before experiments.
DSC—DSC measurements were performed using a MicroCal
MCS-DSC instrument at a scan rate of 60 K h⫺1and under 2 atm of nitrogen pressure. Samples (⬃4 mg/ml) were dialyzed overnight against 30 mM MOPS, 50 mMKCl, pH 7.6. To decrease aggregation that distorts the calorimetric traces and impairs deconvolution processes, a non-deter-gent sulfobetaine (3-(1-pyridinio)-1-propane sulfonate) was added be-fore DSC experiment (26) to a final concentration of 0.5Mand 0.75Mfor Eclig and Tslig, respectively. Thermograms were analyzed according to a non-two-state model in which Tm, ⌬Hcal, and ⌬Heffof individual
transitions are fitted independently using the MicroCal Origin software (version 2.9). All scans were found to be irreversible under the experi-mental conditions used for these studies.
GdmCl-induced Unfolding Transitions—Eclig and Tslig
deadeny-lated/adenylated samples were incubated overnight at 25 °C in the presence of various concentrations of GdmCl. Unfolding curves were
1The abbreviations used are: ANS, 8-anilino-1-naphtalene sulfonic
acid; AEW, average emission wavelength; Eclig, E. coli DNA ligase; GdmCl, guanidine hydrochloride; FI, fluorescence intensity; MG, mol-ten globule; PMG, pre-molmol-ten globule; Tslig, T. scotoductus DNA ligase; DCS, differential scanning calorimetry; MOPS, 4-morpholinepropane-sulfonic acid; N, native; U, unfolded.
FIG. 1. Strern-Volmer plots of fluorescence quenching by ac-rylamide. Quenching experiments of deadenylated (open symbols) and adenylated (closed symbols) Eclig (A) and Tslig (B) were conducted at 30 °C in 20 mMphosphate sodium, 50 mMNaCl, pH 7.6.
Stability and Unfolding of NAD
-dependent DNA Ligases
determined by monitoring the intrinsic fluorescence emission or far UV circular dichroism at 25 °C. The pH was checked to ensure a constant value throughout the whole transition, and the denaturant concentra-tion was determined from refractive index measurements (27) using a R5000 hand refractometer from Atago.
Fluorescence Measurements—Both intrinsic and ANS fluorescence
emission spectra were recorded on an Aminco SLM 8100 spectrofluo-rimeter. Excitation and emission slit widths were 2 and 4 nm, respec-tively, and the scan speed was 350 nm min⫺1. Cuvettes with a 1-cm path length were used.
Intrinsic fluorescence measurements were performed using a protein concentration of 25g/ml (⬃0.33 M) in 20 mMphosphate sodium, 50 mMNaCl, pH 7.6, in the presence of various GdmCl concentrations, with excitation at 280 nm and emission spectra recorded from 300 to 440 nm. With all samples fluorescence spectra were corrected for the background fluorescence of the solution (buffer ⫹ denaturant). Two fluorescence parameters have been considered in this work, the fluo-rescence intensity at single excitation and emission wavelengths (fluo-rescence intensity (FI)) and the average emission wavelength (AEW) (28). The latter reflects changes in the shape of the spectrum as well as in position. Because it is an integral measurement, it has less error than measurements at a single wavelength (i.e.max).
ANS fluorescence measurements were performed with the samples used for intrinsic fluorescence measurements, with excitation at 390 nm and emission spectra recorded from 420 to 600 nm. ANS fluores-cence spectra were corrected for the background fluoresfluores-cence of ANS. The ratio [ANS]/[ligase] was⬃250. Deconvolution of ANS curves was performed using the LabCalc software.
Phase diagrams describing GdmCl-induced changes of fluorescence intensities were constructed as previously reported (29 –34). The es-sence of this method, which is extremely sensitive for the detection of intermediate states, is to build up the diagram of I1versus I2, where
I1and I2are the spectral intensity values measured at wavelengths1 and2 under different experimental conditions for a protein undergo-ing structural transformations. The relationship between I1and I2is described by the equation I(1)⫽ a ⫹ bI(2). The calculations allowing
the determination of such equation as well as the composition of a and
b can be found elsewhere (32, 34). As a rule,1 and 2 are arbitrary
wavelengths of the spectrum, but in practice such diagrams are more informative if1 and 2 are on different slopes of the spectrum. If the wavelengths are both from one slope or near the maximum some tran-sitions may remain undetected.
Stern-Volmer Quenching—The conformational state of enzymes was
further characterized by acrylamide-induced fluorescence quenching. Samples were prepared in 20 mMsodium phosphate buffer, 50 mM NaCl, pH 7.6, and the protein concentrations were adjusted to provide an optical density at the excitation wavelength less than 0.1. Aliquots of a 1.2Macrylamide stock solution were consecutively added to 1 ml of protein solution to increase acrylamide concentration by⬃5 mMsteps.
Experiments were performed using excitation at 295 nm with fluores-cence emission set at 330 nm for Eclig and 333 nm for Tslig (excitation and emission slit widths were 1 and 4, respectively), and the fluores-cence intensities were recorded at 30 °C for 30 s. Experiments were performed in triplicate. The data were corrected for the dilution effects and for the absorptive screening caused by acrylamide (⑀295 nm⫽ 0.25
M⫺1cm⫺1for acrylamide). Quenching data were plotted as the ratio of fluorescence in the absence of quencher (F0) to the intensity in the
presence of quencher (F) against quencher concentration. The resulting data were fit to dynamic parameters according to the Stern-Volmer equation F0/F⫽ 1 ⫹ KSV[Q], where KSVis the Stern-Volmer quenching
constant and [Q] the quencher concentration (35).
Circular Dichroism Measurements—Circular dichroism (CD) spectra
were recorded at 25 °C using a CD6 Jobin Yvon spectropolarimeter under constant nitrogen flow. Spectra were recorded in the far UV region with a 0.1-cm path length cell at protein concentrations of⬃0.25 mg/ml. The buffer used was 20 mMsodium phosphate, 50 mMNaCl, pH 7.6, in the presence of the desired GdmCl concentrations. Spectra were acquired at a scan speed of 20 nm min⫺1, with a 2-nm bandwidth and a 1-s integration time. Spectra were averaged over five scans and corrected for the contribution of the solvent. Raw data were expressed in terms of the mean residue ellipticity [] using the known mature adenylated Eclig (molecular weight⫽ 74,020 Da) and Tslig (molecular weight⫽ 76,855 Da) sequences for calculation of the mean residue weight.
Unfolding of adenylated ligases as a function of GdmCl concentra-tions were recorded at 222 nm using a 2-nm bandwidth. At all dena-turant concentrations at least 30 data points were acquired over 1 min (2-s integration time) and averaged. The resulting values were cor-rected for the contribution of the solvent. An estimate of the helical content (fH) of NAD⫹-DNA ligases has been determined according to the relation []222⫽ ⫺30,300fH⫺ 2340 (36).
Size Exclusion Chromatography—Hydrodynamic dimensions (Stokes
radius, RS) of adenylated NAD⫹ligases in different conformational states were measured by gel filtration. Size exclusion chromatography was performed on the Superdex 200 H/R 10/30 prepacked fast protein liquid chromatography column calibrated according to Uversky (37). Protein solutions (⬃0.25 mg/ml) containing the required concentrations of GdmCl were loaded onto the column equilibrated with the same buffer. The elution was carried out isocratically at a flow rate of 1.0 – 0.5 ml/min and monitored by the absorbance at 280 nm. All measurements were made at 25 °C. Molecular Stokes radii (RS) were estimated from elution volume Velmeasured according to the experimental equation
RS⫽ (1000/V
el⫺ 42.44)/0.9114. The accuracy of determination of R
Sby this equation is about 5%.
RESULTS AND DISCUSSION NAD⫹-DNA Ligases Are Predicted to
Unfold through Intermediates
Recently it has been reported (38) that the propensity of a protein to form an equilibrium intermediate(s), I, may be de-termined by the bulk content of hydrophobic and charged
TABLE I
Thermodynamic parameters of heat-induced unfolding of NAD⫹-DNA ligases
Enzyme Tmaxa nb Tmc ⌬Hcald ⌺ ⌬Hcal
°C °C kJ mol⫺1 kJ mol⫺1 Eclig Deadenylated 46.1 2 44.2 469 892 46.5 423 Adenylated 53.9 2 51.6 615 1059 54.1 444 Tslig Deadenylated 89 2 88.9 904 1649 96.6 96.5 745 Adenylated 95.2 3 91.8 301 1729 101.3 95.6 1009 101.4 419 aT
maxcorresponds to the temperature at the top of the peak. bn refers to the number of calorimetric domains (unfolding of discrete protein domains) identified by deconvolution of DSC thermograms and allowing simulation of the experimental trace.
cT
mis the melting point of the unfolding transition. d⌬H
calis the calorimetric enthalpy obtained by integration of the transition surface.
FIG. 2. Adenylation-induced structural changes in NADⴙ-DNA ligases recorded by microcalorimetry (differential scanning cal-orimetry). Dashed line, deadenylated ligase; solid line, adenylated ligase. The corresponding thermodynamic parameters are given in Ta-ble I. All thermograms are base-line-subtracted and normalized for protein concentrations.
amino acid residues. Indeed, determination of the mean hydro-phobicity⬍H⬎ and the mean net charge ⬍R⬎ in proteins allow the discrimination between unfolding of proteins occurring ac-cording to a two-state (N7 U) or non-two-state (N 7 I(x)7 U) pathway. The mean hydrophobicity⬍H⬎ is defined as the sum of the normalized hydrophobicities of all residues divided by the number of residues in the polypeptide. The mean net charge⬍R⬎ is defined as the net charge at pH 7.0 divided by the total number of residues. Proteins unfolding according to a N7 U scheme are specifically localized within a unique region of the charge-hydrophobicity space, with⬍H⬎ ⫽ 0.422 ⫾ 0.017 and⬍R⬎ ⫽ 0.051 ⫾ 0.032, whereas proteins unfolding accord-ing to a N7 I(x)7 U scheme are restricted within a unique region of the charge-hydrophobicity space, with ⬍H⬎ ⫽ 0.446⫾ 0.023 and ⬍R⬎ ⫽ 0.027 ⫾ 0.022 (38). NAD⫹ -depend-ent DNA ligases from E. coli (Eclig) and T. scotoductus (Tslig) are characterized by⬍H⬎ of 0.483 and 0.450 and ⬍R⬎ of 0.030
and 0.007, respectively, thus predicting unfolding through one or a few intermediates.
Adenylation-induced Structural Changes in Mesophilic and Thermophilic NAD⫹-DNA Ligases
Acrylamide Quenching of Fluorescence—To characterize the
conformational changes induced by adenylation, the flexibility of deadenylated and adenylated NAD⫹-DNA ligases has been probed by dynamic fluorescence quenching using acrylamide as a quencher. Because of its polar nature, this molecule quenches the fluorescence of surface-exposed and partially buried Trp residues. Fig. 1 shows the Stern-Volmer quenching plots for deadenylated and adenylated Eclig (Fig. 1A) and Tslig (Fig. 1B). Analysis of the Ksvof native deadenylated and adenylated NAD⫹ligases clearly indicates a greater solvent accessibility of Trp residues in deadenylated enzymes that adopt an “open” TABLE II
Parameters of intrinsic fluorescence obtained for deadenylated and adenylated NAD⫹-DNA ligases in different conformational states
State
Eclig Tslig
Deadenylated Adenylated Deadenylated Adenylated
GdmCl max280 Imax(%) GdmCl max280 Imax GdmCl max280 Imax GdmCl max280 Imax
M % M % M % M %
N 0.0 328.0 100 0.0 328.0 89 0.0 332.2 100 0.0 332.0 72
MG 0.8 329.4 76 1.2 330.8 86 2.5 333.6 84 3.0 332.0 69
PMG 1.4 340.6 65 2.1 344.8 84 3.5 338.2 74 4.4 344.0 48
U 4.0 349.0 40 4.0 347.6 83 6.5 347.0 66 6.5 346.0 44
FIG. 3. Fluorescence emission spectra of deadenylated and adenylated NADⴙligases. A, spectra of deadenylated Eclig recorded on excitation at 280 nm at 0M(solid line), 0.8M(broken line), 1.4M(dotted line), and 4M(dashed) GdmCl. A.U., arbitrary units. B, spectra of adenylated Eclig recorded on excitation at 280 nm at 0M(solid line), 1.2M(broken line), 2.1M(dotted line), and 4M(dashed). C, spectra of deadenylated Tslig recorded on excitation at 280 nm at 0M(solid line), 2.5M(broken line), 3.5M(dotted line), and 6.5M(dashed). D, spectra of adenylated Tslig recorded on excitation at 280 nm at 0M(solid line), 3M(broken line), 4.4M(dotted line), and 6.5M(dashed line). Corresponding maxare given in Table II.
Stability and Unfolding of NAD
-dependent DNA Ligases
conformation compared with their adenylated conformers (3.02⫾ 0.03 versus 2.53 ⫾ 0.04M⫺1for the deadenylated and
adenylated Eclig and 7.11⫾ 0.11 versus 5.66 ⫾ 0.05M⫺1for the deadenylated and adenylated Tslig). This provides direct evi-dence for the induction of an open-closure mechanism of these enzymes upon adenylation and reinforces conclusions derived from purely structural studies (3, 6, 39).
Thermal Denaturation of Deadenylated and Adenylated NAD⫹-DNA Ligases—Fig. 2 shows thermal denaturation
curves of deadenylated and adenylated NAD⫹-DNA ligases monitored by DSC. Compared with Eclig, the unfolding pattern of Tslig is more complex because it is composed of two distinct absorption peaks. This phenomenon is likely to reflect temper-ature adaptation and has been attributed to a decrease of unfolding cooperativity in the thermophilic enzyme (14). Dead-enylated and adDead-enylated Eclig and Tslig denature according to a non-two-state process since deconvolution of the excess heat capacity (Cp) functions reveals that these enzymes possess
domains of distinct stability (Table I). In addition, the deviation from a two-state model is also confirmed by the fact that the ⌬Hcal/⌬Heffratio exceeds unity (not shown). Fig. 2 and Table I also point out that cofactor binding increases the resistance of NAD⫹-dependent DNA ligases to thermal denaturation. This is manifested by the increased Tmax(by 8 and 6 °C for Eclig and Tslig, respectively) and calorimetric enthalpy⌬Hcal(by 167 and 80 kJ mol⫺1for Eclig and Tslig, respectively). Altogether these results clearly establish a conformational change upon adeny-lation as well as a thermodynamic link between cofactor bind-ing and stability enhancement.
GdmCl-induced Unfolding of Deadenylated and Adenylated NAD⫹-DNA Ligases
GdmCl-induced unfolding of deadenylated and adenylated NAD⫹-DNA ligases has been followed by several spectroscopic techniques. Unfolding of these enzymes is reversible since they regained native conformation following renaturation after com-plete denaturation in 7MGdmCl (not shown). Remaining
Gd-mCl concentrations in the refolding buffer preclude the assess-ment of reversibility by activity measureassess-ments.
Intrinsic Fluorescence—Fig. 3 shows the fluorescence
emis-sion spectra of deadenylated and adenylated NAD⫹-DNA li-gases under different experimental conditions, and Table II represents the wavelengths of the maximal emission (max) of deadenylated and adenylated NAD⫹-DNA ligases under the different experimental conditions. Native deadenylated and adenylated enzymes are characterized by fluorescence emis-sion spectra (ex280 nm) with maxima around 330 nm. Exci-tation at 295 nm did not dramatically modify the shape of emission spectra except that the shoulder in the tyrosine emis-sion region (vicinity of 306 nm) disappeared (not shown). The maxvalues recorded for native enzymes indicate that trypto-phan (Trp) residues in Eclig and Tslig are rather buried, which is consistent with the localization of Trp residues deduced from three-dimensional modeling studies (14). Furthermore, the ad-enylation does not change significantly the polarity of Trp environment within the “catalytic core” of the protein (Table II). However, upon adenylation the intrinsic fluorescence is quenched by, respectively,⬃10 and ⬃35% for Eclig and Tslig (see Imax in Table II). Based on three-dimensional modeling studies (14), it is suggested that the observed adenylation-induced fluorescence quenching in Tslig is due to the interac-tion of AMP with a conserved Tyr-226 contacting the nucleotide and/or Trp-246 and/or Trp-298 located within the active site. This assumption is also relevant for Eclig, since these residues are conserved and located at the same positions in the meso-philic and thermomeso-philic enzymes (14). Therefore, these results
indicate that anchoring of the cofactor induces some conforma-tional rearrangement within the active site of NAD⫹-DNA ligases. Such a phenomenon has previously been reported for numerous enzymes (40 –50). At high GdmCl concentrations (4
Mfor Eclig and 6.5Mfor Tslig), the maximal emission of both
deadenylated and adenylated NAD⫹-DNA ligases is shifted toward ⬃348 nm (Fig. 3 and Table II), indicating complete exposure of the Trp residues to the bulk solvent.
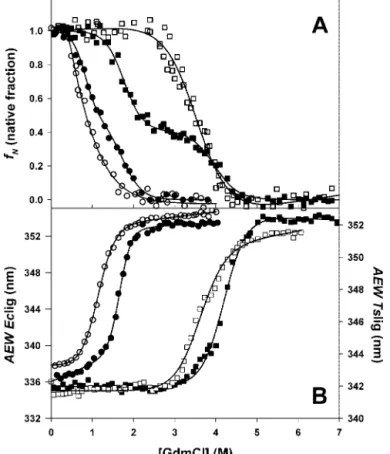
Fig. 4 represents GdmCl dependences of the FI (expressed in term of protein native fraction fN; Fig. 4A), and AEW (Fig. 4B),
determined for the deadenylated and adenylated forms of Eclig and Tslig. FI data reveal that both forms of Eclig unfold through an intermediate state (N7 I 7 U), with both transi-tions shifted toward higher GdmCl concentratransi-tions for the ad-enylated ligase (Fig. 4A, Table III). Such behavior points out that adenylation does not alter the formation of the interme-diate state I but increases the stability of the enzyme toward GdmCl-induced unfolding. In the case of Tslig, an intermediate state is also evident for the GdmCl unfolding of the adenylated conformer, whereas unfolding of the deadenylated form is con-sistent with a simple two-state model (N7 U) (Fig. 4A, Table III). Therefore, in adenylated Tslig the N7 I transition can be attributed to adenylation and is likely to describe, as the de-naturant concentration increases, the removal of the cofactor-induced quenching of the intrinsic fluorescence at 333 nm (see Fig. 3C), which is not accompanied by a significant change of the environment of the Trp residues (max is not red-shifted; see Table II). Discrepancies between the behavior of the meso-philic and thermomeso-philic DNA ligases are likely to reflect adap-tations to different thermal environments (14). Interestingly, FIG. 4. GdmCl-induced changes in fluorescence of deadeny-lated (open symbols) and adenydeadeny-lated (closed symbols) NADⴙ
li-gases. Unfolding of Eclig (circles) and Tslig (squares) recorded by the changes in FI (A) or AEW (B). fNdata are fit to a three-state model (65), except for deadenylated Tslig (open squares), where a two-state path-way was used. AEW data were analyzed according to a two-state model. The lines represent the best fits, calculated using the thermodynamic parameters presented in Table III.
for all conformers the equilibrium intermediates detected by the FI are not observed in the AEW data (Fig. 4B), which are fitted according to a simple two-state model, and the Cm (con-centration of GdmCl at the transition mid-point) values
calcu-lated for AEW correspond to the Cm values determined for the second FI transition (CmI-U, see Table III). This indicates that the formation of an intermediate state was not accompanied by a significant change in the polarity of Trp environment (see TABLE III
Thermodynamic parameters of GdmCl-induced unfolding of deadenylated and adenylated NAD⫹-DNA ligases, as obtained from the analysis of the equilibrium transitions
Enzyme ⌬G(H2O) m Cm Transition-monitored kJ mol1 kJ mol1 M⫺1 M Eclig Deadenylated Fluorescence FlN-I(330 nm) 18⫾ 2.7 31.9⫾ 5.0 0.6 N7 MG FlI-U(330 nm) 9.5⫾ 1.5 9.1⫾ 0.9 1.0 MG7 U AEW 13.5⫾ 0.7 11.9⫾ 0.5 1.1 MG7 U Adenylated Fluorescence FlN-I(330 nm) 12.8⫾ 1.2 15.5⫾ 2.0 0.8 N7 MG FlI-U(330 nm) 18.3⫾ 3.9 10.6⫾ 1.9 1.7 MG7 U AEW 29.5⫾ 1.9 17.6⫾ 1.1 1.7 MG7 U CD FarN-I(222 nm) 20.9⫾ 2.8 12.7⫾ 1.6 1.7 MG7 PMG FarI-U(222 nm) 6.0⫾ 4.3 2.7⫾ 0.9 2.2 PMG7 U Tslig Deadenylated Fluorescence FI 23.6⫾ 2.5 6.8⫾ 0.7 3.5 MG7 U AEW 28.9⫾ 2.0 8.0⫾ 0.6 3.5 MG7 U Adenylated Fluorescence FIN-I(333 nm) 18.2⫾ 3.4 11.2⫾ 1.8 1.6 N7 MG FII-U(333 nm) 42.2⫾ 4.0 10.2⫾ 1.0 4.2 MG7 PMG AEW 38.8⫾ 1.8 9.3⫾ 0.5 4.2 MG7 PMG CD FarN-I(222 nm) 67.7⫾ 12.7 19.0⫾ 3.6 3.6 MG7 PMG FarI-U(222 nm) 27.4⫾ 2.3 5.2⫾ 0.4 5.2 PMG7 U
FIG. 5. GdmCl dependences of ANS binding by Eclig (A) and Tslig (B), measured by the changes in ANS flu-orescence intensity. Open symbols, deadenylated NAD⫹ ligase; closed
sym-bols, adenylated NAD⫹ligase. A.U.,
arbi-trary units.
Stability and Unfolding of NAD
-dependent DNA Ligases
max values in Table II). The low m (slope of the transition, representing the unfolding cooperativity) values reported in Table III also support unfolding through an equilibrium inter-mediate(s), since an expected theoretical m value of ⬃60 kJ mol⫺1M⫺1is expected for NAD⫹-dependent DNA ligases
un-folding according to a two-state mechanism (51). It has to be emphasized that these results are in perfect agreement with the prediction of unfolding of NAD⫹-DNA ligases through in-termediates based on the bulk content of hydrophobic and charged amino acid residues (see above).
Finally, comparison of⌬G(H2O) (conformational stability in the absence of denaturant) and Cm values estimated for apo and holo forms (Table III) indicates considerable stabilization on both enzymes by the cofactor. Indeed, the adenylated en-zymes show a 16- and 9.9-kJ mol⫺1increase in the stabilization energy (according to AEW) and a 0.6 and 0.7Mincrease in Cm values for Eclig and Tslig, respectively. As previously observed upon thermal denaturation, these results demonstrate that cofactor anchoring induces conformational rearrangements within the active site of NAD⫹-DNA ligases with the concom-itant increase of the stability of the molecular edifice.
ANS Fluorescence—The hydrophobic fluorescent probe ANS
is frequently used to detect partially folded intermediates with exposed hydrophobic surfaces (52–53). Interaction of ANS with accessible hydrophobic patches results in a blue shift of its fluorescence spectrum from⬃525 to ⬃480 nm, accompanied by a considerable increase of the dye fluorescence intensity. Both native deadenylated and adenylated forms of Eclig bind weakly ANS, as indicated by max values close to 480 nm and low values of FI480(not shown) and, thus, reflect the presence of a few solvent-exposed hydrophobic patches. In contrast, conform-ers of Tslig do not bind ANS (max values close to 525 nm), FIG. 6. Phase diagram representation of the adenylated NADⴙ
ligases unfolding induced by GdmCl. A, phase diagram for Eclig (FI320versus FI365). B, phase diagram for Tslig (FI333versus FI365). Plots
are based on the corresponding fluorescence intensities. Denaturant concentrations are indicated in the vicinity of the corresponding sym-bol. Each straight line represents an all-or-one transition between two conformers (29 –34).
FIG. 7. GdmCl-induced unfolding of adenylated NADⴙligases
followed by changes in far UV CD. A, far UV CD spectra of Eclig. B, far UV CD spectra of Tslig. C, equilibrium unfolding transitions of adenylated Eclig (●) and Tslig (f). Data were analyzed on the basis of a three-state model (65); the lines represent the best fits, calculated using the thermodynamic parameters in Table III.
indicating the absence of such accessible hydrophobic clusters. Such a phenomenon is likely to be associated with temperature adaptation, because burial of hydrophobic clusters is expected to contribute to the stabilization of Tslig at high temperatures (14).
Fig. 5A shows that the increase in GdmCl concentrations leads to the considerable increase in the Eclig affinity to ANS, with the maximal binding achieved at 1.0 and 1.2MGdmCl for
apo and holo enzymes, respectively. The intermediate state isolated in the deadenylated ligase binds ANS stronger than the adenylated intermediate conformer. In fact, ANS fluores-cence intensity is enhanced⬃4.2 times upon the formation of the deadenylated intermediate, whereas it only increases 1.4 times in the case of the adenylated enzyme (Fig. 5A). GdmCl-induced unfolding of deadenylated Tslig also leads to the sig-nificant changes in ANS fluorescence, with a maximum binding occurring at 3.2M GdmCl (Fig. 5B). In contrast,
GdmCl-in-duced unfolding of adenylated Tslig is not accompanied by detectable ANS binding since no blue shift is observed and the FI480values remain low and constant (Fig. 5B). This might be attributed to the AMP effect on the microenvironment of the potential ANS binding site, preventing any binding between the intermediate state and the dye. This assumption is sup-ported by the results obtained for adenylated Eclig, where the presence of the cofactor significantly weakens the binding of ANS (see Fig. 5A). Compared with its thermophilic homologue, the increased resilience of the active site of Eclig (14) could explain the slight binding of ANS recorded. It is, therefore, suggested that in NAD⫹-dependent DNA ligases, the ANS binding site is at, or close to, the cofactor binding site, i.e. the active site. It is also worth mentioning that displacement of ANS into a more polar environment upon cofactor binding has been already reported for various enzymes (50, 54 –57).
Contrary to Tslig (Fig. 5B), all Eclig ANS binding curves (Fig. 5A) are better deconvoluted into two peaks (not shown). The first peak, accounting for 70 – 80% of the effect, has a maximum at 0.8 and 1.2MGdmCl for deadenylated and
adeny-lated Eclig, respectively. The second peak accounts for the 20 –30% of the total effect and is positioned at 1.3 and 2.1M
GdmCl for deadenylated and adenylated Eclig, respectively. This indicates that unfolding of Eclig involves at least two intermediates with different ANS affinities, a molten globule-like state (MG) with strong ANS binding and a pre-molten
globule state (PMG) with lower affinity to ANS (58). Thus, these results indicate that the chemical unfolding of NAD⫹ -DNA ligases is accompanied by accumulation of at least two intermediates with solvent-accessible non-polar clusters (see below). Maximal population of these intermediates shifts to-ward the higher GdmCl concentrations upon adenylation, high-lighting here again protein stabilization by the cofactor.
Phase Diagram Analysis of Fluorescence Intensity Data—
The analysis of the unfolding data in terms of phase diagrams is known to be extremely sensitive to intermediate states (31– 34). Fig. 6 represents phase diagrams for the GdmCl unfolding of adenylated Eclig (Fig. 6A) and Tslig (Fig. 6B), derived from the analysis of fluorescence data. In the case of Eclig, the phase diagram consists of four linear parts, reflecting the existence of at least four independent transitions separating five different conformations, native (N), native-like (N*), molten globule (MG), pre-molten globule (PMG), and unfolded (U). In the case of its thermophilic counterpart, phase diagrams revealed the existence of six different conformations, N, N*, MG, swollen MG (MGsw, retaining also a globular shape but that is “swollen” from the MG state), PMG, and U (Fig. 6B). The N* state is attributed to a probable GdmCl salt effect on the enzyme struc-tures, as previously reported for monomeric (59) as well as multimeric (60) proteins.
Circular Dichroism—Further insights on the properties of
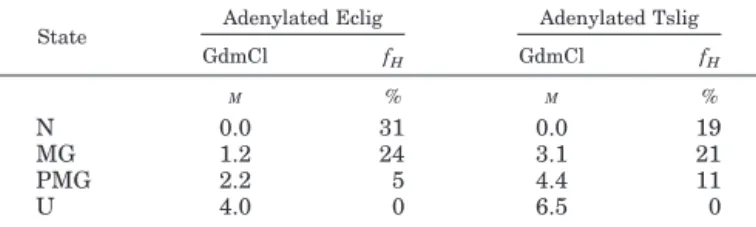
the MG and PMG intermediates were obtained by monitoring far UV CD spectra of adenylated Eclig and Tslig upon unfold-ing. As illustrated in Fig. 7, native adenylated Eclig (Fig. 7A) and Tslig (Fig. 7B) exhibit double minima at 208 and 222 nm, typical of proteins containing␣-helical secondary structures. Increasing GdmCl concentrations leads to the gradual change of the far UV CD spectra (Fig. 7, A and B). The analysis of the dependence of the ellipticity at 222 nm reveals that unfolding of both NAD⫹-DNA ligases is described by two partially overlap-ping transitions reflecting the successive formation of MG and PMG states (Fig. 7C). Thermodynamic parameters describing these processes are summarized in Table III. The first transi-tion corresponds to the transformatransi-tion of the MG state into the PMG state and is a cooperative process (see m values in Table III). The second transition corresponds to the transformation of the PMG state into the U state and is a non-cooperative proc-ess, as indicated by the low m values presented in Table III. Calculation of the␣-helical content at 222 nm (fH) (Table IV)
indicates that the first intermediate possesses a native-like secondary structure content, as usually reported for the molten globule state (53, 61), and that the second intermediate has a less defined secondary structure, displaying properties of the pre-molten globule state (53, 62).
Analysis of Unfolding Intermediates by Size Exclusion Chro-matography—To further explore the formation of MG and PMG
states upon GdmCl unfolding of NAD⫹-DNA ligases, measure-ment of their hydrodynamic dimensions was performed by size exclusion chromatography. This method has been successfully applied to determine the Stokes radius (RS) values for proteins TABLE IV
␣-Helical content (fH) of adenylated NAD⫹-DNA ligases in different
conformational states
State Adenylated Eclig Adenylated Tslig
GdmCl fH GdmCl fH M % M % N 0.0 31 0.0 19 MG 1.2 24 3.1 21 PMG 2.2 5 4.4 11 U 4.0 0 6.5 0 TABLE V
Molecular dimensions of adenylated NAD⫹-DNA ligases in different conformational states
State Adenylated Eclig Adenylated Tslig
GdmCl Vel R S, exp a R S, theo b R S/(RS)N GdmCl V el R S, exp a R S, theo b R S/(RS)N M ml Å Å M ml Å Å N 0.00 13.55 34.4 34.2 1.00 0.00 13.72 33.4 34.7 1.00 MG 1.20 13.00 37.8 37.4 1.10 3.06 12.01 44.8 37.9 1.32 PMG 2.20 11.00 53.2 50.0 1.55 3.06 10.99 53.3 50.7 1.60 U 4.80 9.74 66.1 83.4 1.92 6.30 9.50 68.9 85.1 2.06 a
RS(Stokes radius) values were calculated using the experimental (exp) equation RS⫽ (1000/V
el⫺ 42.44)/0.9114
bR
Svalues were calculated using the equations described in Uversky (64); for N state, log(RS)⫽ ⫺0.204 ⫹ 0.357 log M; for MG state, log(RS)⫽ ⫺0.053 ⫹ 0.334 log M; for PMG state, log(RS)⫽ ⫺0.21 ⫹ 0.392 log M; for U state, log(RS)⫽ ⫺0.723 ⫹ 0.543 log M. theo, theoretical.
Stability and Unfolding of NAD
-dependent DNA Ligases
in different conformational states (37, 58, 63). MG formation is known to be associated with a⬃10–30% increase of the RS(37,
53), whereas the PMG state is more expanded with a⬃30–50% increase of the RS(37, 58, 63). Table V shows that adenylated NAD⫹-DNA ligases are characterized by RSof 34.4 and 33.4 Å
for Eclig and Tslig, respectively. These values are in perfect agreement with the theoretical RScalculated from the
molec-ular weights of these enzymes (64). At GdmCl concentrations corresponding to the formation of the MG, a characteristic 10 –30% increase in RSis noticed for both enzymes. Finally, at
GdmCl concentrations corresponding to the formation of the PMG, the measured RSvalues coincide perfectly with values calculated for the PMG (⬃50% increase, see Table V).
Overall, our data are consistent with the conclusion that the first partially folded intermediate accumulated during GdmCl-induced unfolding of NAD⫹-DNA ligases exhibits all the prop-erties of the molten globule. It is compact and possesses a pronounced secondary structure and is able to bind ANS. As for the second intermediate, it displays all the properties of the pre-molten globule. It is less compact than the molten globule but is considerably more compact than the unfolded state, contains substantial ordered secondary structures, and is able to bind ANS, albeit weakly than MG.
Conclusion—NAD⫹-dependent DNA ligases are structurally conserved among bacteria but display unique substrate speci-ficity in contrast to the ATP-dependent DNA ligases of eu-karyotes. Because effective inhibition of these enzymes would result in the death of the bacterium, they constitute valuable antibiotic targets.
In this report, we demonstrate that adenylation of NAD⫹ -dependent DNA ligases causes a conformational rearrange-ment within the active site, induces enzyme compaction, and increases considerably the conformational stability of these enzymes, establishing a thermodynamic link between cofactor binding and conformational stability. Differences in stability between the apo and holo forms also indicate that adenylation of these enzymes is likely to be an inducible mechanism, avoid-ing the formation of non-productive DNA-ligase complexes. The deadenylated conformers adopt an open and destabilized con-formation, which makes them more susceptible to protease degradation, allowing a fine control of the level of these impor-tant proteins in the cell. Finally, we give evidence that a four-state model N 7 MG 7 PMG 7 U describes the GdmCl-induced unfolding of NAD⫹-dependent DNA ligases, with all conformational transitions shifted toward the higher GdmCl concentrations upon adenylation.
Acknowledgments—We thank N. Ge´rardin and R. Marchand for
skil-ful technical assistance. We also thank A. Matagne, A. R. Merrill, and M. Vanhove for helpful assistance and discussions.
REFERENCES
1. Lehman, I. R. (1974) Science 186, 790 –797
2. Wilkinson, A., Day, J., and Bowater, R. (2001) Mol. Microbiol. 40, 1241–1248 3. Lee, J. Y., Chang, C., Song, H. K., Moon, J., Yang, J. K., Kim, H. K., Kwon,
S. T., and Suh, S. W. (2000) EMBO J. 19, 1119 –1129
4. Doherty, A. J., and Suh, S. W. (2000) Nucleic Acids Res. 28, 4051– 4058 5. Singleton, M. R., Hakansson, K., Timson, D. J., and Wigley, D. B. (1999)
Structure (Lond.) 7, 35– 42
6. Hakansson, K., Doherty, A. J., Shuman, S., and Wigley, D. B. (1997) Cell 89, 545–553
7. Timson, D. J., Singleton, M. R., and Wigley, D. B. (2000) Mutat. Res. 460, 301–318
8. Martin, I. V., and MacNeill, S. A. (2002) Genome Biol. 3, 3001–3005 9. Aravind, L., and Koonin, E. V. (1999) J. Mol. Biol. 287, 1023–1040 10. Ciarrocchi, G., MacPhee, D. G., Deady, L. W., and Tilley, L. (1999) Antimicrob.
Agents Chemother. 43, 2766 –2772
11. Bro¨tz-Oesterhelt, H., Knezevic, I., Bartel, S., Lampe, T., Warnecke-Eberz, U., Ziegelbauer, K., Habich, D., and Labischinski, H. (2003) J. Biol. Chem. 278,
39435–39442
12. Sriskanda, V., and Shuman, S. (2002) J. Biol. Chem. 277, 9695–9700 13. Sriskanda, V., Schwer, B., Ho, C. K., and Shuman, S. (1999) Nucleic Acids Res.
27, 3953–3963
14. Georlette, D., Damien, B., Blaise, V., Depiereux, E., Uversky, V., Gerday, C., and Feller, G. (2003) J. Biol. Chem. 278, 37015–37023
15. Thorbjarnardo´ttir, S. H., Jo´nsson, Z. O., Andresson, O. S., Kristja´nsson, J. K., Eggertsson, G., and Pa´lsdo´ttir, A. (1995) Gene (Amst.) 161, 1– 6 16. Modrich, P., Anraku, Y., and Lehman, I. R. (1973) J. Biol. Chem. 248,
7495–7501
17. Panasenko, S. M., Alazard, R. J., and Lehman, I. R. (1978) J. Biol. Chem. 253, 4590 – 4592
18. Zimmerman, S. B., and Pheiffer, B. H. (1983) Proc. Natl. Acad. Sci. U. S. A. 80, 5852–5856
19. Ishino, Y., Shinagawa, H., Makino, K., Tsunasawa, S., Sakiyama, F., and Nakata, A. (1986) Mol. Gen. Genet. 204, 1–7
20. Takahashi, M., and Uchida, T. (1986) J. Biochem. 100, 123–131 21. Barany, F., and Gelfand, D. H. (1991) Gene (Amst.) 109, 1–11 22. Kaczorowski, T., and Szybalski, W. (1996) Gene (Amst.) 179, 189 –193 23. Brannigan, J. A., Ashford, S. R., Doherty, A. J., Timson, D. J., and Wigley,
D. B. (1999) Biochim. Biophys. Acta 1432, 413– 418
24. Georlette, D., Jonsson, Z. O., Van Petegem, F., Chessa, J., Van Beeumen, J., Hubscher, U., and Gerday, C. (2000) Eur. J. Biochem. 267, 3502–3512 25. Timson, D. J., and Wigley, D. B. (1999) J. Mol. Biol. 285, 73– 83
26. Goldberg, M. E., Expert-Bezancon, N., Vuillard, L., and Rabilloud, T. (1995)
Fold. Des. 1, 21–27
27. Pace, C. N. (1986) Methods Enzymol. 131, 266 –280
28. Royer, C. A., Mann, C. J., and Matthews, C. R. (1993) Protein Sci. 2, 1844 –1852
29. Burstein, E. A. (1976) Intrinsic Protein Fluorescence: Origin and Applications, Series Biophysics, Vol. 7, Viniiti, Moscow
30. Permyakov, E. A., Yarmolenko, V. V., Emelyanenko, V. I., Burstein, E. A., Closset, J., and Gerday, C. (1980) Eur. J. Biochem. 109, 307–315 31. Bushmarina, N. A., Kuznetsova, I. M., Biktashev, A. G., Turoverov, K. K., and
Uversky, V. N. (2001) ChemBioChem. 2, 813– 821
32. Kuznetsova, I. M., Stepanenko, O. V., Turoverov, K. K., Zhu, L., Zhou, J. M., Fink, A. L., and Uversky, V. N. (2002) Biochim. Biophys. Acta 1596, 138 –155
33. Munishkina, L. A., Phelan, C., Uversky, V. N., and Fink, A. L. (2003)
Biochem-istry 42, 2720 –2730
34. Uversky, V. N., Garriques, L. N., Millett, I. S., Frokjaer, S., Brange, J., Doniach, S., and Fink, A. L. (2003) J. Pharmacol. Sci. 92, 847– 858 35. Lakowicz, J. (1983) Principles of Fluorescence Spectroscopy, pp. 257–301,
Ple-num Press, New York
36. Chen, Y. H., Yang, J. T., and Martinez, H. M. (1972) Biochemistry 11, 4120 – 4131
37. Uversky, V. N. (1993) Biochemistry 32, 13288 –13298 38. Uversky, V. N. (2002) FEBS Lett. 514, 181–183
39. Doherty, A. J., and Dafforn, T. R. (2000) J. Mol. Biol. 296, 43–56 40. Diefenbach, R. J., and Duggleby, R. G. (1991) Biochem. J. 276, 439 – 445 41. Morimatsu, K., Horii, T., and Takahashi, M. (1995) Eur. J. Biochem. 228,
779 –785
42. Candy, J. M., Koga, J., Nixon, P. F., and Duggleby, R. G. (1996) Biochem. J.
315, 745–751
43. Gupta, G. S., and Kang, B. P. (1997) Indian J. Biochem. Biophys. 34, 307–312 44. Brandes, H. K., Larimer, F. W., Lu, T. Y., Dey, J., and Hartman, F. C. (1998)
Arch. Biochem. Biophys. 352, 130 –136
45. Marchal, S., and Branlant, G. (1999) Biochemistry 38, 12950 –12958 46. Sinha, K. M., Ghosh, M., Das, I., and Datta, A. K. (1999) Biochem. J. 339,
667– 673
47. Murataliev, M. B., and Feyereisen, R. (2000) Biochemistry 39, 12699 –12707 48. Goenka, S., Raman, B., Ramakrishna, T., and Rao, C. M. (2001) Biochem. J.
359, 547–556
49. Tang, C. K., Jeffers, C. E., Nichols, J. C., and Tu, S. C. (2001) Arch. Biochem.
Biophys. 392, 110 –116
50. Favilla, R., Goldoni, M., Mazzini, A., Di Muro, P., Salvato, B., and Beltramini, M. (2002) Biochim. Biophys. Acta 1597, 42–50
51. Myers, J. K., Pace, C. N., and Scholtz, J. M. (1995) Protein Sci. 4, 2138 –2148 52. Semisotnov, G. V., Rodionova, N. A., Razgulyaev, O. I., Uversky, V. N., Gripas,
A. F., and Gilmanshin, R. I. (1991) Biopolymers 31, 119 –128 53. Ptitsyn, O. B. (1995) Adv. Protein Chem. 47, 83–229
54. Shepherd, G. B., and Hammes, G. G. (1976) Biochemistry 15, 311–317 55. Kube, D., Esakova, T. V., Ivanov, M. V., Gromov, A. I., and Nagradova, N. K.
(1987) Biokhimiya 52, 179 –187
56. Zhang, Y. L., Zhou, J. M., and Tsou, C. L. (1996) Biochim. Biophys. Acta 1295, 239 –244
57. D’Auria, S., Herman, P., Rossi, M., and Lakowicz, J. R. (1999) Biochem.
Biophys. Res. Commun. 263, 550 –553
58. Uversky, V. N., and Ptitsyn, O. B. (1996) J. Mol. Biol. 255, 215–228 59. Mayr, L. M., and Schmid, F. X. (1993) Biochemistry 32, 7994 –7998 60. Akhtar, M. S., Ahmad, A., and Bhakuni, V. (2002) Biochemistry 41, 3819 –3827 61. Vassilenko, K. S., and Uversky, V. N. (2002) Biochim. Biophys. Acta 1594,
168 –177
62. Uversky, V. N. (1997) Protein Pept. Lett. 4, 355–368
63. Uversky, V. N., and Ptitsyn, O. B. (1994) Biochemistry 33, 2782–2791 64. Uversky, V. N. (2002) Eur. J. Biochem. 269, 2–12
65. Vanhove, M., Guillaume, G., Ledent, P., Richards, J. H., Pain, R. H., and Frere, J. M. (1997) Biochem. J. 321, 413– 417