Ignacio HIDALGO GONZÁLEZ Sylvain QUOILIN
Andreas ZUCKER
Description, formulation, and
implementation
Dispa-SET 2.0: unit commitment and
power dispatch model
2 0 1 4
European Commission Joint Research Centre
Institute for Energy and Transport Contact information
Ignacio Hidalgo González
Address: Joint Research Centre, Institute for Energy and Transport, Westerduinweg 3, NL 1755 LE, Petten. The Netherlands E-mail: [email protected]
Tel.: +31 224 565 103 JRC Science Hub
https://ec.europa.eu/jrc
Legal Notice
This publication is a Science and Policy Report by the Joint Research Centre, the European Commission’s in-house science service. It aims to provide evidence-based scientific support to the European policy-making process. The scientific output expressed does not imply a policy position of the European Commission. Neither the European Commission nor any person acting on behalf of the Commission is responsible for the use which might be made of this publication.
All images © European Union 2014 JRC93780 EUR 27015 EN ISBN 978-92-79-44690-0 (PDF) ISBN 978-92-79-44691-7 (print) ISSN 1831-9424 (online) ISSN 1018-5593 (print) doi:10.2790/399921
Luxembourg: Publications Office of the European Union, 2014 © European Union, 2014
Reproduction is authorised provided the source is acknowledged.
Abstract
Most analyses of the future European energy system conclude that in order to achieve energy and climate change policy goals it will be necessary to ramp up the use of renewable energy sources.
The stochastic nature of those energies, together with other sources of short- and long-term uncertainty, already have significant impacts in current energy systems operation and planning, and it is expected that future energy systems will be forced to become increasingly flexible in order to cope with these challenges. Therefore, policy makers need to consider issues such as the effects of intermittent energy sources on the reliability and adequacy of the energy system, the impacts of rules governing the curtailment or storage of energy, or how much backup dispatchable capacity may be required to guarantee that energy demand is safely met.
Many of these questions are typically addressed by detailed models of the electric power sector with a high level of technological and temporal resolution. This report describes one of such models developed by the JRC's Institute for Energy and Transport: Dispa-SET 2.0, a unit commitment and dispatch model of the European power system aimed at representing with a high level of detail the short-term operation of large-scale power systems. The new model is an updated version of Dispa-SET 1.0, in use at the JRC since 2009.
Table of Contents
1 Introduction ... 4
2 Description and formulation ... 4
2.1 Notation ... 4 2.1.1 Sets ... 4 2.1.2 Parameters ... 5 2.1.3 Variables ... 7 2.2 Equations ... 7 2.2.1 Objective function ... 8 2.2.2 Demand-related constraints ... 9
2.2.3 Power output bounds ... 11
2.2.4 Minimum up and down times ... 12
2.2.5 Storage-related constraints ... 13 2.2.6 Emission limits ... 14 2.2.7 Network-related constraints ... 14 2.2.8 Curtailment ... 15 2.2.9 Load shedding ... 15 3 Implementation... 15 3.1 Rolling horizon ... 16 3.2 Data sources ... 16 4 Illustrative results ... 16
4.1 Model inputs and parameters ... 17
4.2 Simulations ... 19
4.2.1 Base case ... 19
4.2.2 Increasing VRE penetration scenarios ... 20
5 Conclusions and future work ... 21
4
1 Introduction
Most analyses of the future European energy system conclude that in order to achieve energy and climate change policy goals it will be necessary to ramp up the use of renewable energy sources.
The stochastic nature of those energies, together with other sources of short- and long-term uncertainty, already have significant impacts in current energy systems operation and planning, and it is expected that future energy systems will be forced to become increasingly flexible in order to cope with these challenges. Therefore, policy makers need to consider issues such as the effects of intermittent energy sources on the reliability and adequacy of the energy system, the impacts of rules governing the curtailment or storage of energy, or how much backup dispatchable capacity may be required to guarantee that energy demand is safely met.
Many of these questions are typically addressed by detailed models of the electric power sector with a high level of technological and temporal resolution. This report describes one of such models developed by the JRC's Institute for Energy and Transport: Dispa-SET 2.0, a unit commitment and dispatch model of the European power system. The new model is an updated version of Dispa-SET 1.0, in use at the JRC since 2009. The aim of this new version is to represent with a high level of detail the short-term operation of large-scale power systems. To that purpose we consider that the system is managed by a central operator with full information on the technical and economic dada of the power plants, the demand, and the transmission network. This model is formulated as a tight and compact mixed-integer program, implemented in GAMS [1] and solved with CPLEX [2].
The rest of the report is organized as follows: section 2 describes the formulation of the model, section 3 explains how the model is implemented in GAMS, section 4 shows an illustrative example of the output produced by the model, and finally section 5 outlines the main conclusions of this work and presents forthcoming improvements to the model.
2 Description and formulation
The following sections detail the notation used throughout the report to describe the model, beginning with a list of the sets, parameters, and variables included. The second part describes the foundations of the model and each of the constraints considered.
2.1 Notation
2.1.1 Sets
Table 1 lists the sets used in the model, corresponding to all the indices used in parameters, variables and equations.
5
Table 1: list of sets
Name Description
d Days
f Fuel types
h Hours
i Time step in the solving loop
l Transmission lines between nodes
mk Mk={DA,2U,2D} (day-ahead, up and down reserves1)
n Zones within each country (currently one zone, or node, per country)
p Pollutants
t Power generation technologies
tr(t) Renewable power generation technologies
u Units
s(u) Storage units (including hydro reservoirs)
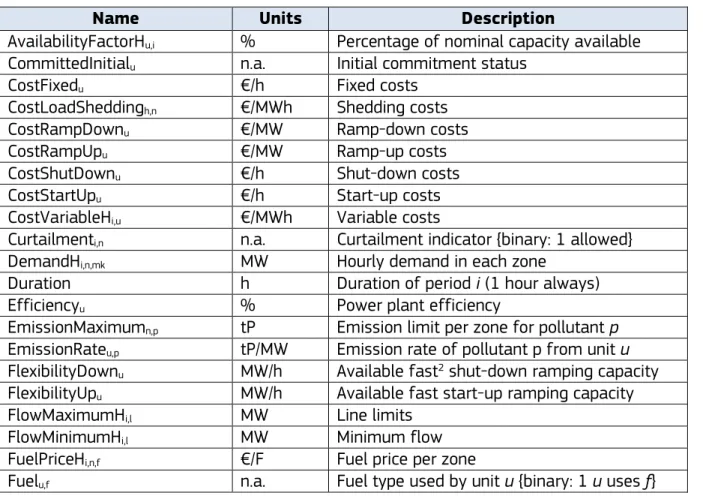
2.1.2 Parameters
Table 2 contains the list of parameters used in the model (highlighted in green in the equations).
Table 2: list of parameters
Name Units Description
AvailabilityFactorHu,i % Percentage of nominal capacity available
CommittedInitialu n.a. Initial commitment status
CostFixedu €/h Fixed costs
CostLoadSheddingh,n €/MWh Shedding costs
CostRampDownu €/MW Ramp-down costs
CostRampUpu €/MW Ramp-up costs
CostShutDownu €/h Shut-down costs
CostStartUpu €/h Start-up costs
CostVariableHi,u €/MWh Variable costs
Curtailmenti,n n.a. Curtailment indicator {binary: 1 allowed}
DemandHi,n,mk MW Hourly demand in each zone
Duration h Duration of period i (1 hour always)
Efficiencyu % Power plant efficiency
EmissionMaximumn,p tP Emission limit per zone for pollutant p
EmissionRateu,p tP/MW Emission rate of pollutant p from unit u
FlexibilityDownu MW/h Available fast2 shut-down ramping capacity
FlexibilityUpu MW/h Available fast start-up ramping capacity
FlowMaximumHi,l MW Line limits
FlowMinimumHi,l MW Minimum flow
FuelPriceHi,n,f €/F Fuel price per zone
Fuelu,f n.a. Fuel type used by unit u {binary: 1 u uses f}
1
In this report the term "reserves" refer to the aggregated needs for secondary and tertiary reserves.
2
6
Name Units Description
LineNodel,n n.a. Line-zone incidence matrix {-1,+1}
LoadSheddingh,n MW Load that may be shed per zone in 1 hour
Locationu,n n.a. Location {binary: 1 u located in n}
M minute Time in which fast units may be started up or shut down
MarkupHi,u €/MWh Mark-up term added to the variable cost
OutageFactoru,h % Outage factor (100 % = full outage) per hour
Ownershipu,g n.a. Ownership indicator {binary: 1 u owned by g}
PartLoadMinu % Percentage of nominal capacity needed for stable generation
PermitPricep €/tP Permit price for pollutant p
PowerCapacityu MW Installed capacity
PowerInitialu MW Power output before initial period
PowerMinStableu MW Minimum power for stable generation
PowerMustRunHu,i MW Minimum power output
PriceHi,n,mk €/MWh Electricity price per market and zone
PriceTransmissionHi,l €/MWh Price of transmission between zones
RampDownMaximumu MW/h Ramp down limit
RampShutDownMaximumu MW/h Shut-down ramp limit
RampStartUpMaximumu MW/h Start-up ramp limit
RampUpMaximumu MW/h Ramp up limit
Reservet n.a. Reserve provider {binary: 1 if t may provide reserve}
StorageCapacitys MWh Storage capacity (reservoirs)
StorageChargingCapacitys MW Maximum charging capacity
StorageChargingEfficiencys % Charging efficiency
StorageDischargeEfficiencys % Discharge efficiency
StorageInflowHi.s MWh Storage inflows
StorageInitials MWh Storage level before initial period
StorageMinimums MWh Minimum storage level
StorageOutflowHi,s MWh Storage outflows (spills)
Technologyu,t n.a. Technology type {binary: 1: u belongs to technology type t}
TimeDownInitialu h Hours down before initial period
TimeDownLeft_Initialu h Time down remaining at initial time
TimeDownLeft_JustStoppedi,u h Time down remaining if started at time i
TimeDownMinimumu h Minimum down time
TimeDownu,h h Number of hours down
TimeUpInitialu h Number of hours up before initial period
TimeUpLeft_Initialu h Time up remaining at initial time
TimeUpLeft_JustStartedi,u h Time up remaining if started at time i
TimeUpMinimumu h Minimum up time
TimeUpu,h h Number of hours up
VOLLPower €/MWh Value of lost load due to power deficits
VOLLReserver €/MWh Value of lost load due to reserve deficits
7
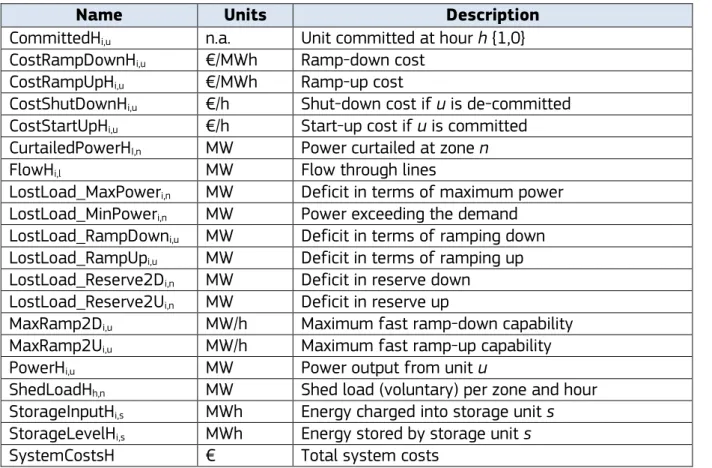
2.1.3 Variables
Table 3 contains the list of variables considered in the model. All the variables are defined as positive variables, except CommittedHi,u, which is binary.
Table 3: list of variables
Name Units Description
CommittedHi,u n.a. Unit committed at hour h {1,0}
CostRampDownHi,u €/MWh Ramp-down cost
CostRampUpHi,u €/MWh Ramp-up cost
CostShutDownHi,u €/h Shut-down cost if u is de-committed
CostStartUpHi,u €/h Start-up cost if u is committed
CurtailedPowerHI,n MW Power curtailed at zone n
FlowHi,l MW Flow through lines
LostLoad_MaxPoweri,n MW Deficit in terms of maximum power
LostLoad_MinPoweri,n MW Power exceeding the demand
LostLoad_RampDowni,u MW Deficit in terms of ramping down
LostLoad_RampUpi,u MW Deficit in terms of ramping up
LostLoad_Reserve2Di,n MW Deficit in reserve down
LostLoad_Reserve2Ui,n MW Deficit in reserve up
MaxRamp2Di,u MW/h Maximum fast ramp-down capability
MaxRamp2Ui,u MW/h Maximum fast ramp-up capability
PowerHi,u MW Power output from unit u
ShedLoadHh,n MW Shed load (voluntary) per zone and hour
StorageInputHi,s MWh Energy charged into storage unit s
StorageLevelHi,s MWh Energy stored by storage unit s
SystemCostsH € Total system costs
2.2 Equations
The aim of this model is to represent with a high level of detail the short-term operation of large-scale power systems solving the so-called unit commitment problem. To that aim we consider that the system is managed by a central operator with full information on the technical and economic data of the generation units, the demands in each node, and the transmission network.
The unit commitment problem considered in this report is a simplified instance of the problem faced by the operator in charge of clearing the competitive bids of the participants into a wholesale day-ahead power market. In the present formulation the demand side is an aggregated input for each node, while the transmission network is modelled as a transport problem between the nodes (that is, the problem is network-constrained but the model does not include the calculation of the optimal power flows). The unit commitment problem consists of two parts: i) scheduling the start-up, operation, and shut down of the available generation units, and ii) allocating (for each period of the simulation horizon of the model) the total power demand among the available generation units in such a way that the overall power system costs is minimized. The first part of the problem, the unit scheduling during several periods of time, requires the use of binary variables in order to represent the start-up and shut down decisions, as well as the
8 consideration of constraints linking the commitment status of the units in different periods. The second part of the problem is the so-called economic dispatch problem, which determines the continuous output of each and every generation unit in the system. Therefore, given all the features of the problem mentioned above, it can be naturally formulated as a mixed-integer linear program (MILP). The formulation of the model presented in this report is based upon publicly available modelling approaches [3, 4, 5]. Since our goal is to model a large European interconnected power system, we have implemented a so-called tight and compact formulation, in order to simultaneously reduce the region where the solver searches for the solution and increase the speed at which the solver carries out that search. Tightness refers to the distance between the relaxed and integer solutions of the MILP and therefore defines the search space to be explored by the solver, while compactness is related to the amount of data to be processed by the solver and thus determines the speed at which the solver searches for the optimum. Usually tightness is increased by adding new constraints, but that also increases the size of the problem (decreases compactness), so both goals contradict each other and a trade-off must be found.
2.2.1 Objective function
The goal of the unit commitment problem is to minimize the total power system costs (expressed in € in equation 1), which are defined as the sum of different cost items,
namely: start-up and shut-down, fixed, variable, ramping, transmission-related and load shedding (voluntary and involuntary) costs.
1 min 𝑆𝑦𝑠𝑡𝑒𝑚𝐶𝑜𝑠𝑡𝐻 = ∑ ( 𝐶𝑜𝑠𝑡𝑆𝑡𝑎𝑟𝑡𝑈𝑝𝐻𝑖,𝑢+ 𝐶𝑜𝑠𝑡𝑆ℎ𝑢𝑡𝐷𝑜𝑤𝑛𝐻𝑖,𝑢+ 𝐶𝑜𝑠𝑡𝐹𝑖𝑥𝑒𝑑𝑢∙ 𝐶𝑜𝑚𝑚𝑖𝑡𝑡𝑒𝑑𝐻𝑖,𝑢+ 𝐶𝑜𝑠𝑡𝑉𝑎𝑟𝑖𝑎𝑏𝑙𝑒𝐻𝑖,𝑢∙ 𝑃𝑜𝑤𝑒𝑟𝐻𝑖,𝑢+ 𝐶𝑜𝑠𝑡𝑅𝑎𝑚𝑝𝑈𝑝𝐻𝑖,𝑢+ 𝐶𝑜𝑠𝑡𝑅𝑎𝑚𝑝𝐷𝑜𝑤𝑛𝐻𝑖,𝑢+ 𝑃𝑟𝑖𝑐𝑒𝑇𝑟𝑎𝑛𝑠𝑚𝑖𝑠𝑠𝑖𝑜𝑛𝐻𝑖,𝑙∙ 𝐹𝑙𝑜𝑤𝐻𝑖,𝑙+ ∑(𝐶𝑜𝑠𝑡𝐿𝑜𝑎𝑑𝑆ℎ𝑒𝑑𝑑𝑖𝑛𝑔𝐻𝑖,𝑛∙ 𝑆ℎ𝑒𝑑𝐿𝑜𝑎𝑑𝐻𝑖,𝑛) 𝑛 + 𝑉𝑂𝐿𝐿𝑃𝑜𝑤𝑒𝑟∙ ∑(𝐿𝑜𝑠𝑡𝐿𝑜𝑎𝑑_𝑀𝑎𝑥𝑃𝑜𝑤𝑒𝑟𝐻𝑖,𝑛+ 𝐿𝑜𝑠𝑡𝐿𝑜𝑎𝑑_𝑀𝑖𝑛 𝑃𝑜𝑤𝑒𝑟𝐻𝑖,𝑛) 𝑛 + 𝑉𝑂𝐿𝐿𝑅𝑒𝑠𝑒𝑟𝑣𝑒∙ ∑(𝐿𝑜𝑠𝑡𝐿𝑜𝑎𝑑_𝑅𝑒𝑠𝑒𝑟𝑣𝑒2𝑈𝐻𝑖,𝑛+ 𝐿𝑜𝑠𝑡𝐿𝑜𝑎𝑑_𝑅𝑒𝑠𝑒𝑟𝑣𝑒2𝐷𝐻𝑖,𝑛) 𝑛 + 𝑉𝑂𝐿𝐿𝑅𝑎𝑚𝑝∙ ∑(𝐿𝑜𝑠𝑡𝐿𝑜𝑎𝑑_𝑅𝑎𝑚𝑝𝑈𝑝𝐻𝑖,𝑢+ 𝐿𝑜𝑠𝑡𝐿𝑜𝑎𝑑_𝑅𝑎𝑚𝑝𝐷𝑜𝑤𝑛𝐻𝑖,𝑢) 𝑢 ) ∙ 𝐷𝑢𝑟𝑎𝑡𝑖𝑜𝑛 ∀𝑢,𝑖
The costs terms related to start-up and shut-down are above zero whenever the units change their commitment status:
2 𝑖 = 1: 𝐶𝑜𝑠𝑡𝑆𝑡𝑎𝑟𝑡𝑈𝑝𝐻𝑖,𝑢≥𝐶𝑜𝑠𝑡𝑆𝑡𝑎𝑟𝑡𝑈𝑝𝑢∙ (𝐶𝑜𝑚𝑚𝑖𝑡𝑡𝑒𝑑𝐻𝑖,𝑢−𝐶𝑜𝑚𝑚𝑖𝑡𝑡𝑒𝑑𝐼𝑛𝑖𝑡𝑖𝑎𝑙𝑢) 𝐶𝑜𝑠𝑡𝑆ℎ𝑢𝑡𝐷𝑜𝑤𝑛𝐻𝑖,𝑢≥𝐶𝑜𝑠𝑡𝑆ℎ𝑢𝑡𝐷𝑜𝑤𝑛𝑢∙ (𝐶𝑜𝑚𝑚𝑖𝑡𝑡𝑒𝑑𝐼𝑛𝑖𝑡𝑖𝑎𝑙𝑢− 𝐶𝑜𝑚𝑚𝑖𝑡𝑡𝑒𝑑𝐻𝑖,𝑢) 𝑖 > 1: 𝐶𝑜𝑠𝑡𝑆𝑡𝑎𝑟𝑡𝑈𝑝𝐻𝑖,𝑢≥𝐶𝑜𝑠𝑡𝑆𝑡𝑎𝑟𝑡𝑈𝑝𝑢∙ (𝐶𝑜𝑚𝑚𝑖𝑡𝑡𝑒𝑑𝐻𝑖,𝑢− 𝐶𝑜𝑚𝑚𝑖𝑡𝑡𝑒𝑑𝐻𝑖−1,𝑢) 𝐶𝑜𝑠𝑡𝑆ℎ𝑢𝑡𝐷𝑜𝑤𝑛𝐻𝑖,𝑢≥𝐶𝑜𝑠𝑡𝑆ℎ𝑢𝑡𝐷𝑜𝑤𝑛𝑢∙ (𝐶𝑜𝑚𝑚𝑖𝑡𝑡𝑒𝑑𝐻𝑖−1,𝑢− 𝐶𝑜𝑚𝑚𝑖𝑡𝑡𝑒𝑑𝐻𝑖,𝑢)
In the previous equation, as in some of the following, a distinction is made between the equation for the first and subsequent periods. The equation for the first period takes into
9 account the commitment status of the unit before the beginning of the simulation, which is part of the information fed into the model.
Ramping costs are computed in the same manner:
3 𝑖 = 1: 𝐶𝑜𝑠𝑡𝑅𝑎𝑚𝑝𝑈𝑝𝐻𝑖,𝑢≥𝐶𝑜𝑠𝑡𝑅𝑎𝑚𝑝𝑈𝑝𝑢∙ (𝑃𝑜𝑤𝑒𝑟𝐻𝑖,𝑢− 𝑃𝑜𝑤𝑒𝑟𝐼𝑛𝑖𝑡𝑖𝑎𝑙𝑢) 𝐶𝑜𝑠𝑡𝑅𝑎𝑚𝑝𝐷𝑜𝑤𝑛𝐻𝑖,𝑢 ≥𝐶𝑜𝑠𝑡𝑅𝑎𝑚𝑝𝐷𝑜𝑤𝑛𝑢∙ (𝑃𝑜𝑤𝑒𝑟𝐼𝑛𝑖𝑡𝑖𝑎𝑙𝑢− 𝑃𝑜𝑤𝑒𝑟𝐻𝑖,𝑢) 𝑖 > 1: 𝐶𝑜𝑠𝑡𝑅𝑎𝑚𝑝𝑈𝑝𝐻𝑖,𝑢≥𝐶𝑜𝑠𝑡𝑅𝑎𝑚𝑝𝑈𝑝𝑢∙ (𝑃𝑜𝑤𝑒𝑟𝐻𝑖,𝑢− 𝑃𝑜𝑤𝑒𝑟𝐻𝑖−1,𝑢) 𝐶𝑜𝑠𝑡𝑅𝑎𝑚𝑝𝐷𝑜𝑤𝑛𝐻𝑖,𝑢≥𝐶𝑜𝑠𝑡𝑅𝑎𝑚𝑝𝐷𝑜𝑤𝑛𝑢∙ (𝑃𝑜𝑤𝑒𝑟𝐻𝑖−1,𝑢− 𝑃𝑜𝑤𝑒𝑟𝐻𝑖,𝑢)
It should be noted that in case of start-up and shut-down, the ramping costs are added to the objective function. Using start-up, shut-down and ramping costs at the same time should therefore be performed with care.
In the current formulation all other costs (fixed and variable) are considered as exogenous parameters. The variable production costs (in €/MW), are determined by fuel and emission prices corrected by the efficiency (which is considered to be constant for all levels of output in this version of the model) and the emission rate of the unit (equation 4):
4 𝐶𝑜𝑠𝑡𝑉𝑎𝑟𝑖𝑎𝑏𝑙𝑒𝑖,𝑢 = 𝑀𝑎𝑟𝑘𝑢𝑝𝑖,𝑢+ ∑ ( 𝐹𝑢𝑒𝑙𝑢,𝑓∙𝐹𝑢𝑒𝑙𝑃𝑟𝑖𝑐𝑒𝑖,𝑛,𝑓∙𝐿𝑜𝑐𝑎𝑡𝑖𝑜𝑛𝑢,𝑛 𝐸𝑓𝑓𝑖𝑐𝑖𝑒𝑛𝑐𝑦𝑢 ) 𝑛,𝑓 + ∑(𝐸𝑚𝑖𝑠𝑠𝑖𝑜𝑛𝑅𝑎𝑡𝑒𝑢,𝑝∙𝑃𝑒𝑟𝑚𝑖𝑡𝑃𝑟𝑖𝑐𝑒𝑝) 𝑝
The previous equation includes an additional mark-up parameter that is used for calibration and validation purposes.
Transmission costs are also considered to be exogenous, and they result from multiplying the energy flows through the network by the corresponding transmission price (exogenous). As regards load shedding, the model considers the possibility of voluntary load shedding resulting from contractual arrangements between generators and consumers. Additionally, in order to facilitate tracking and debugging of errors, the model also considers some variables representing the capacity the system is not able to provide when the minimum/maximum power, reserve, or ramping constraints are reached. These lost loads are a very expensive last resort of the system used when there is no other choice available. The different lost loads are assigned very high values (with respect to any other costs). This allows running the simulation without infeasibilities, thus helping to detect the origin of the loss of load. In a normal run of the model, without errors, all these variables are expected to be equal to zero.
2.2.2 Demand-related constraints
The main constraint to be met is the supply-demand balance, for each period and each zone, in the day-ahead market (equation 5). According to this restriction, the sum of all the power produced by all the units present in the node (including the power generated by the storage units), the power injected from neighbouring nodes, and the curtailed power from intermittent sources is equal to the load in that node, plus the power consumed for energy storage, minus the load interrupted and the load shed.
10 5 ∑(𝑃𝑜𝑤𝑒𝑟𝐻𝑖,𝑢∙𝐿𝑜𝑐𝑎𝑡𝑖𝑜𝑛𝑢,𝑛) 𝑢 + ∑(𝐹𝑙𝑜𝑤𝐻𝑖,𝑙∙𝐿𝑖𝑛𝑒𝑁𝑜𝑑𝑒𝑙,𝑛) 𝑙 −𝐶𝑢𝑟𝑡𝑎𝑖𝑙𝑚𝑒𝑛𝑡𝑛∙ 𝐶𝑢𝑟𝑡𝑎𝑖𝑙𝑒𝑑𝑃𝑜𝑤𝑒𝑟𝐻𝑖,𝑛 =𝐷𝑒𝑚𝑎𝑛𝑑𝐻ℎ,𝑛,𝐷𝐴+ ∑(𝑆𝑡𝑜𝑟𝑎𝑔𝑒𝐼𝑛𝑝𝑢𝑡𝐻ℎ,𝑠∙𝐿𝑜𝑐𝑎𝑡𝑖𝑜𝑛𝑟,𝑛) 𝑟 − 𝑆ℎ𝑒𝑑𝐿𝑜𝑎𝑑𝐻𝑖,𝑛 − 𝐿𝑜𝑠𝑡𝐿𝑜𝑎𝑑_𝑀𝑎𝑥𝑃𝑜𝑤𝑒𝑟𝑖,𝑛+ 𝐿𝑜𝑠𝑡𝐿𝑜𝑎𝑑_𝑀𝑖𝑛𝑃𝑜𝑤𝑒𝑟𝑖,𝑛
Besides that balance, the reserve requirements (upwards and downwards) in each node must be met as well. The reserve requirements considered in this model are an aggregation of secondary and tertiary reserves, which are typically brought online in periods shorter than an hour, the time step of this model. Therefore, additional equations and constraints must be defined for representing the up/down ramping requirements, by computing the ability of each unit to adapt its power output in periods below 60 minutes. For each power plant, the ability to increase its power is the ramp-up capability if it is already committed or the nominal power if it is stopped and its starting time is lower than M minutes (equation 6). This is to take into account that fast starting units could provide reserve (hydro units for secondary reserve, gas turbine for tertiary reserve).
6 𝑀𝑎𝑥𝑅𝑎𝑚𝑝2𝑈𝑖,𝑢≤𝑅𝑎𝑚𝑝𝑈𝑝𝑀𝑎𝑥𝑖𝑚𝑢𝑚𝑢∙ 𝐶𝑜𝑚𝑚𝑖𝑡𝑡𝑒𝑑𝐻𝑖,𝑢+ 𝐹𝑙𝑒𝑥𝑖𝑏𝑖𝑙𝑖𝑡𝑦𝑈𝑝𝑢∙ (1 − 𝐶𝑜𝑚𝑚𝑖𝑡𝑡𝑒𝑑𝐻𝑖,𝑢)
The parameter FlexibilityUpu is the maximum ramp rate reachable by the unit in M minutes
in case of cold start:
7 𝐼𝑓 𝑅𝑎𝑚𝑝𝑆𝑡𝑎𝑟𝑡𝑈𝑝𝑀𝑎𝑥𝑖𝑚𝑢𝑚𝑢≥𝑃𝑜𝑤𝑒𝑟𝑀𝑖𝑛𝑆𝑡𝑎𝑏𝑙𝑒𝑢∙ 60 𝑀
𝑇ℎ𝑒𝑛 𝐹𝑙𝑒𝑥𝑖𝑏𝑖𝑙𝑖𝑡𝑦𝑈𝑝𝑢=𝑅𝑎𝑚𝑝𝑆𝑡𝑎𝑟𝑡𝑈𝑝𝑀𝑎𝑥𝑖𝑚𝑢𝑚𝑢
𝐸𝑙𝑠𝑒 𝐹𝑙𝑒𝑥𝑖𝑏𝑖𝑙𝑖𝑡𝑦𝑈𝑝𝑢= 0
The maximum ramping rate is also limited by the available capacity margin between current and maximum power output (equation 8).
8 𝑀𝑎𝑥𝑅𝑎𝑚𝑝2𝑈𝑖,𝑢≤ (𝑃𝑜𝑤𝑒𝑟𝐶𝑎𝑝𝑎𝑐𝑖𝑡𝑦𝑢∙𝐴𝑣𝑎𝑖𝑙𝑎𝑏𝑖𝑙𝑖𝑡𝑦𝐹𝑎𝑐𝑡𝑜𝑟𝐻𝑢,𝑖 − 𝑃𝑜𝑤𝑒𝑟𝐻𝑖,𝑢) ∙
60 𝑀
The same applies to ramping down capabilities within periods below 60 minutes.
9 𝑀𝑎𝑥𝑅𝑎𝑚𝑝2𝐷𝑖,𝑢≤ max(𝑅𝑎𝑚𝑝𝐷𝑜𝑤𝑛𝑀𝑎𝑥𝑖𝑚𝑢𝑚𝑢,𝐹𝑙𝑒𝑥𝑖𝑏𝑖𝑙𝑖𝑡𝑦𝐷𝑜𝑤𝑛𝑢) ∙ 𝐶𝑜𝑚𝑚𝑖𝑡𝑡𝑒𝑑𝐻𝑖,𝑢
The parameter FlexibilityDownu is defined as the maximum ramp down rate at which the
unit can shut down in M minutes.
In case the unit cannot be shut-down in M minutes (and only in this case) the maximum ramping down capability is limited by the capacity margin between actual and minimum power: 10 𝐼𝑓 𝑅𝑎𝑚𝑝𝑆ℎ𝑢𝑡𝐷𝑜𝑤𝑛𝑀𝑎𝑥𝑖𝑚𝑢𝑚𝑢< 𝑃𝑜𝑤𝑒𝑟𝑀𝑖𝑛𝑆𝑡𝑎𝑏𝑙𝑒𝑢∙ 60 𝑀 𝑇ℎ𝑒𝑛 𝑀𝑎𝑥𝑅𝑎𝑚𝑝2𝐷𝑖,𝑢≤ (𝑃𝑜𝑤𝑒𝑟𝐻𝑖,𝑢 − 𝑃𝑜𝑤𝑒𝑟𝑀𝑖𝑛𝑆𝑡𝑎𝑏𝑙𝑒𝑢∙ 𝐶𝑜𝑚𝑚𝑖𝑡𝑡𝑒𝑑𝐻𝑖,𝑢) ∙ 60 𝑀 𝐸𝑙𝑠𝑒 𝑀𝑎𝑥𝑅𝑎𝑚𝑝2𝐷𝑖,𝑢 ≤ 𝑃𝑜𝑤𝑒𝑟𝐻𝑖,𝑢∙ 60 𝑀
The reserve requirements are defined by the users. In case no input is provided a default formula is used to evaluate the needs for secondary reserves as a function of the
11 maximum expected load for each day. The default formula is described by equation 11, as
defined by ENTSO-E [6, 7]:
11 𝐷𝑒𝑚𝑎𝑛𝑑𝑖,𝑛,2𝑈= √10 ∙ maxℎ (𝐷𝑒𝑚𝑎𝑛𝑑𝑖,𝑛,𝐷𝐴) + 1502− 150
Down reserves are defined as 50% of the upward margin:
12 𝐷𝑒𝑚𝑎𝑛𝑑𝑖,𝑛,2𝐷= 0.5 ∙𝐷𝑒𝑚𝑎𝑛𝑑𝑖,𝑛,2𝑈
The reserve demand should be fulfilled at all times by all the plants allowed to participate in the reserve market:
13 𝐷𝑒𝑚𝑎𝑛𝑑𝑖,𝑛,2𝑈≤ ∑(𝑀𝑎𝑥𝑅𝑎𝑚𝑝2𝑈𝑢,𝑡 𝑖,𝑢∙𝑇𝑒𝑐ℎ𝑛𝑜𝑙𝑜𝑔𝑦𝑢,𝑡∙𝑅𝑒𝑠𝑒𝑟𝑣𝑒𝑡∙𝐿𝑜𝑐𝑎𝑡𝑖𝑜𝑛𝑢,𝑛)
+ 𝐿𝑜𝑠𝑡𝐿𝑜𝑎𝑑_𝑅𝑒𝑠𝑒𝑟𝑣𝑒2𝑈𝐻𝑖,𝑛
The same equation applies to downward reserve requirements (2D).
2.2.3 Power output bounds
The minimum power output is determined by the must-run or stable generation level of the unit if it is committed:
14 𝑃𝑜𝑤𝑒𝑟𝑀𝑢𝑠𝑡𝑅𝑢𝑛𝐻𝑖,𝑢∙ 𝐶𝑜𝑚𝑚𝑖𝑡𝑡𝑒𝑑𝐻𝑖,𝑢≤ 𝑃𝑜𝑤𝑒𝑟𝐻𝑖,𝑢
On the other hand, the output is limited by the available capacity, if the unit is committed:
15 𝑃𝑜𝑤𝑒𝑟𝐻𝑖,𝑢≤𝑃𝑜𝑤𝑒𝑟𝐶𝑎𝑝𝑎𝑐𝑖𝑡𝑦𝑢∙𝐴𝑣𝑎𝑖𝑙𝑎𝑏𝑖𝑙𝑖𝑡𝑦𝐹𝑎𝑐𝑡𝑜𝑟𝐻𝑖,𝑢∙ 𝐶𝑜𝑚𝑚𝑖𝑡𝑡𝑒𝑑𝐻𝑖,𝑢
The power output in a given period also depends on the output levels in the previous and the following periods and on the ramping capabilities of the unit. If the unit was down, the ramping capability is given by the maximum start up ramp, while if the unit was online the limit is defined by the maximum ramp up rate. Those bounds are given by equation 16:
16 𝑖 = 1: 𝑃𝑜𝑤𝑒𝑟𝐻𝑖,𝑢≤ 𝑃𝑜𝑤𝑒𝑟𝐼𝑛𝑖𝑡𝑖𝑎𝑙𝑢 +𝐶𝑜𝑚𝑚𝑖𝑡𝑡𝑒𝑑𝐼𝑛𝑖𝑡𝑖𝑎𝑙𝑢∙𝑅𝑎𝑚𝑝𝑈𝑝𝑀𝑎𝑥𝑖𝑚𝑢𝑚𝑢 +(1 − 𝐶𝑜𝑚𝑚𝑖𝑡𝑡𝑒𝑑𝐼𝑛𝑖𝑡𝑖𝑎𝑙𝑢) ∙𝑅𝑎𝑚𝑝𝑆𝑡𝑎𝑟𝑡𝑈𝑝𝑀𝑎𝑥𝑖𝑚𝑢𝑚𝑢 +𝐿𝑜𝑠𝑡𝐿𝑜𝑎𝑑_𝑅𝑎𝑚𝑝𝑈𝑝𝐻𝑖,𝑢 𝑖 > 1: 𝑃𝑜𝑤𝑒𝑟𝐻𝑖,𝑢≤ 𝑃𝑜𝑤𝑒𝑟𝐻𝑖−1,𝑢 +𝐶𝑜𝑚𝑚𝑖𝑡𝑡𝑒𝑑𝐻𝑖−1,𝑢∙𝑅𝑎𝑚𝑝𝑈𝑝𝑀𝑎𝑥𝑖𝑚𝑢𝑚𝑢 +(1 − 𝐶𝑜𝑚𝑚𝑖𝑡𝑡𝑒𝑑𝐻𝑖−1,𝑢) ∙𝑅𝑎𝑚𝑝𝑆𝑡𝑎𝑟𝑡𝑈𝑝𝑀𝑎𝑥𝑖𝑚𝑢𝑚𝑢 +𝐿𝑜𝑠𝑡𝐿𝑜𝑎𝑑_𝑅𝑎𝑚𝑝𝑈𝑝𝐻𝑖,𝑢 And by equation 17:
12 17 𝑖 = 1: 𝑃𝑜𝑤𝑒𝑟𝐻𝑖,𝑢≤ 𝑃𝑜𝑤𝑒𝑟𝐶𝑎𝑝𝑎𝑐𝑖𝑡𝑦𝑢∙𝐴𝑣𝑎𝑖𝑙𝑎𝑏𝑖𝑙𝑖𝑡𝑦𝐹𝑎𝑐𝑡𝑜𝑟𝐻𝑖,𝑢∙ 𝐶𝑜𝑚𝑚𝑖𝑡𝑡𝑒𝑑𝐻𝑖,𝑢 +(1 − 𝐶𝑜𝑚𝑚𝑖𝑡𝑡𝑒𝑑𝐻𝑖,𝑢) ∙𝑅𝑎𝑚𝑝𝑆ℎ𝑢𝑡𝐷𝑜𝑤𝑛𝑀𝑎𝑥𝑖𝑚𝑢𝑚𝑢 +𝐿𝑜𝑠𝑡𝐿𝑜𝑎𝑑_𝑅𝑎𝑚𝑝𝐷𝑜𝑤𝑛𝐻𝑖,𝑢 𝑖 < 𝑐𝑎𝑟𝑑(𝑖): 𝑃𝑜𝑤𝑒𝑟𝐻𝑖,𝑢≤ 𝑃𝑜𝑤𝑒𝑟𝐶𝑎𝑝𝑎𝑐𝑖𝑡𝑦𝑢∙𝐴𝑣𝑎𝑖𝑙𝑎𝑏𝑖𝑙𝑖𝑡𝑦𝐹𝑎𝑐𝑡𝑜𝑟𝐻𝑖,𝑢∙ 𝐶𝑜𝑚𝑚𝑖𝑡𝑡𝑒𝑑𝐻𝑖+1,𝑢 +(1 − 𝐶𝑜𝑚𝑚𝑖𝑡𝑡𝑒𝑑𝐻𝑖+1,𝑢) ∙𝑅𝑎𝑚𝑝𝑆ℎ𝑢𝑡𝐷𝑜𝑤𝑛𝑀𝑎𝑥𝑖𝑚𝑢𝑚𝑢 +𝐿𝑜𝑠𝑡𝐿𝑜𝑎𝑑_𝑅𝑎𝑚𝑝𝐷𝑜𝑤𝑛𝐻𝑖,𝑢
Similarly, the ramp down capability is limited by the maximum ramp down or the maximum shut down ramp rate:
18 𝑖 = 1: 𝑃𝑜𝑤𝑒𝑟𝐼𝑛𝑖𝑡𝑖𝑎𝑙𝑢− 𝑃𝑜𝑤𝑒𝑟𝐻𝑖,𝑢≤ 𝐶𝑜𝑚𝑚𝑖𝑡𝑡𝑒𝑑𝐻𝑖,𝑢∙𝑅𝑎𝑚𝑝𝐷𝑜𝑤𝑛𝑀𝑎𝑥𝑖𝑚𝑢𝑚𝑢 +(1 − 𝐶𝑜𝑚𝑚𝑖𝑡𝑡𝑒𝑑𝐻𝑖,𝑢) ∙𝑅𝑎𝑚𝑝𝑆ℎ𝑢𝑡𝐷𝑜𝑤𝑛𝑀𝑎𝑥𝑖𝑚𝑢𝑚𝑢 +𝐿𝑜𝑠𝑡𝐿𝑜𝑎𝑑_𝑅𝑎𝑚𝑝𝐷𝑜𝑤𝑛𝐻𝑖,𝑢 𝑖 > 1: 𝑃𝑜𝑤𝑒𝑟𝐻𝑖−1,𝑢− 𝑃𝑜𝑤𝑒𝑟𝐻𝑖,𝑢≤ 𝐶𝑜𝑚𝑚𝑖𝑡𝑡𝑒𝑑𝐻𝑖,𝑢∙𝑅𝑎𝑚𝑝𝐷𝑜𝑤𝑛𝑀𝑎𝑥𝑖𝑚𝑢𝑚𝑢 +(𝐶𝑜𝑚𝑚𝑖𝑡𝑡𝑒𝑑𝐻𝑖−1,𝑢− 𝐶𝑜𝑚𝑚𝑖𝑡𝑡𝑒𝑑𝐻𝑖,𝑢) ∙𝑅𝑎𝑚𝑝𝑆ℎ𝑢𝑡𝐷𝑜𝑤𝑛𝑀𝑎𝑥𝑖𝑚𝑢𝑚𝑢 +𝐿𝑜𝑠𝑡𝐿𝑜𝑎𝑑_𝑅𝑎𝑚𝑝𝐷𝑜𝑤𝑛𝐻𝑖,𝑢
While the ramp up limitation is defined by:
19 𝑖 = 1: 𝑃𝑜𝑤𝑒𝑟𝐼𝑛𝑖𝑡𝑖𝑎𝑙𝑢− 𝑃𝑜𝑤𝑒𝑟𝐻𝑖,𝑢≤ 𝐶𝑜𝑚𝑚𝑖𝑡𝑡𝑒𝑑𝐼𝑛𝑖𝑡𝑖𝑎𝑙𝑢∙𝑅𝑎𝑚𝑝𝑈𝑝𝑀𝑎𝑥𝑖𝑚𝑢𝑚𝑢 +(𝐶𝑜𝑚𝑚𝑖𝑡𝑡𝑒𝑑𝐻𝑖,𝑢− 𝐶𝑜𝑚𝑚𝑖𝑡𝑡𝑒𝑑𝐼𝑛𝑖𝑡𝑖𝑎𝑙𝑢) ∙𝑅𝑎𝑚𝑝𝑆𝑡𝑎𝑟𝑡𝑈𝑝𝑀𝑎𝑥𝑖𝑚𝑢𝑚𝑢 +𝐿𝑜𝑠𝑡𝐿𝑜𝑎𝑑_𝑅𝑎𝑚𝑝𝑈𝑝𝐻𝑖,𝑢 𝑖 > 1: 𝑃𝑜𝑤𝑒𝑟𝐻𝑖,𝑢− 𝑃𝑜𝑤𝑒𝑟𝐻𝑖−1,𝑢≤ 𝐶𝑜𝑚𝑚𝑖𝑡𝑡𝑒𝑑𝐻𝑖−1,𝑢∙𝑅𝑎𝑚𝑝𝑈𝑝𝑀𝑎𝑥𝑖𝑚𝑢𝑚𝑢 +(𝐶𝑜𝑚𝑚𝑖𝑡𝑡𝑒𝑑𝐻𝑖,𝑢− 𝐶𝑜𝑚𝑚𝑖𝑡𝑡𝑒𝑑𝐻𝑖−1,𝑢) ∙𝑅𝑎𝑚𝑝𝑆𝑡𝑎𝑟𝑡𝑈𝑝𝑀𝑎𝑥𝑖𝑚𝑢𝑚𝑢 +𝐿𝑜𝑠𝑡𝐿𝑜𝑎𝑑_𝑅𝑎𝑚𝑝𝑈𝑝𝐻𝑖,𝑢
2.2.4 Minimum up and down times
The operation of the generation units is limited as well by the amount of time the unit has been running or stopped. Due to the physical characteristics of the generators, once a unit is started up it cannot be shut down immediately, while if the unit is shut down it may not be started immediately. These constraints can be expressed naturally in a non-linear form as:
20 (𝑇𝑖𝑚𝑒𝑈𝑝𝑢,𝑦,𝑚,𝑑,ℎ−1−𝑇𝑖𝑚𝑒𝑈𝑝𝑀𝑖𝑛𝑖𝑚𝑢𝑚𝑢) ∙ (𝐶𝑜𝑚𝑚𝑖𝑡𝑡𝑒𝑑𝐻ℎ−1,𝑢− 𝐶𝑜𝑚𝑚𝑖𝑡𝑡𝑒𝑑𝐻ℎ,𝑢) ≥ 0
21 (𝑇𝑖𝑚𝑒𝐷𝑜𝑤𝑛𝑢,𝑦,𝑚,𝑑,ℎ−1−𝑇𝑖𝑚𝑒𝐷𝑜𝑤𝑛𝑀𝑖𝑛𝑖𝑚𝑢𝑚𝑢) ∙ (𝐶𝑜𝑚𝑚𝑖𝑡𝑡𝑒𝑑𝐻ℎ−1,𝑢−𝐶𝑜𝑚𝑚𝑖𝑡𝑡𝑒𝑑𝐻ℎ,𝑢) ≤ 0
That is, the value of the time counter with respect to the minimum up time and down times determines the commitment status of the unit. In order to model the previous constraints linearly, it is necessary to keep track of the number of hours the unit must be online at the beginning of the simulation for having been online less than the minimum up time:
22 𝑇𝑖𝑚𝑒𝑈𝑝𝐿𝑒𝑓𝑡_𝐼𝑛𝑖𝑡𝑖𝑎𝑙𝑢
13 If the unit is initially started up, it has to remain committed until reaching the minimum up time:
23 ∑ (1 − 𝐶𝑜𝑚𝑚𝑖𝑡𝑡𝑒𝑑𝐻𝑖,𝑢)
𝑇𝑖𝑚𝑒𝑈𝑝𝐿𝑒𝑓𝑡_𝐼𝑛𝑖𝑡𝑖𝑎𝑙𝑢
𝑖=1
= 0
If the unit is started during the considered horizon, the time it has to remain online is TimeUpMinimum, but cannot exceed the time remaining in the simulated period. This is expressed in equation 24 and is pre-calculated for each time step of the period.
24 𝑇𝑖𝑚𝑒𝑈𝑝𝐿𝑒𝑓𝑡_𝐽𝑢𝑠𝑡𝑆𝑡𝑎𝑟𝑡𝑒𝑑𝑖,𝑢 = 𝑚𝑖𝑛{𝑐𝑎𝑟𝑑(𝑖) − 𝑜𝑟𝑑(𝑖) + 1,𝑇𝑖𝑚𝑒𝑈𝑝𝑀𝑖𝑛𝑖𝑚𝑢𝑚𝑢}
The equation imposing the unit to remain committed is written:
25 𝑖 = 1: ∑ 𝐶𝑜𝑚𝑚𝑖𝑡𝑡𝑒𝑑𝐻𝑖𝑖,𝑢 𝑖+𝑇𝑖𝑚𝑒𝑈𝑝𝐿𝑒𝑓𝑡_𝐽𝑢𝑠𝑡𝑆𝑡𝑎𝑟𝑡𝑒𝑑𝑖,𝑢−1 𝑖𝑖=𝑖 ≥ 𝑇𝑖𝑚𝑒𝑈𝑝𝐿𝑒𝑓𝑡_𝐽𝑢𝑠𝑡𝑆𝑡𝑎𝑟𝑡𝑒𝑑𝑖,𝑢∙ (𝐶𝑜𝑚𝑚𝑖𝑡𝑡𝑒𝑑𝐻𝑖,𝑢−𝐶𝑜𝑚𝑚𝑖𝑡𝑡𝑒𝑑𝐼𝑛𝑖𝑡𝑖𝑎𝑙𝑢) 𝑖 > 1: ∑ 𝐶𝑜𝑚𝑚𝑖𝑡𝑡𝑒𝑑𝐻𝑖𝑖,𝑢 𝑖+𝑇𝑖𝑚𝑒𝑈𝑝𝐿𝑒𝑓𝑡_𝐽𝑢𝑠𝑡𝑆𝑡𝑎𝑟𝑡𝑒𝑑𝑢−1 𝑖𝑖=𝑖 ≥𝑇𝑖𝑚𝑒𝑈𝑝𝐿𝑒𝑓𝑡_𝐽𝑢𝑠𝑡𝑆𝑡𝑎𝑟𝑡𝑒𝑑𝑖,𝑢∙ (𝐶𝑜𝑚𝑚𝑖𝑡𝑡𝑒𝑑𝐻𝑖,𝑢− 𝐶𝑜𝑚𝑚𝑖𝑡𝑡𝑒𝑑𝐻𝑖−1,𝑢)
The same method can be applied to the minimum down time constraint:
26 𝑇𝑖𝑚𝑒𝐷𝑜𝑤𝑛𝐿𝑒𝑓𝑡𝑢=
𝑚𝑖𝑛{24, (𝑇𝑖𝑚𝑒𝐷𝑜𝑤𝑛𝑀𝑖𝑛𝑖𝑚𝑢𝑚𝑢−𝑇𝑖𝑚𝑒𝐷𝑜𝑤𝑛𝐼𝑛𝑖𝑡𝑖𝑎𝑙𝑢) ∙ (1 −𝐶𝑜𝑚𝑚𝑖𝑡𝑡𝑒𝑑𝐼𝑛𝑖𝑡𝑖𝑎𝑙𝑢)}
Related to the initial status of the unit:
27 ∑ 𝐶𝑜𝑚𝑚𝑖𝑡𝑡𝑒𝑑𝐻𝑖,𝑢
𝑇𝑖𝑚𝑒𝐷𝑜𝑤𝑛𝐿𝑒𝑓𝑡𝑢
𝑖=1
= 0
The TimeDownLeft_JustStopped parameter is computed by:
28 𝑇𝑖𝑚𝑒𝐷𝑜𝑤𝑛𝐿𝑒𝑓𝑡_𝐽𝑢𝑠𝑡𝑆𝑡𝑜𝑝𝑝𝑒𝑑𝑖,𝑢= 𝑚𝑖𝑛{𝑐𝑎𝑟𝑑(𝑖) − 𝑜𝑟𝑑(𝑖) + 1,𝑇𝑖𝑚𝑒𝐷𝑜𝑤𝑛𝑀𝑖𝑛𝑖𝑚𝑢𝑚𝑢}
Finally, the equation imposing the time the unit has to remain de-committed is defined as:
29 𝑖 = 1: ∑ (1 − 𝐶𝑜𝑚𝑚𝑖𝑡𝑡𝑒𝑑𝐻𝑖,𝑢) 𝑖+𝑇𝑖𝑚𝑒𝐷𝑜𝑤𝑛𝐿𝑒𝑓𝑡_𝐽𝑢𝑠𝑡𝑆𝑡𝑜𝑝𝑝𝑒𝑑𝑖,𝑢−1 ℎℎ=ℎ ≥ 𝑇𝑖𝑚𝑒𝐷𝑜𝑤𝑛𝐿𝑒𝑓𝑡_𝐽𝑢𝑠𝑡𝑆𝑡𝑜𝑝𝑝𝑒𝑑𝑖,𝑢∙ (𝐶𝑜𝑚𝑚𝑖𝑡𝑡𝑒𝑑𝐼𝑛𝑖𝑡𝑖𝑎𝑙𝑢− 𝐶𝑜𝑚𝑚𝑖𝑡𝑡𝑒𝑑𝐻𝑖,𝑢) 𝑖 > 1: ∑ (1 − 𝐶𝑜𝑚𝑚𝑖𝑡𝑡𝑒𝑑𝐻ℎ,𝑢) 𝑖+𝑇𝑖𝑚𝑒𝐷𝑜𝑤𝑛𝐿𝑒𝑓𝑡_𝐽𝑢𝑠𝑡𝑆𝑡𝑜𝑝𝑝𝑒𝑑𝑢−1 ℎℎ=ℎ ≥𝑇𝑖𝑚𝑒𝐷𝑜𝑤𝑛𝐿𝑒𝑓𝑡_𝐽𝑢𝑠𝑡𝑆𝑡𝑜𝑝𝑝𝑒𝑑𝑖,𝑢∙ (𝐶𝑜𝑚𝑚𝑖𝑡𝑡𝑒𝑑𝐻𝑖−1,𝑢− 𝐶𝑜𝑚𝑚𝑖𝑡𝑡𝑒𝑑𝐻𝑖,𝑢) 2.2.5 Storage-related constraints
Generation units with energy storage capabilities (mostly large hydro reservoirs and pumped hydro storage units) must meet additional restrictions related to the amount of energy stored. Storage units are considered to be subject to the same constraints as
non-14 storage power plants. In addition to those constraints, storage-specific restrictions are added for the set of storage units (i.e. a subset of all units). These restrictions include the storage capacity, inflow, outflow, charging, charging capacity, charge/discharge efficiencies, etc. Discharging is considered as the standard operation mode and is therefore linked to the PowerH variable, common to all units.
The first constrain imposes that the energy stored by a given unit is bounded by a minimum value:
30 𝑆𝑡𝑜𝑟𝑎𝑔𝑒𝑀𝑖𝑛𝑖𝑚𝑢𝑚𝑠 ≤ 𝑆𝑡𝑜𝑟𝑎𝑔𝑒𝐿𝑒𝑣𝑒𝑙𝐻𝑖,𝑠
And the storage capacity:
31 𝑆𝑡𝑜𝑟𝑎𝑔𝑒𝐿𝑒𝑣𝑒𝑙𝐻𝑖,𝑠≤𝑆𝑡𝑜𝑟𝑎𝑔𝑒𝐶𝑎𝑝𝑎𝑐𝑖𝑡𝑦𝑠
The energy added to the storage unit is limited by the charging capacity. Charging is allowed only if the unit is not producing (discharging) at the same time (i.e. if th CommittedH, corresponding to the "normal" mode, is equal to 0).
32 𝑆𝑡𝑜𝑟𝑎𝑔𝑒𝐼𝑛𝑝𝑢𝑡𝐻𝑖,𝑠≤𝑆𝑡𝑜𝑟𝑎𝑔𝑒𝐶ℎ𝑎𝑟𝑔𝑖𝑛𝑔𝐶𝑎𝑝𝑎𝑐𝑖𝑡𝑦𝑠∙ (1 − 𝐶𝑜𝑚𝑚𝑖𝑡𝑡𝑒𝑑𝐻𝑖,𝑠)
Charge and discharge are limited by the level of charge of the storage unit:
33 𝑃𝑜𝑤𝑒𝑟𝐻𝑖,𝑠
𝑆𝑡𝑜𝑟𝑎𝑔𝑒𝐷𝑖𝑠𝑐ℎ𝑎𝑟𝑔𝑒𝐸𝑓𝑓𝑖𝑐𝑖𝑒𝑛𝑐𝑦𝑠+𝑆𝑡𝑜𝑟𝑎𝑔𝑒𝑂𝑢𝑡𝑓𝑙𝑜𝑤𝐻𝑖,𝑠−𝑆𝑡𝑜𝑟𝑎𝑔𝑒𝐼𝑛𝑓𝑙𝑜𝑤𝐻𝑖,𝑠≤ 𝑆𝑡𝑜𝑟𝑎𝑔𝑒𝐿𝑒𝑣𝑒𝑙𝐻𝑖,𝑠
34 𝑆𝑡𝑜𝑟𝑎𝑔𝑒𝐼𝑛𝑝𝑢𝑡𝐻𝑖,𝑠∙𝑆𝑡𝑜𝑟𝑎𝑔𝑒𝐶ℎ𝑎𝑟𝑔𝑖𝑛𝑔𝐸𝑓𝑓𝑖𝑐𝑖𝑒𝑛𝑐𝑦𝑠−𝑆𝑡𝑜𝑟𝑎𝑔𝑒𝑂𝑢𝑡𝑓𝑙𝑜𝑤𝐻𝑖,𝑠+𝑆𝑡𝑜𝑟𝑎𝑔𝑒𝐼𝑛𝑓𝑙𝑜𝑤𝐻𝑖,𝑠
≤𝑆𝑡𝑜𝑟𝑎𝑔𝑒𝐶𝑎𝑝𝑎𝑐𝑖𝑡𝑦𝑠− 𝑆𝑡𝑜𝑟𝑎𝑔𝑒𝐿𝑒𝑣𝑒𝑙𝐻𝑖,𝑠
Besides, the energy stored in a given period is given by the energy stored in the previous period, net of charges and discharges:
35 𝑖 = 1: 𝑆𝑡𝑜𝑟𝑎𝑔𝑒𝐿𝑒𝑣𝑒𝑙𝐼𝑛𝑖𝑡𝑖𝑎𝑙𝑠+𝑆𝑡𝑜𝑟𝑎𝑔𝑒𝐼𝑛𝑓𝑙𝑜𝑤𝐻𝑖,𝑠+ 𝑆𝑡𝑜𝑟𝑎𝑔𝑒𝐼𝑛𝑝𝑢𝑡𝐻𝑖,𝑠 ∙𝑆𝑡𝑜𝑟𝑎𝑔𝑒𝐶ℎ𝑎𝑟𝑔𝑖𝑛𝑔𝐸𝑓𝑓𝑖𝑐𝑖𝑒𝑛𝑐𝑦𝑠 = 𝑆𝑡𝑜𝑟𝑎𝑔𝑒𝐿𝑒𝑣𝑒𝑙𝐻𝑖,𝑠+𝑆𝑡𝑜𝑟𝑎𝑔𝑒𝑂𝑢𝑡𝑓𝑙𝑜𝑤𝐻𝑖,𝑠+ 𝑃𝑜𝑤𝑒𝑟𝐻𝑖,𝑠 𝑆𝑡𝑜𝑟𝑎𝑔𝑒𝐷𝑖𝑠𝑐ℎ𝑎𝑟𝑔𝑒𝐸𝑓𝑓𝑖𝑐𝑖𝑒𝑛𝑐𝑦𝑠 𝑖 > 1: 𝑆𝑡𝑜𝑟𝑎𝑔𝑒𝐿𝑒𝑣𝑒𝑙𝐻𝑖−1,𝑠+𝑆𝑡𝑜𝑟𝑎𝑔𝑒𝐼𝑛𝑓𝑙𝑜𝑤𝐻𝑖,𝑠+ 𝑆𝑡𝑜𝑟𝑎𝑔𝑒𝐼𝑛𝑝𝑢𝑡𝐻𝑖,𝑠 ∙𝑆𝑡𝑜𝑟𝑎𝑔𝑒𝐶ℎ𝑎𝑟𝑔𝑖𝑛𝑔𝐸𝑓𝑓𝑖𝑐𝑖𝑒𝑛𝑐𝑦𝑠 = 𝑆𝑡𝑜𝑟𝑎𝑔𝑒𝐿𝑒𝑣𝑒𝑙𝐻𝑖,𝑠+𝑆𝑡𝑜𝑟𝑎𝑔𝑒𝑂𝑢𝑡𝑓𝑙𝑜𝑤𝐻𝑖,𝑠+ 𝑃𝑜𝑤𝑒𝑟𝐻𝑖,𝑠 𝑆𝑡𝑜𝑟𝑎𝑔𝑒𝐷𝑖𝑠𝑐ℎ𝑎𝑟𝑔𝑒𝐸𝑓𝑓𝑖𝑐𝑖𝑒𝑛𝑐𝑦𝑠 2.2.6 Emission limits
The operating schedule also needs to take into account any cap on the emissions (not only CO2) from the generation units existing in each node:
36 ∑(𝑃𝑜𝑤𝑒𝑟𝐻𝑖,𝑢∙𝐸𝑚𝑖𝑠𝑖𝑜𝑛𝑅𝑎𝑡𝑒𝑢,𝑝∙𝐿𝑜𝑐𝑎𝑡𝑖𝑜𝑛𝑢,𝑛)
𝑢
≤𝐸𝑚𝑖𝑠𝑖𝑜𝑛𝑀𝑎𝑥𝑖𝑚𝑢𝑚𝑛,𝑝
2.2.7 Network-related constraints
The flow of power between nodes is limited by the capacities of the transmission lines:
15
38 𝐹𝑙𝑜𝑤𝐻𝑖,𝑙≤𝐹𝑙𝑜𝑤𝑀𝑎𝑥𝑖𝑚𝑢𝑚𝐻𝑖,𝑙
In this model a simple transport-problem approach is followed.
2.2.8 Curtailment
If curtailment of intermittent generation sources is allowed in one node, the amount of curtailed power is bounded by the output of the renewable (tr) units present in that node:
39 𝐶𝑢𝑟𝑡𝑎𝑖𝑙𝑒𝑑𝑃𝑜𝑤𝑒𝑟𝐻𝑖,𝑛 ≤ ∑(𝑃𝑜𝑤𝑒𝑟𝐻𝑖,𝑢∙𝑇𝑒𝑐ℎ𝑛𝑜𝑙𝑜𝑔𝑦𝑢,𝑡𝑟∙𝐿𝑜𝑐𝑎𝑡𝑖𝑜𝑛𝑢,𝑛)
𝑢,𝑡𝑟
∙𝐶𝑢𝑟𝑡𝑎𝑖𝑙𝑚𝑒𝑛𝑡𝑛
2.2.9 Load shedding
If load shedding is allowed in a node, the amount of shed load is limited by the shedding capacity contracted on that particular node (e.g. through interruptible industrial contracts).
40 𝑆ℎ𝑒𝑑𝐿𝑜𝑎𝑑𝑖,𝑛≤𝐿𝑜𝑎𝑑𝑆ℎ𝑒𝑑𝑑𝑖𝑛𝑔𝑖,𝑛
3 Implementation
The model is implemented in GAMS and solved with CPLEX. The code is structured in blocks as follows:
Definition of datasets and options
Definition of sets
Definition of parameters
Data import from Excel
Definition of variables
Assignments of initial values to specific parameters
Declaration and definition of equations
Model definition (list of equations included in the model)
Solve loop (related to date-based inputs) o Definition of current and next day
o Assignment of parameter values (from date-based parameters to loop-indexed parameters)
o Definition of "must run" levels as a function of the minimum stable generation and the availability factor
o Definition of time counters to keep track the amount of time units are online and offline
o Solve statement
o Update of time counters
o Assignment of final values to initial values for the next day
Definition of output parameters
Assignment of values to output parameters.
16
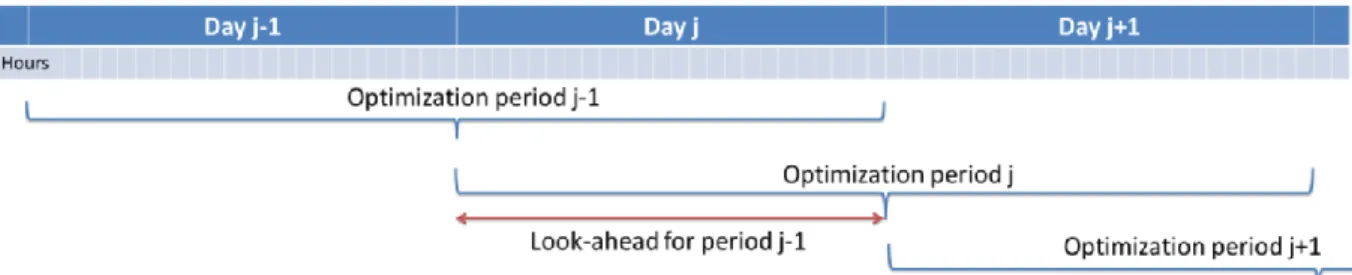
3.1 Rolling horizon
The mathematical problem described in the previous sections could in principle be solved for a whole year split into time steps of one hour, but with all likelihood the problem would become extremely demanding in computational terms when attempting to solve the model with a realistically sized dataset. Therefore, the problem is split into smaller optimization problems that are run recursively throughout the year. Figure 1 shows an example of such approach, in which the optimization horizon is one day, with a look-ahead (or overlap) period of one day. The initial values of the optimization for day j are the final values of the optimization of the previous day. The look-ahead period is modelled to avoid issues related to the end of the optimization period such as emptying the hydro reservoirs, or starting low-cost but non-flexible power plants. In this case, the optimization is performed over 48 hours, but only the first 24 hours are conserved.
Figure 1: time horizons of the optimization with look-ahead period
3.2 Data sources
The sources of information consulted for developing the case study shown in section 4 are listed below
Basic generation unit data (capacity, location, fuel, technology type, etc.) from Platts' World Electric Power Plant database [8].
Demand and availability data from TSOs [9, 10]
Fossil fuel prices from IEA [11].
Plant ramping parameters from VGB Powertech [12], VDE [13], and scientific literature [14, 15, 16].
Plant availability from VGB KISSY reports [12].
4 Illustrative results
To illustrate how the Dispa-SET model can be used to evaluate the impact of variable renewable energy (VRE) on the power system, a particular area is modelled using historical data as input. The selected area is the Belgian power system, due to the availability of data on loads, generation, and interconnections on this area.
The selected time period for the simulation is a one year period running from October 1st
2012, till September 30th 2013. The selection of the 2012-2013 winter instead of
2013-2014 is made in consideration of the fact that the latter was very mild, which might not be representative of usual operating conditions.
During the considered period, the net offtake was 81.06 TWh. The minimum and maximum loads are 5.9 GW and 13.4 GW, respectively. The net imports are significant and amounted
17 to 14.2 TWh, as Belgium was importing from France and the Netherlands during most of the time. The analysis was conducted using the 15-min data for the Belgian Transmission grid, operated by Elia [10], including:
Vertical load data
Power generation disaggregated by fuel type
Interconnections and storage (pumped hydro) throughout the year
VRE (wind and solar) generation and forecasts
There were 120 units connected to the transmission grid and subject to CIPU contracts (Contract for the Injection of Production Units), some of which have been disconnected between 2012 and 2013.
The relevant data include the type of power plant, minimum and maximum capacity, starting time, ramp up and down times, and minimum up and down times. When possible, the characteristics of the individual power plants they have been gathered from the power plants utilities. Generic values from the literature [16, 13, 17]) have also been used when no other data was available.
Fuel costs have been obtained using the Quarterly IEA statistics [11].
4.1 Model inputs and parameters
Data sources for such a unit commitment model are diverse and most generally not standardized. A pre-processing tool is therefore necessary to format the data according to Table 1 and Table 2. This tool is written in Python and takes as input the data tables in various formats. The output is a “.gdx” file readable by GAMS.
The hourly load curve is averaged from the available 15-min data. A residual load is defined as the load seen by the Belgian TSO during 2012-2013 when interconnections have been added and when the effect of additional VRE capacity has been subtracted:
41 𝐿𝑜𝑎𝑑𝑟𝑒𝑠𝑖𝑑𝑢𝑎𝑙 = 𝐿𝑜𝑎𝑑 − 𝑃𝑤𝑖𝑛𝑑 − 𝑃𝑠𝑜𝑙𝑎𝑟− 𝐿𝑜𝑠𝑠𝑒𝑠𝑔𝑟𝑖𝑑+ 𝐼𝑛𝑡𝑒𝑟𝑐𝑜𝑛𝑛𝑒𝑐𝑡𝑖𝑜𝑛𝑠
It was decided to include the interconnections into the residual load because of the difficulty to model them without a proper model of the neighbouring countries, and because the line capacity limits are not known. This methodology ensures that the imports are at its maximum level during the most critical hours of the year.
Pwind and Psolar are the historical VRE generation curves scaled according to the installed
capacity in the considered scenario. The grid losses are evaluated as a function of the current load using a calibrated polynomial curve.
Since this model focuses on the available technical flexibility and not on accurate market modelling, it is run using the measured historical data, and not the day-ahead forecasted load and VRE production. This can be partly justified by the fact that a fraction of the forecast errors can be solved on the intra-day market. This perfect foresight hypothesis is however optimistic and a more detailed stochastic simulation should be performed to refine the results.
The introduction of variable renewable on the grid entails increased ramping rates at different time scales (e.g. 15 min, 1 hours, 6 hours, etc.). The model time step being one hour, it is not straightforward to simulate the 15-min ramping needs. This is addressed by considering them as reserve constraints: the maximum 15-min ramp up/down rate is
18 computed for each hour of the simulation, and the required flexible capacity to fulfil this demand is put aside (i.e. not available for load following). This is performed using the reserve constraint of Dispa-SET: the automatic Frequency Restoration reserves (FRRa), the manual Frequency Restoration reserves (FRRm), and the 15-min ramping requirements are merged into one single variable:
42 𝑅𝑒𝑠𝑒𝑟𝑣𝑒𝑢𝑝/𝑑𝑜𝑤𝑛= 𝐹𝑅𝑅𝑎+ max (𝐹𝑅𝑅𝑚, 𝑅𝑎𝑚𝑝𝑖𝑛𝑔15,𝑚𝑎𝑥,𝑢𝑝/𝑑𝑜𝑤𝑛)
The “max” function ensures that enough flexibility is made available for ramping, but also that enough tertiary reserve (FRRm) was contracted in case the ramping needs are low. The values of 𝐹𝐹𝑅𝑎 and 𝐹𝑅𝑅𝑚 are imposed using the Elia 2018 reserve study [18]. This
study presents the advantage of evaluating the reserve needs with increased penetration of VRE, which is of particular relevance in the scope of this work. An FRRa value of 140 MW is recommended for the base case (the year 2013), and a value of 172 MW is recommended for 2018, with a nominal capacity of VRE which has increased from 3.2 to 8 GW in the meantime. The required secondary reserves can therefore be expressed as a linear function of the VRE capacity with the following equation:
43 𝐹𝑅𝑅𝑎 = 140 +172 − 140
8 − 3.2 ∙ (𝑃𝑉𝑅𝐸− 3.2)
A similar approach is used for the evaluation of the tertiary reserve (FRRm) needs. These needs are one order of magnitude higher than for the secondary reserve, with values up/down around 1000 MW.
As aforementioned, data is provided for 120 CIPU units connected to the transmission grid. However, some of these units present a low capacity and a high flexibility, such as the turbojets whose output power does not exceed a few MW and which can reach full power in less than 15 minutes. For these units, a unit commitment model with a time step of 1 hour is unnecessary and computationally inefficient. Therefore, these units are merged into one single, highly flexible unit with averaged characteristics.
The minimum and maximum capacities of new aggregated units (indicated by *) are given by: 44 𝑃𝑚𝑖𝑛∗ = min 𝑗 (𝑃𝑗,𝑚𝑖𝑛) 𝑃𝑚𝑎𝑥∗ = ∑(𝑃 𝑗,𝑚𝑎𝑥) 𝑗
The unit marginal (or variable cost) is given by:
45 𝐶𝑜𝑠𝑡𝑉𝑎𝑟𝑖𝑎𝑏𝑙𝑒∗ =∑ (𝑃𝑗 𝑗,𝑚𝑎𝑥∙ 𝐶𝑜𝑠𝑡𝑉𝑎𝑟𝑖𝑎𝑏𝑙𝑒,𝑗)
𝑃𝑚𝑎𝑥∗
The start-up/shut-down costs are transformed into ramping costs (example with ramp-up):
46 𝐶𝑜𝑠𝑡𝑅𝑎𝑚𝑝𝑈𝑝∗ =∑ (𝑃𝑗 𝑗,𝑚𝑎𝑥∙ 𝐶𝑜𝑠𝑡𝑅𝑎𝑚𝑝𝑈𝑝,𝑗)
𝑃𝑚𝑎𝑥∗ +
∑ (𝐶𝑜𝑠𝑡𝑗 𝑆𝑡𝑎𝑟𝑡𝑈𝑝,𝑗) 𝑃𝑚𝑎𝑥∗
19 Other characteristics, such as the plant efficiency, the minimum up/down times or the CO2
emissions are averaged. It should however be noted that only very similar units are aggregated, which does not lead to significant averaging errors since their characteristic are equal or very close to one another. Using this methodology, the number of units could be significantly reduced, from 120 to 45.
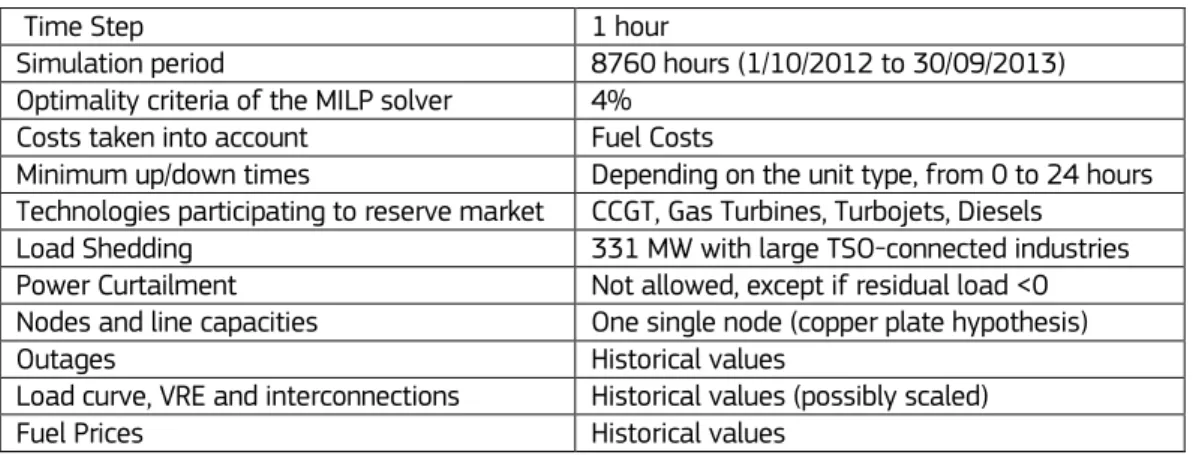
The main model assumptions, inputs and parameters are summarized in Table 4.
Table 4: modeling assumptions
Time Step 1 hour
Simulation period 8760 hours (1/10/2012 to 30/09/2013)
Optimality criteria of the MILP solver 4%
Costs taken into account Fuel Costs
Minimum up/down times Depending on the unit type, from 0 to 24 hours
Technologies participating to reserve market CCGT, Gas Turbines, Turbojets, Diesels
Load Shedding 331 MW with large TSO-connected industries
Power Curtailment Not allowed, except if residual load <0
Nodes and line capacities One single node (copper plate hypothesis)
Outages Historical values
Load curve, VRE and interconnections Historical values (possibly scaled)
Fuel Prices Historical values
4.2 Simulations
To illustrate the model capabilities, different “what if” scenarios are defined and simulated. A “base scenario” is first defined, corresponding to the period 2012-2013. This allows comparing the simulation results with the actual generation data. Then, different simulations are performed with increasing share of VRE to evaluate the flexibility of the system.
4.2.1 Base case
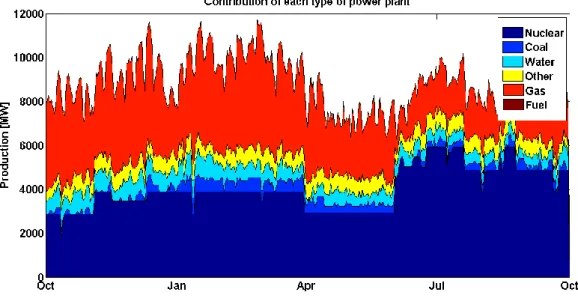
The base scenario corresponds to the actual state of the park and of the consumption during the year 2012-2013. The comparison between simulation and historical data is available in Figure 2 and Figure 3. A fair agreement between both trends is stated. It should be noted that wind is not displayed because it has been netted from the load. The whole simulation showed that the power system was able to meet the demand (in terms of ramping and max capacity) without issue in the base case. However, it is interesting to note that load shedding had to be activated two times during the simulation, on January 17th at 9h45 (71 MW) at 18h45 (303 MW). This date indeed corresponds to the only day in the year during which the TSO had to activate the interruptible load contracts. It should also be noted that this results was obtained without tuning the model parameters.
20
Figure 2: simulated generation throughout the year
Figure 3: historical values of generation throughout the year
4.2.2 Increasing VRE penetration scenarios
In these scenarios, all power plants are kept online as in the period 2012-2013, and the share of VRE is increased. The nominal installed power of wind and PV is increased successively by 4, 8 and 12 GW with respect to the base case, assuming an equal share between the two technologies.
21
Table 5: characteristics of the residual with different VRE penetration scenarios
Base Case 4 GW VRE 8 GW VRE 12 GW VRE
Additional VRE Share of total [%] 0.00 8.50 17.00 25.50
Load Max power [GW] 11.97 11.64 11.54 11.40
Min power [GW] 3.93 2.43 0.00 0.00 Ramping, 15 minutes Up [GW/h] 4.99 5.59 8.88 13.03 Down [GW/h] 4.71 4.8 8.91 13.36 Ramping, 1 hour Up [GW/h] 2.08 2.46 2.87 3.60 Down [GW/h] 2.09 2.09 2.46 3.56 Ramping, 6 hours Up [GW/h] 0.78 0.81 0.911 1.10 Down [GW/h] 0.63 0.65 0.851 9.50
Table 5 summarizes the characteristic of the residual load in the different scenarios. The provided ramping values are maximum values for the whole year. It can be stated that VRE do not have a significant influence on the maximum load, but decrease the minimum residual load, which becomes null for 8 GW of additional VRE, corresponding to 17% of the total yearly consumption. The maximum ramping constraints are shown for 3 different timeframes, and logically increase with the amount of VRE.
Simulations results indicate that enough technical flexibility is available for the base case and the 2 first scenarios. However, for the “12 GW VRE” scenario, ramping capabilities are insufficient during 3 time periods for downward ramping and 2 time periods for upwards ramping.
Furthermore, Figure 4 shows the impact of VRE penetration on the operation of CCGT plants throughout the year. The number of start-ups logically increases with the share of renewables. However, the number of operating hours only decreases for the 4GW case compared to the base case. It then slightly increases. This is due to the flexibility required for balancing VRE generation, which lead to optimization problem to commit CCGT plants instead of other units such as nuclear plants.
Figure 4: number of ON/OFF cycles throughout the year and average number of operating hours for CCGT plants
5 Conclusions and future work
This document has described the formulation and implementation of Dispa-SET 2.0, a unit commitment and dispatch model of the power system developed by the Joint Research Centre's Institute for Energy and Transport. The model aims at representing with a high
0 500 1000 1500 2000 2500 3000 3500 4000 4500 Base case 4 GW VRE 8 GW VRE 12 GW VRE CCGT hours CCGT cycles
22 level of detail the short-term operation of large-scale power systems, in order to be able of addressing properly different research topics relevant for supporting European energy policy making, such as the impact of increasing penetration of renewable energy sources. To illustrate the model capabilities, a simulation has been run using historical data for the case of Belgium. The comparison between the historical data and the simulation indicates a fairly good agreement. Additional simulations have also been performed to assess the impact of increasing shares of VRE. Results indicate that there is enough technical flexibility available to balance a significant amount of renewable (up to 8 GW, corresponding to an additional share of 17%). For higher penetration scenarios, more flexibility would be required, e.g. by increased investments in flexible units (OCGT, Turbojets, CCGT, etc.), storage or demand response measures.
This preliminary work will be continued shortly by developing the code in order to cover all EU member states, add more basic features, build a European dataset to feed the model, and develop input/output interfaces for final users. In the longer-term, some other envisaged improvements would be:
The inclusion of a better representation of reserve needs, distinguishing between different types of reserves (secondary and tertiary).
The addition of a capacity planning module.
The addition of new constraints (e.g. hydropower and water requirements for cooling).
The addition of stochastic features.
23
6 References
[1] GAMS, “GAMS home page,” [Online]. Available: http://www.gams.com/. [2] IBM, “CPLEX solver,” [Online]. Available:
http://www-01.ibm.com/software/commerce/optimization/cplex-optimizer/.
[3] J. Arroyo and A. Conejo, “Optimal response of a thermal unit to an electricity spot market,” IEEE Transactions on Power Systems, vol. 15, no. 3, pp. 1098-1104, 2000. [4] M. Carrión and J. M. Arroyo, “A computationally efficient mixed-integer linear
formulation for the thermal unit commitment problem,” IEEE Transactions on Power Systems, vol. 21, no. 3, pp. 1371-1378, 2006.
[5] G. Morales España, J. M. Latorre and A. Ramos, “Tight and compact MILP formulation for the thermal unit commitment problem,” IEEE Transactions on Power Systems, vol. 28, no. 4, pp. 4897-4908, 2013.
[6] M. Milligan, P. Donohoo, D. Lew, E. Ela, B. Kirby, H. Holttinen, E. Lannoye, D. Flynn, M. O'Malley, N. Miller, P. B. Eriksen, A. Gottig, B. Rawn, M. Gibescu, E. Gómez Lázaro, A. Robitaille and I. Kamwa, “Operating reserves and wind power integration: an international comparison,” in 9th Annual International Workshop on Large-Scale Integration of Wind Power into Power Systems, Quebec, 2013.
[7] ENTSO-E, “Operation handbook, Appendix I, Load Frequency Control and Performance,” 2004.
[8] “World electric power plants database,” McGraw Hill Financial, 2014. [Online]. Available: http://www.platts.com/products/world-electric-power-plants-database. [Accessed 23 9 2014].
[9] ENTSO-E, “European Network of Transmission System Operators for Electricity,” [Online]. Available: https://www.entsoe.eu/Pages/default.aspx.
[10] ELIA, “Grid Data,” [Online]. Available: http://www.elia.be/en/grid-data. [Accessed 17 08 2014].
[11] IEA Statistics, “Oil, Gas, Coal And Electricity. Quarterly Startistics – Fourth Quarter 2013,” OCDE, Paris, 2013.
[12] H. Wels, R. Van Beek, J. Aydt, J.-F. Lehougre and S. Prost, “VGB Research Project 361 - Reliability Indicators with KISSY (VGB Power Plant Information System),” VGB
PowerTech, Essen, 2013.
[13] G. Brauner, W. Glaunsinger, S. Bofinger, M. John, W. Magin, I. Pyc, S. Schüler, S. Schulz, U. Schwing, P. Seydel and F. Steinke, “Erneuerbare Energie braucht flexible Kraftwerke - Szenarien bis 2020,” VDE Verband de Elektrotechnik, Frankfurt am Main, 2012. [14] A. Schröder, F. Kunz, R. Mendelevitch and C. von Hirschhausen, “Current and prospective
costs of electricity generation until 2050,” DIW, Berlin, 2013.
[15] J. Egerer, C. Gerbaulet, R. Ihlenburg, F. Kunz, B. Reinhard, C. von Hirschhausen, A. Weber and J. Weibezahn, “Electricity sector data for policy-relevant modeling,” DIW, Berlin, 2014.
[16] E. A. F. G. Bruynooghe Christiane, “Load-following operating mod at Nuclear power plants,” Joint Research Centre, Publications Office of the European Union, 2010. [17] R. L. M. N. F. a. J. D. Domenichini, “Operating Flexibility of Power Plants with Carbon
24 [18] Elia, “Evolution of Ancillary services needs to balance the Belgian Control area towards
2018,” 2013.
[19] S. Simoes, W. Nijs, P. Ruiz Castello, A. Sgobbi, D. Radu, P. Bolat, C. Thiel and E. Peteves, “The JRC-EU-TIMES model - Assessing the long-term role of the SET Plan Energy technologies,” Publications Office of the European Union, 2013.
25
Europe Direct is a service to help you find answers to your questions about the European Union Freephone number (*): 00 800 6 7 8 9 10 11
(*) Certain mobile telephone operators do not allow access to 00 800 numbers or these calls may be billed.
A great deal of additional information on the European Union is available on the Internet. It can be accessed through the Europa server http://europa.eu.
How to obtain EU publications
Our publications are available from EU Bookshop (http://bookshop.europa.eu), where you can place an order with the sales agent of your choice.
The Publications Office has a worldwide network of sales agents.
You can obtain their contact details by sending a fax to (352) 29 29-42758.
European Commission
EUR 27015 EN – Joint Research Centre – Institute for Energy and Transport Title: Dispa-SET 2.0: unit commitment and power dispatch model
Authors: Ignacio HIDALGO GONZÁLEZ, Sylvain QUOILIN, Andreas ZUCKER Luxembourg: Publications Office of the European Union
2014 – 24 pp. – 21.0 x 29.7 cm
EUR – Scientific and Technical Research series – ISSN 1831-9424 (online), ISSN 1018-5593 (print) ISBN 978-92-79-44690-0 (PDF)
ISBN 978-92-79-44691-7 (print) doi:10.2790/399921
26
ISBN 978-92-79-44690-0 doi:10.2790/399921
JRC Mission
As the Commission’s in-house science service, the Joint Research Centre’s mission is to provide EU policies with independent, evidence-based scientific and technical support throughout the whole policy cycle.
Working in close cooperation with policy Directorates-General, the JRC addresses key societal challenges while stimulating innovation through developing new methods, tools and standards, and sharing its know-how with
the Member States, the scientific community and international partners.
Serving society Stimulating innovation Supporting legislation LD -NA -27 -015 -EN -N