498 • American Journal of Botany 107(3): 498–509, 2020; http://www.wileyonlinelibrary.com/journal/AJB © 2020 Botanical Society of America Studies on the population genetic structure of African trees
have largely focused on rainforest species (e.g., Hardy et al., 2013; Daïnou et al., 2014, 2016; Duminil et al., 2015; Ikabanga et al., 2017; Demenou et al., 2018; Monthe et al., 2018). In con-trast, the evolutionary history of trees from the drier Sudanian and Zambezian regions, situated respectively north and south of
the Guineo-Congolian rainforest (Fig. 1), is still largely undocu-mented. In these phytogeographic regions, trees occur in savan-nah, woodlands, dry forests or gallery forests, thus, in vegetation types that cover a wide range of density in tree cover. Therefore, we can expect that the responses to paleoclimatic change and gene flow in these vegetation types differ from those occurring in
Population genomics of the widespread African savannah
trees Afzelia africana and Afzelia quanzensis reveals no
significant past fragmentation of their distribution ranges
Armel S. L. Donkpegan1,2,3,10 , Rosalía Piñeiro4,5, Myriam Heuertz6 , Jérôme Duminil2,7,8, Kasso Daïnou1,2,9, Jean-Louis Doucet1, and Olivier J. Hardy2Manuscript received 9 August 2019; revision accepted 13 January 2020.
1 Forest is Life, TERRA Teaching and Research Centre, Gembloux
Agro-Bio Tech, University of Liège, 2 Passage des Déportés, B-5030 Gembloux, Belgium
2 Evolutionary Biology and Ecology Unit, CP 160/12, Faculté des
Sciences, Université Libre de Bruxelles, 50 avenue F. D. Roosevelt, B-1050 Brussels, Belgium
3 Univ. Bordeaux, INRAE, BFP, 71 Avenue Edouard Bourlaux, F-33882
Villenave d'Ornon, France
4 University of Exeter, Geography, College of Life and Environmental
Sciences, Stocker road, EX44QD, Exeter, UK
5 Evolutionary Genomics, Centre for Geogenetics - Natural History
Museum of Denmark, Øster Voldgade 5-7, 1350 Copenhagen K, Denmark
6 Univ. Bordeaux, INRAE, BIOGECO, 69 route d'Arcachon, F-33610
Cestas, France
7 DIADE, IRD, University of Montpellier, 911 Avenue Agropolis,
BP 64501, 34394 Montpellier, France
8 Bioversity International, Forest Genetic Resources and Restoration
Programme, Sub-Regional Office for Central Africa, P.O. Box 2008 Messa, Yaoundé, Cameroon
9 Université d'Agriculture de Kétou, BP: 43, Kétou, Benin
10Author for correspondence (e-mail: armel.donkpegan@gmail.com) Citation: Donkpegan, A. S. L., R. Piñeiro, M. Heuertz, J. Duminil,
K. Daïnou, J.-L. Doucet, and O. J. Hardy. 2020. Population genomics of the widespread African savannah trees Afzelia africana and Afzelia quanzensis reveals no significant past fragmentation of their distribution ranges. American Journal of Botany 107(3): 498–509.
doi:10.1002/ajb2.1449
PREMISE: Few studies have addressed the evolutionary history of tree species from African savannahs. Afzelia contains economically important timber species, including two species widely distributed in African savannahs: A. africana in the Sudanian region and
A. quanzensis in the Zambezian region. We aimed to infer whether these species
underwent range fragmentation and/or demographic changes, possibly reflecting how savannahs responded to Quaternary climate changes.
METHODS: We characterized the genetic diversity and structure of these species across their distribution ranges using nuclear microsatellites (SSRs) and genotyping-by-sequencing (GBS) markers. Six SSR loci were genotyped in 241 A. africana and 113 A. quanzensis individuals, while 2800 high-quality single nucleotide polymorphisms (SNPs) were identified in 30 A. africana individuals.
RESULTS: Both species appeared to be mainly outcrossing. The kinship between individuals decayed with the logarithm of the distance at similar rates across species and markers, leading to relatively small Sp statistics (0.0056 for SSR and 0.0054 for SNP in A. africana, 0.0075 for SSR in A. quanzensis). The patterns were consistent with isolation by distance expectations in the absence of large-scale geographic gradients. Bayesian clustering of SSR genotypes did not detect genetic clusters within species. In contrast, SNP data resolved intraspecific genetic clusters in A. africana, illustrating the higher resolving power of GBS. However, these clusters revealed low levels of differentiation and no clear geographical entities, so that they were interpreted as resulting from the isolation by distance pattern rather than from past population fragmentation.
CONCLUSIONS: These results suggest that populations have remained connected throughout the large, continuous savannah landscapes. The absence of clear phylogeographic discontinuities, also found in a few other African savannah trees, indicates that their distribution ranges have not been significantly fragmented during the climatic oscillations of the Pleistocene, in contrast to patterns commonly found in African rainforest trees.
KEY WORDS Afzelia; Fabaceae - Detarioideae; demographic expansion; isolation by distance; kinship; savannah trees; SNPs; spatial genetic structure; SSRs.
the rainforests. The climatic changes of the Pleistocene have had a significant impact on the savannah vegetation; however, they did not necessarily lead to fragmentation as usually assumed for the African rainforests (Maley, 1996). During the dry and cold glacial periods, savannahs expanded in the tropical regions that were occupied by rainforest, while rainforests probably became frag-mented and survived in fragfrag-mented refugia (Bonnefille, 2007). At extreme latitudes, the savannah receded to the advance of steppes and desert (Lioubimtseva et al., 1998). Conversely, during the humid interglacial periods, savannahs have been replaced by rainforests near the equator, but were able to expand northward and southward at extreme latitudes (Quézel, 1965; Lézine, 1989; Waller and Salzmann, 1999; Salzmann et al., 2002; Vincens et al., 2006; Watrin et al., 2009). In the absence of evidence of past frag-mentation, we may expect that widespread savannah trees exhibit only weak or no genetic discontinuities within species, although some degree of genetic structuring may result from isolation by distance under limited seed and pollen dispersal.
To our knowledge, only five savannah tree species have been ge-netically investigated in Africa using population genetics approaches
at large scales. Three of the species occur in the Sudanian savannah (northern hemisphere): the shea tree (Vitellaria paradoxa; Allal et al., 2011; Logossa et al., 2011), the African mahogany (Khaya
senegalensis; Sexton et al., 2015), and the locust bean (Parkia bi-globosa; Lompo et al., 2018). The other two species have a
Sudano-Zambezian distribution (northern and southern hemispheres): the baobab (Adansonia digitata; Tsy et al., 2009; Kyndt et al., 2009) and Arabic gum (Acacia senegal; Odee et al., 2012; Lyam et al., 2018). Within the Sudanian savannah, weak genetic structure was de-tected in K. senegalensis and A. digitata, while moderate differen-tiation was found in A. senegal, mostly in chloroplast markers. For
V. paradoxa and P. biglobosa, genetic discontinuities in the form
of parapatric genetic clusters were detected in the Sudanian savan-nah, although in both cases widespread genetically homogeneous clusters were observed in central West Africa (Logossa et al., 2011; Lompo et al., 2018). Within the Zambezian domain, significant pop-ulation genetic structure was detected for A. senegal, but not for A.
digitata.
Afzelia (Fabaceae, Detarioideae) is a paleotropical genus
repre-sented by seven species in Africa, including two savannah and four
FIGURE 1. Distribution map of Afzelia africana (triangles) and A. quanzensis (stars) samples analyzed and their location in African biogeographic
rainforest species, as well as one putative species that is currently poorly characterized (Brummit et al., 2007). The genus also in-cludes four species in Southeast Asia (Donkpegan et al., 2014). The two African savannah species are widely distributed in sub-Saha-ran Africa and occur in allopatry (Donkpegan et al., 2014): Afzelia
africana Sm. ex Pers occurs in the Sudanian region (from Senegal
to Sudan; Aubréville, 1968; Geerling, 1982) and Afzelia quanzensis Welw. in the Zambezian region (from southern Somalia to northern South Africa). The two savannah species are diploid, as opposed to the rainforest species, which are tetraploid (Donkpegan et al., 2015). In a recent phylogenetic study of African species of Afzelia, the genus was estimated to have emerged in open habitats (woodland and savannah) during the early to mid-Miocene (ca 20 to 14.5 Ma), whereas A. quanzensis and A. africana originated during the mid or late Miocene (ca 14.5 Ma to 8 Ma, Donkpegan et al., 2017). African
Afzelia species are intensively logged for their timber (Donkpegan
et al., 2014). Population genetic structure and evolutionary pro-cesses within the savannah species have not been investigated at a large geographic scale, despite the fact that genetic information may be useful for the development of sustainable management strate-gies for conservation and timber production (Lowe and Allendorf, 2010). Nuclear simple sequence repeat (SSR, also called microsat-ellites) markers revealed low genetic diversity in populations of
A. quanzensis at a small spatial scale (Jinga et al., 2016; Jinga and
Ashley, 2018).
The spatial genetic structure between individuals or populations can inform on the evolutionary processes operating in a species and can thus be of interest for conservation management. When seed and pollen dispersal are limited, which is nearly always the case at the scale of the whole distribution range of widespread plant spe-cies, isolation by distance is expected to result in a near linear decay of the kinship coefficient between individuals with the logarithm of the distance, and the kinship–distance curve tends to asymptote to slightly negative values at large distances (Hardy and Vekemans, 1999; Vekemans and Hardy, 2004). However, if the range of a species had been fragmented for a long period of time before differentiated populations re-expanded and formed secondary contact zones with spatial genetic discontinuities, the kinship–distance curve tends to reach very negative values at large distances, and genetic cluster-ing algorithms can detect parapatric genetic groups correspondcluster-ing to the previously isolated populations. Such genetic discontinuities have often been reported in African rainforest trees (e.g., Hardy et al., 2013; Demenou et al., 2018).
Population genetics studies in tropical trees have mostly used SSRs. Recent technological advances in high-throughput sequenc-ing allow sequencsequenc-ing of large portions of the genome in non-model species at a reasonable cost, thus offering increased resolution for the characterization of population genetic patterns and the infer-ence of evolutionary processes (Ekblom and Galindo, 2011). In this study, we used nuclear SSRs (Donkpegan et al., 2015) and single nucleotide polymorphisms (SNPs) derived from genotyping by se-quencing (GBS) to investigate the population genomic processes in the two savannah species of Afzelia across their distribution ranges. This study addresses the following questions: (1) Does the genetic variation at large scale reveal a legacy of past range fragmentation? That is, are there discrete genetic clusters that cover distinct geo-graphic regions with relatively sharp boundaries between them; and/or is there a gradual pattern of genetic change as expected un-der isolation by distance within each species? (2) Do species show contrasting levels of genetic diversity and effective population size
or signatures of demographic change compatible with past bottle-necks and/or population expansion? Our main objectives were to (1) estimate the genetic diversity and population genetic structure of A. africana and A. quanzensis using nuclear SSRs and SNPs, (2) characterize the relatedness pattern between individuals in each species to test for isolation by distance, and (3) understand the or-igin of these patterns using methods for demographic inference. Based on SNP data on widespread savannah species, this paper is one of the first population genomic studies of tropical African woodland trees.
MATERIALS AND METHODS
Study species
Afzelia africana (Fabaceae, Detarioideae) occurs in the Sudanian
region in dry savannahs and in dry forests (Aubréville, 1959; Ahouangonou et al., 1995; Gerard and Louppe, 2011). It can also occur in semi-deciduous forests, but at very low densities (Satabié, 1994). It has a wide ecological amplitude, but it prefers areas with >900 mm annual rainfall and grows at elevations up to 1400 m a.s.l. and can reach 20 m in height (Fig. 2A). The fruiting period lasts 6–8 months, and fruits may persist on trees for the following 6 months (Bationo et al., 2001; Ouédraogo-Koné et al., 2008). Afzelia
quanzensis occurs in the savannahs of the Zambezian region, from
Somalia to Angola and the north of South Africa. It has been re-ported in semi-deciduous coastal forests in Kenya (Brummitt et al., 2007) and also in dry forests, usually in deep sandy soils and also on rocky ridges (Jacana, 1997). The species is drought resistant but frost sensitive. It is a deciduous, medium to large-sized tree, 12– 15 m high (reaching 35 m under ideal conditions, Coates-Palgrave, 2002). Afzelia species are hermaphrodite and pollinated by insects (e.g., bees, Kato et al., 2008; Ariwaodo and Harry-Asobara, 2015). They have large dehiscent woody pods containing characteris-tic black seeds with red arils (Fig. 2E; Jacana, 1997; Gerhardt and Todd, 2009). Squirrels predate the seeds, while monkeys, rodents (Proechimys spp.), and birds (mainly hornbills) act as dispersers (Van Wyk and Van Wyk, 1997; Gathua, 2000; Bationo et al., 2001; Gerard and Louppe, 2011).
Sampling and DNA extraction
Plant tissue samples were collected directly in the field or in herbaria (National Herbarium of the Netherlands (herbarium code WAG of the Index Herbariorum), the Botanical Garden of Meise (BR) and Université Libre de Bruxelles (BRLU) in Belgium), and geographic coordinates of individual sampling locations were recorded. Our sampling is representative of the known distribution ranges of the two species (Fig. 1), in the Sudanian and Congolian biogeo-graphic regions for A. africana and in the Somalian, Zambezian, and South African regions for A. quanzensis. We sampled 241 A.
africana individuals from 41 West and Central African locations
and 113 A. quanzensis individuals from 24 East African locations (Appendices S1 and S2). Recently collected cambium or leaves were silica-dried in the field to reduce DNA fragmentation. Total DNA was extracted using the NucleoSpin plant kit (Macherey-Nagel, Düren, Germany) or the DNeasy 96 Plant Kit (Qiagen, GMbH, Münster, Germany) for the recently collected material. For herbar-ium material, a CTAB protocol was used (Doyle and Doyle, 1987).
Genotyping of SSRs and SNPs
Six microsatellite markers isolated from A. bipindensis were ampli-fied in two PCR multiplexes in all samples according to a previously published protocol (Donkpegan et al., 2015). Amplified fragments were separated on an ABI 3730 sequencer (Applied Biosystems, Lennik, Netherlands) and sized using the Genemapper software in comparison with the Radian Dye size standard (Eurogentec, Seraing, Liège, Belgium).
Sixty-nine GBS libraries were built and sequenced from n = 39 individuals of A. africana at the Institute for Genomic Diversity and Computational Biology Service Unit at Cornell University (Ithaca, NY, USA) according to a published protocol (Elshire et al., 2011). As required by the GBS protocol, only recently collected material (i.e., with nonfragmented DNA) was used. For each library, two DNA extractions were performed using the DNeasy Plant Minikit col-umns 377 (Qiagen), and pooled to generate sufficient DNA for the GBS protocol. To select the best enzyme for the GBS protocol for
Afzelia species, we used 1 μg of DNA of Afzelia bipindensis to build
test libraries using three enzymes: ApeKI (4.5-base cutter), EcoT22I and PstI (both 6-base cutters). Libraries were checked for appropri-ate fragment sizes (<500 bp) and distribution on an Experion auto-matic electrophoresis system (Bio-Rad, Laboratories, Hercules, CA,
USA). The enzyme EcoT22I, which produced appropriate fragment sizes (<500 bp), was selected. To limit the risk of uneven coverage across loci and samples when applying GBS data to organisms with large genome sizes, we built and sequenced two independent librar-ies per individual whenever possible. Before library construction, DNA extracts were purified using a ZR-96 DNA Clean up kit (Zymo Research, Orange, CA, USA), DNA quality was checked on a 1.5% agarose gel, and DNA was quantified with Qbit HS (Invitrogen, Carlsbad, CA, USA). The 69 GBS libraries were sequenced on ¾ of an Illumina lane (HiSeq2000 San Diego, CA, USA) using 100-bp Single Read chemistry.
We used Sabre (https://github.com/najos hi/sabre) to demulti-plex barcoded reads. After demultidemulti-plexing, sequence quality was evaluated with FastQC version 0.11.15 (Andrews, 2010). Low-quality bases and adapter contamination were removed with Trimmomatic version 0.33 (Bolger et al., 2014) with the follow-ing options: ILLUMINACLIP 2:30:10, LEADING 3, TRAILING 3, SLIDINGWINDOW 4:15, MINLEN 36.
First, a de novo assembly of A. africana GBS reads was car-ried out, including sequence reads of very closely related species of Afzelia: A. quanzensis, A. bella, A. pachyloba, and A.
bipinden-sis using PyRAD v.3.0.2 software (Eaton and Ree, 2013) to
pro-duce a catalogue of GBS loci (3749 contigs, approximate length
FIGURE 2. Morphology of Afzelia africana. (A) Tree from a Sudanian savannah in northern Benin. (B) Detail of tree trunk. (C) Compound leaves. (D)
of 100 bp per contig). This genus-wide catalogue is expected to contain loci that are shared between these closely related Afzelia species (Donkpegan et al., 2017) as well as species-specific loci. This catalogue was used as a reference for mapping the reads of all A. africana individuals using BWA 0.7.5a-r405 (Li and Durbin, 2009). The resulting alignments were converted to BAM format and reads were realigned around indels using SAMtools 0.1.17 (Li et al., 2009). The resulting BAM files were used as input for HaplotypeCaller algorithm of Genome Analysis Toolkit (GATK) v3.7 with standard parameters to detect polymorphisms in each sample into a VCF format including SNPs and indels (DePristo et al., 2011). VCFtools (http://vcfto ols.sourc eforge.net/) was used to remove indel variation and retain only biallelic variants (SNPs) that have a maximum of 40% missing data. Eventually, we suc-cessfully sequenced 39 individuals of A. africana and 12 of A.
quanzensis but discarded the latter from final data analyses due to
insufficient sample size. Data analysis
Population genetic parameters at geographic population level—
To characterize the diversity within each species at SSRs, we com-puted the allelic richness (Na), the effective number of alleles (Ne) following Nielsen et al. (2003), the observed heterozygosity (HO), the expected heterozygosity (HE), the inbreeding coefficient (F) and the genetic differentiation based on allele identity with the statistic
FST using SPAGeDi 1.5a (Hardy and Vekemans, 2002). Permutation tests were used to test whether F or FST deviated from expectations of panmixia in SPAGeDi 1.5a. For these analyses, we considered for both species, only populations sampled for a minimum of five individuals (Table 1). Null allele frequencies were estimated with INEST 1.0 (Chybicki and Burczyk, 2009), which also provided a corrected estimation of the inbreeding coefficient F. The selfing rate (S) was estimated in local populations with the largest sample sizes (samples ≥ 25 individuals; Table 1), based on the standard-ized identity disequilibrium assuming a mixed mating model (i.e., a proportion s of selfing and 1 − s of random outcrossing) with
standard error (SE) estimated by jackknifing over loci (David et al., 2007; Hardy, 2015).
To characterize genomic diversity for A. africana from the GBS data, we computed nucleotide diversity, π, corresponding to the av-erage number of nucleotide differences per SNP site between pairs of sequences (Nei, 1987), using DnaSP v. 5.10.01 software (Librado and Rozas, 2009).
Population genetic structure—For SSR data, we used the Bayesian
clustering method implemented in structure 2.3.1 (Falush et al., 2003) to detect genetic discontinuities within A. africana and A.
quanzensis separately. We ran structure 10 times for each
num-ber K of genetic clusters, which ranged from K = 1 to 5. We ran 1,000,000 iterations after a burn-in period of 100,000 iterations, using the admixture model with independent allele frequencies between clusters, without considering the population of origin of each individual. We estimated ln P(K) and ΔK using the Evanno et al. (2005) method implemented in STRUCTURE HARVESTER (Earl and vonHoldt, 2012) to obtain the most likely value of K. We also used an alternative genetic clustering method implemented in the R package tess3r (Caye et al., 2016), which takes into account spatial information (the sampling location of each individual) to derive individual ancestry estimates. The default values of the pro-gram were used and each run (K = 1–5) was replicated 10 times. The optimal value of K was defined by the minimum of the cross-en-tropy criterion.
For GBS-derived SNP data in A. africana, we performed genetic clustering analysis using the sparse non-negative matrix factoriza-tion (sNMF) software, implemented in the R package LEA (Frichot et al., 2014). We also computed a genetic covariance matrix to per-form a principal component analysis (PCA) using SMARTPCA (Patterson et al., 2006; Price et al., 2006) implemented in the SNPRelate package (Zheng et al., 2012).
Isolation by distance—Under Wright’s isolation by distance (IBD)
model, the kinship coefficient between individuals and/or pop-ulations is expected to decay linearly with the logarithm of their
TABLE 1. Genetic diversity parameters and selfing rate estimates in populations of two Afzelia species from African savannahs genotyped at six microsatellite loci.
Number of genotyped trees (N), number of alleles per locus (Na), effective number of alleles (Ne), expected (HE) and observed (HO) heterozygosity, inbreeding coefficient estimated from heterozygote deficit (F = 1 − HO/HE), inbreeding coefficient estimated while accounting for null alleles following the method implemented in INEST (Fnull). *p < 0.05 indicates significant deviation from HWE. NC indicates that no estimation was computed by INEST.
Species Country Population Longitude Latitude N Na Ne HE HO F Fnull Selfing (S)
A africana Benin BassilaS 1.56 9.26 7 3.00 2.53 0.459 0.595 –0.327* 0
Benin BassilaN1 2.43 8.92 9 4.83 4.71 0.588 0.556 0.059 0 Benin BassilaN2 2.32 8.90 11 4.33 4.28 0.516 0.470 0.094 0 Benin BassilaN3 2.27 8.82 5 3.67 3.81 0.594 0.558 0.067 0 Benin Lama 2.13 6.97 34 5.00 2.45 0.497 0.434 0.129 0 0.33 ± 0.16 Benin Natitingou 1.38 10.27 9 4.50 3.78 0.561 0.444 0.218* 0 Benin ParcW1 2.99 11.50 18 5.17 3.69 0.589 0.574 0.026 0 Benin ParcW2 3.05 11.47 6 3.17 3.17 0.483 0.528 –0.105 0 Benin Pendjari 1.53 10.94 25 7.17 4.35 0.641 0.693 –0.083 0 0 Benin Penessoulou1 1.52 9.27 32 5.67 3.30 0.483 0.458 0.052 0 0 ± 0.1 Benin Penessoulou2 1.65 8.99 8 3.00 2.65 0.442 0.479 –0.092 0 Togo Notse 1.29 6.95 12 4.17 2.99 0.525 0.528 –0.005 0 Cameroon Ngambetica 11.63 5.58 7 3.83 3.08 0.566 0.500 0.125 0 Cameroon Yoko 12.20 5.40 7 3.33 2.47 0.500 0.524 –0.052 0
A quanzensis Kenya Gede –3.30 39.98 31 5.50 3.45 0.473 0.409 0.139* 0 0 ± 0.07
Kenya Witu –2.38 40.47 48 6.00 3.23 0.521 0.411 0.212* 0 0 ± 0
geographic distance on a two-dimensional scale and to reach slightly negative values at large distances (Hardy and Vekemans, 1999). To detect IBD within each species at large scales for SSR and SNP data (only for A. africana), we calculated the kinship coefficient Fij be-tween individuals i and j using the estimator of Loiselle et al. (1995) implemented in SPAGeDi (Hardy and Vekemans, 2002). Positive and negative Fij values indicate whether individuals are more or
less related than the average of two sampled individuals. Pairwise
Fij values were regressed on the logarithm of pairwise geographic distance, ln dij), and IBD was tested by comparing the regression slope blog to its distribution obtained from 10,000 permutations of the spatial locations of individuals. To illustrate IBD patterns, Fij val-ues were averaged over a set of distance classes (d) according to a geometric progression of 11 boundaries (0–1, 1–2, 2–5, 5–10, 10–50, 50–100, 100–200, 200–500, 500–1000, 1000–2000, >2000 km) for A.
africana and seven (0–2, 2–5, 5–10, 10–300, 300–500, 500–1000,
>1000 km) for A. quanzensis, giving the kinship–distance curves
F(d). We used the Sp-statistic (Vekemans and Hardy, 2004) to
quan-tify the strength of the spatial genetic structure: Sp = −blog/(1 − F1), where F1 is the mean Fij between neighboring individuals [approxi-mated by F(d < 1–2 km) for the first distance class].
Demographic inference—Using SSR data, we assessed the
demo-graphic history of each species with the bottleneck statistic T2 im-plemented in BOTTLENECK 1.2.02 (Piry et al., 1999). This statistic represents an average across loci of the deviation of the actual gene diversity HE from the gene diversity expected from the number of alleles in the population assuming mutation–drift equilibrium in a population of constant size. If T2 > 0, the gene diversity excess indi-cates a loss of rare alleles possibly caused by recent founder events (bottlenecks), whereas population expansions almost always cause heterozygosity deficiency (T2 < 0; Cornuet and Luikart, 1996). The coalescent process was simulated using three mutation models: the infinite allele model (IAM), the stepwise mutation model (SMM), and the two-phase model mixing single-step and multi-steps mu-tations (TPM). The last two models are considered to be more ap-propriate for SSR data (Piry et al., 1999). Because a computational bug was recently reported in the algorithm implemented in the software BOTTLENECK and corrected in the software INEST 2.2 (Chybicki, 2017), we used INEST to analyze our SSR data sets. Ten thousands simulations were performed for each of the three mu-tation models, keeping default parameters for the TPM (Chybicki, 2017). Significant deviation from equilibrium gene diversity was de-termined using the Wilcoxon signed rank test based on 106
permu-tations (Chybicki, 2017), which is the most appropriate test when only few polymorphic loci are analyzed (Piry et al., 1999).
For the SNP data of A. africana, to test for departure from the standard neutral model (SNM), we computed the mean value of Tajima’s D (Tajima, 1989) over loci and compared it with the dis-tribution of mean values from coalescent simulations using DnaSP v.5.10.1 (Librado and Rozas, 2009). Tajima’s D statistic is a measure of the standardized difference between nucleotide diversity π and the Watterson estimator θ per site (Watterson, 1975). D is expected to be close to zero under the standard neutral model of popula-tion evolupopula-tion, e.g., under a constant size populapopula-tion. High values of Tajima’s D suggest an excess of common variants, which is consis-tent with balancing selection at the locus level, or with population contraction when detected at the genome level. Negative values of Tajima’s D, on the other hand, indicate an excess of rare variation, which is consistent with population growth when detected at the
genome level, or with positive selection at the locus level (Tajima, 1989).
RESULTS
SSR-based genetic diversity and selfing rate
A total of 67 alleles were detected over all six loci for A. africana, and the mean number of alleles per locus was 11.17 and ranged from four to 26 alleles. Observed and expected heterozygosity es-timates per population ranged from HO = 0.43 to 0.69 and from
HE = 0.44 to 0.64, respectively (Table 1). For A. quanzensis, a total of 42 alleles was detected over all six loci, and the mean number of alleles per locus was 7.0 and ranged from 2 to 23 alleles. HO ranged from 0.28 to 0.41, and HE ranged from 0.46 to 0.52. Inbreeding coef-ficients were not significantly different from zero in all populations (F = 0) after correcting for null alleles using INEST (Appendix S3). The estimated selfing rates S for three major populations of A.
afri-cana (Lama, Penessoulou1 and Pendjari) and two of A. quanzensis
(Gede and Witu) were close to zero (Table 1), except for the Lama population (33%). F statistics revealed very low but statistically significant differentiation among populations, with weaker genetic structure in A. africana, FST = 0.045 (P < 0.01), than in A.
quanzen-sis, FST = 0.078 (P < 0.01). GBS-based SNP data
After the filtering to retain only biallellic SNPs, we obtained a pre-liminary VCF file with 8541 SNPs using the GBS catalogue produced for the genus Afzelia. This file was then filtered to retain polymor-phic SNPs and to remove SNPs and individuals with ≥60% miss-ing data. After applymiss-ing all filters, we removed nine individuals of
A. africana and obtained a VCF file containing 2800 polymorphic
SNPs and 30 individuals (Appendix S4). The final set of A. africana genotypes had an average missing data rate of 13.64% per sample with a mean sequencing depth of 40×. Total nucleotide diversity was π = 0.00420 and θ = 0.01124 in A. africana.
Population genetic structure
The structure analyses of SSR data failed to detect population ge-netic structure at the intraspecific level. For both species, K = 1 re-ceived the strongest support (Appendix S5). Runs assuming K = 2 to
K = 5 revealed admixed ancestry of individuals with similar
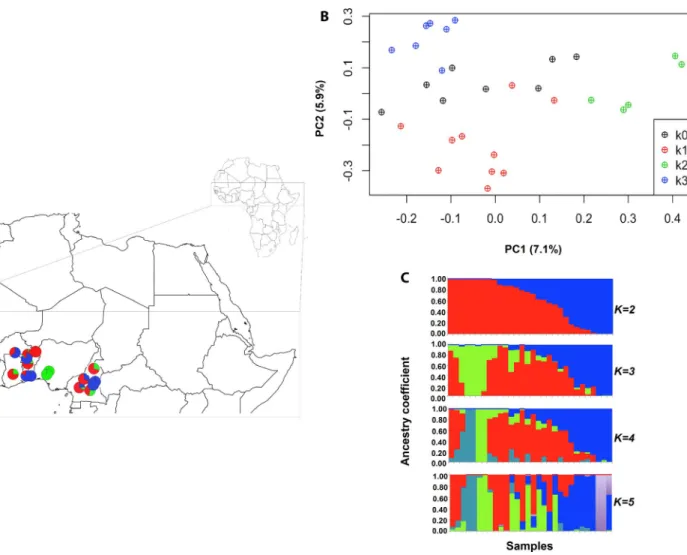
contri-butions of genetic clusters. The inclusion of geographic prior infor-mation using tess3r showed similar results, although A. quanzensis displayed somewhat uneven contributions of genetic clusters sug-gesting weak population substructure (Appendix S6). Conversely, SNP data in A. africana showed some evidence of genetic structure, but no clear geographic pattern was revealed. The number of ge-netic clusters that best described the data was K = 3, based on the criterion of minimum cross entropy (Fig. 3, Appendix S7). Two ge-netic clusters were widespread across West Africa, without any geo-graphic pattern, and many individuals were admixed between these gene pools. The third gene pool was centred on Nigeria. The PCA showed low levels of genetic differentiation (variance explained by PC1 and PC2 was 7.10% and 5.90%, respectively) and highlighted the divergence of the Nigeria cluster represented by green circles in Fig. 3.
Patterns of isolation by distance (IBD)
Pairwise kinship between individuals declined fairly linearly with the logarithm of the geographic distance for both types of mark-ers, although the trend was more stochastic for A. quanzensis due to limited sample size and SSR polymorphism (Fig. 4). In both species, the kinship–distance curves started around 0.05 for the first distance class (ca. 1 km), reaching slightly negative values at large distances (ca. −0.01 to −0.02 at >500 km), a pattern expected under isolation by distance. Permutation tests indicate that all regression slopes bLd were statistically significant (P < 0.001) and led to relatively weak Sp values: in A. africana Sp = 0.0056 (SE = 0.0021) for SSRs and 0.0054 (SE = 0.0004) for SNPs and in
A. quanzensis Sp = 0.0075 (SE = 0.0019) for SSRs. Hence, similar
patterns of IBD were detected for both types of markers and in both species.
Demographic inference in each species
With SSRs, both species showed negative values of the Bottleneck statistic T2 (called combined Z score in INEST output), which
is indicative of past population expansion (Table 2). Wilcoxon signed-rank tests indicate significant deficit of heterozygosity compared to mutation–drift equilibrium expectations under the
FIGURE 3. Genetic structure of A. africana using GBS-based SNPs (N = 30 A. africana with 2800 SNPs. (A) Geographic origin of samples and population
genetic structure of A. africana at K = 3 (western Africa), where pie charts represent individual ancestry proportions in the assumed populations, as estimated using sNMF. (B) PCA ordinations along the first two PCA axes of A. africana, where symbols distinguish sNMF clusters (k0 represent samples not assigned to a cluster at q > 0.7). (C) Histograms of individual ancestry proportions for each species, as estimated using sNMF for K = 2 to K = 5 assumed ancestral populations.
FIGURE 4. Spatial genetic structures (kinship–distance curves) of
Afzelia africana (square) and A. quanzensis (triangle) based on SSRs
SSM model, significant and marginally significant deficit under the TPM model for A. africana and A. quanzensis, respectively, and nonsignificant deficit under the IAM model (Table 2). Hence, these results indicate the absence of a recent bottleneck at the species level for both species and rather support past popula-tion expansion, given that TPM and SSM are more realistic mu-tation models for SSRs. For GBS data in A. africana, Tajima’s
D = −2.02 (P < 0.05) when computed using the whole data set,
and estimates remained negative or very close to 0 when com-puted at the scale of inferred clusters (Table 2). These results tend to support again a signature of population expansion in A.
africana.
DISCUSSION
Large-scale population structure
Our kinship analyses reveal a pattern of isolation by distance in the two savannah representatives of the genus Afzelia in Africa, i.e., the kinship between individuals decreased with the logarithm of the spatial distance and reached slightly negative values at large distances (Fig. 4). Both SSRs (A. africana and A. quanzensis) and SNPs (A. africana) gave very similar IBD patterns despite large differences in the number of loci and sampling strategies, as found in previous studies comparing both of these markers (Yang et al., 2011). The IBD observed is probably caused by limited pollen and seed dispersal, although dispersal vectors are not well known in
Afzelia. Limited seed dispersal would be expected given that the
seeds of Afzelia are heavy and that small rodents act as dispersers (Cricetomys emini, Epixerus wilsoni, Protoxerus stangeri; Bationo et al., 2001; Evrard, 2015). However, long-distance seed dispersers such as monkeys (Cercopithecus albogularis) and birds (mainly hornbills) also have been reported (Van Wyk and Van Wyk, 1997; Gathua, 2000). The pollination mechanism is less studied. Large
Xylocopa bees pollinate Asian Afzelia (Kato et al., 2008), and large
African bees such as Apis mellifera scutellata are able to transfer pollen up to 3.2 km (Dick et al., 2008).
While the SSR-base structure analyses did not retrieve distinct genetic clusters across the natural ranges of A. africana in the Sudanian savannah and A. quanzensis in the Zambezian
savannah, SNP data revealed genetic groups within A. africana. However, the genetic clusters identified by SNPs exhibited high levels of admixture and did not correspond to any clearly de-limited geographic entities. This structure very likely reflects solely the trend of IBD rather than a history of past popula-tion fragmentapopula-tion. The incorrect detecpopula-tion of boundaries with structure-like methods has been previously reported in em-piric and simulated datasets with IBD patterns (Frantz et al., 2009; Safner et al., 2011). The higher discriminating power of SNPs over SSRs for detecting genetic clusters has also been re-ported previously (e.g., Liu et al., 2005; Fischer et al., 2017). If the species’ ranges had been fragmented long enough to generate well-differentiated populations, we should have observed genetic clusters distributed in parapatry and relatively high FST estimates between populations, contrary to our observations. As a caveat, it is questionable whether the low number of SSR loci used in this study (six) was not too limited to detect such parapatric ge-netic clusters. However, this is not supported by studies of other African trees: five SSR loci were sufficient to recover four ge-netic clusters in Symphonia globulifera (Budde et al., 2013), and seven SSR loci detected six genetic clusters in Milicia excelsa, where the same clusters were retrieved using SNP data (Dainou et al., 2016). In addition, our six SSR loci were sufficient to char-acterize IBD patterns in our Afzelia species and showed perfect congruence with the IBD pattern derived from our GBS data in
A. africana. Hence, the IBD and population genetic analyses
in-dicate that gene flow has been restricted, but populations have remained connected throughout the large, continuous Sudanian and Zambezian savannahs.
Different mutation models were considered to infer the demo-graphic history of each species. SSR and SNP data were again con-gruent in detecting signatures of historical population expansion, at least if stepwise mutations predominate for SSR. However, our data were not powerful enough to identify whether these signatures reflect range expansions (and from which source) or only a demo-graphic expansion without change of distribution range. In any case, populations of both savannah species apparently did not ex-perience major disturbances leading to their fragmentation and/or demographic decline in the latest hundreds to thousands of genera-tions, as has been suggested for some other savannah species (Bryja et al., 2010; Odee et al., 2012; Sexton et al., 2015).
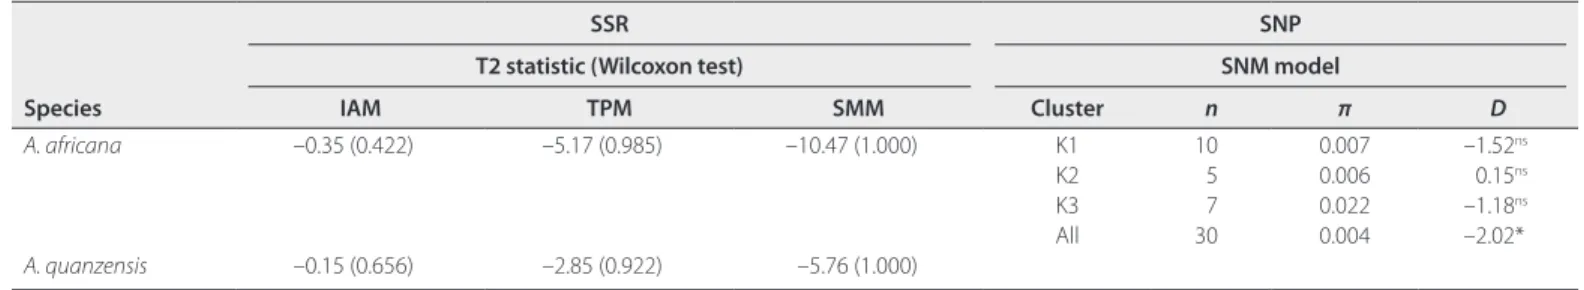
TABLE 2. Genetic signatures of demographic changes in Afzelia species according to SSR and SNP data sets. For SSR data sets, T2 measures the trend of
heterozygosity excess given the number of alleles at drift–mutation equilibrium, under different mutation models: IAM, infinite allele model; TPM, two-phase model; SMM, stepwise mutation model. Estimates were computed by the software INEST2.2 (where it is called combined Z score), which corrects a computational bug in the software BOTTLENECK. Values under parentheses report the relative ranking of Wilcoxon signed-rank test statistic against 106 permutations (values approaching 0 indicate a bottleneck; values approaching 1 indicate population expansion). For the SNP data set, Tajima’s D is reported for each cluster K1 to K3 defined for A. africana (see Fig. 3) and using all samples. Under the standard neutral model (SNM), positive and negative values are indicative of bottleneck and population expansion, respectively; n, number of individuals; π, nucleotide diversity; ns: not significant; *P < 0.05.
Species
SSR SNP
T2 statistic (Wilcoxon test) SNM model
IAM TPM SMM Cluster n π D A. africana –0.35 (0.422) –5.17 (0.985) –10.47 (1.000) K1 10 0.007 –1.52ns K2 5 0.006 0.15ns K3 7 0.022 –1.18ns All 30 0.004 –2.02* A. quanzensis –0.15 (0.656) –2.85 (0.922) –5.76 (1.000)
Comparison with other tropical trees in Africa
The absence of clear-cut genetic discontinuities over large distances for A. africana and A. quanzensis is consistent with results reported in the savannah tree species Adansonia digitata and Khaya
senega-lensis, which showed no geographic discontinuities of the genetic
variation (Tsy et al., 2009; Sexton et al., 2015). Acacia senegal displays strong differentiation between Sudanian and Zambezian popula-tions, but low diversity and structure at a nuclear ribosomal marker across the Sudanian savannahs suggest a recent range expansion (Odee et al., 2012, but see Lyam et al., 2018). These results suggest that the African savannahs have not experienced major upheavals that led to their fragmentation (Salzmann et al., 2002; Vincens et al., 2006; Watrin et al., 2009), in contrast to the major fluctuations of the rainforest cover over time (Maley, 1996). Nevertheless, Vitellaria
paradoxa (Allal et al., 2011; Logossa et al., 2011) and Parkia biglo-bosa (Lompo et al., 2018) show clear genetic discontinuities in the
Sudanian region (but include genetically homogenous clusters ex-tending over large distances in central west Africa). Whether their genetic structures have been influenced by human activities remains an open question because these species of high socioeconomic im-portance in agroforestry systems produce seeds that are marketed and widely used for human consumption.
In the last few years, population genetic data have accumulated for a number of African rainforest trees and revealed well-differen-tiated parapatric genetic clusters in Central and West African rain-forests for most species (e.g., Budde et al., 2013; Hardy et al., 2013; Daïnou et al., 2014, 2016; Heuertz et al., 2014; Piñeiro et al., 2017; Demenou et al., 2018; Migliore et al., 2018). In general, this genetic structuring cannot be explained by current geographic barriers such as the main mountain chains (Cameroonian Volcanic Line, Cristal Mountains, and Chaillu massif) or major rivers in the region (Sanaga, Dja, and Oougué Rivers). Molecular dating suggests histor-ical isolation of the tree populations, probably led by rainforest frag-mentation, during the cold, dry Ice-Age periods of the Pleistocene (<2.58 million years ago; Piñeiro et al., 2017; Demenou et al., 2018), but possibly even earlier (Migliore et al., 2018). These results con-trast with the genetic connectivity found for the Afzelia and other savannah tree species over large Sudanian and Zambezian ranges. Local-scale genetic diversity with SSRs
Inbreeding and selfing rates remain very low in adult populations of A. africana and A. quanzensis. Genetic diversity parameters for SSRs markers showed a large range of local genetic diversity in our study (A. africana: HE = 0.46–0.66 and A. quanzensis: HE = 0.40– 0.66) and in other population-level studies of A. quanzensis from Zimbabwe (HE = 0.41–0.51; Jinga and Ashley, 2018), A. africana from Benin (HE = 0.09–0.88; Houehanou et al., 2019), and the Asian congener A. xylocarpa (HE = 0.47–0.66; Pakkad et al., 2014). Comparable genetic diversity ranges have been documented for African savannah tree species Khaya senegalensis (HE = 0.44–0.71; Sexton et al., 2015), Vitellaria paradoxa (HE = 0.42–0.62; Allal et al., 2011), Acacia senegal (HE = 0.63–0.70; Omondi et al., 2010) and Parkia biglobosa (HE = 0.61–0.82; Lompo et al., 2018). Much lower levels were documented for Adansonia digitata (HE = 0.27– 0.35; Kyndt et al., 2009). Despite the apparently stronger influ-ence of past climate changes on forest fragmentation, rainforest tree species do not display lower population genetic diversity than savannah trees: Aucoumea klaineana (HE = 0.38–0.55; Born
et al., 2008), Milicia excelsa (HE = 0.53–0.56; Bizoux et al., 2009),
Baillonella toxisperma (HE = 0.56–0.58; Ndiade-Bourobou et al., 2010), Distemonanthus benthamianus (HE = 0.47–0.58; Debout et al., 2011), Greenwayodendron suaveolens (HE =0.7-0.8; Piñeiro et al., 2017), Scorodophloeus zenkeri (HE =0.50-0.60; Piñeiro et al., 2017), and Terminalia superba (HE = 0.51–0.81; Demenou et al., 2018). Hence, although African savannah trees seem to have been less prone than African rainforest trees to past range fragmentation, they have not necessarily maintained larger effective population sizes.
CONCLUSIONS
The SSR and SNP-based data analyses of the two Afzelia species from the African savannahs show isolation by distance patterns but no strong geographic barriers to genetic connectivity across their Sudanian and Zambezian ranges. Overall, these results indicate that pollen and seed dispersal has been restricted, but populations have remained connected throughout the large, continuous African savannahs. Our findings contrast with the stronger differentiation of tree populations usually reported in the better-studied Guineo-Congolian rainforests, probably driven by rainforest fragmentation during the Pleistocene. In our study, both markers provided over-all congruent signals, although the larger SNP data set had higher power than SSRs to detect subtle population genetic structure, but which did not reflect a history of population fragmentation. Demographic analyses with both SNP and SSR data suggest histor-ical demographic expansion, especially for A. africana. The reduced genetic drift accompanying historical population expansion may have allowed these species to accumulate novel genetic diversity, which represents a valuable resource for population adaptive po-tential (Hoffmann et al., 2017). Conversely, we should keep in mind that the historical population expansion does not reflect the current threats to these species listed as vulnerable by the IUCN: anthropo-genic threats operate at the scale of just one to a few generations. To obtain insights into how these threats affect the adaptive potential of the species in order to design pertinent conservation and man-agement plans, we need to monitor allelic richness and inbreeding effects in populations across generations.
ACKNOWLEDGMENTS
This work received financial support from the Fonds pour la Formation à la Recherche dans l’Industrie et l’Agriculture (FRIA-FNRS, Belgium) through a research grant to A.D., from the Marie Curie FP7-PEOPLE-2012-IEF program (project AGORA) awarded to R.P., from the Fonds de la Recherche Scientifique (F.R.S.-FNRS) through project J.0292.17F, the Belgian Science Policy (project AFRIFORD) and the CGIAR Research Program on Forests, Trees and Agroforestry. This work has benefited from support of a grant from Investissement d’Avenir grants of the ANR (CEBA: ANR-10-LABX-25-01). A.D. acknowledges a Labex COTE Mobility grant to INRA. The authors are grateful to Nils Bourland who helped us during field expeditions, through proj-ect PD 620/11 Rev.1 (M), “Development and implementation of species identification and timber tracking in Africa with DNA fingerprints and stable isotopes” by the International Tropical Timber Organization (ITTO). We also thank the Botanic Garden
of Meise (BR-Herbarium, Belgium), ULB (BRLU-Herbarium), and Naturalis (WAG-Herbarium, Netherlands) for material from their herbarium collections; and Esra Kaymak and Tom Gilbert for as-sistance in generating GBS data. Finally, comments from an associ-ate editor and two anonymous reviewers improved the manuscript.
AUTHOR CONTRIBUTIONS
A.S.L.D., J.-L.D. and O.J.H. conceived the study. A.S.L.D. collected the data and performed the analyses. R.P. generated the GBS data sequencing. A.S.L.D., R.P., M.H., J.D., K.D., J.-L.D., and O.J.H. inter-preted the results and contributed to drafting and writing the article.
DATA AVAILABILITY
SSRs Datafiles and GBS sequence data are respectively available from the Dryad data repository https://doi.org/10.5061/dryad. 5hqbz kh25 and the NCBI Sequence Read Archive BioProject PRJNA579094.
SUPPORTING INFORMATION
Additional Supporting Information may be found online in the supporting information tab for this article.
APPENDIX S1. Herbarium material used for the nuclear
microsat-ellite (SSR) analyses of Afzelia savannah species.
APPENDIX S2. Population source of fresh plant tissue samples
used for the SSRs analyses of Afzelia savannah species.
APPENDIX S3. Estimated proportion of null alleles per SSR locus
in Afzelia species according to INEST software.
APPENDIX S4. Sample origins of plant tissue samples used for the
GBS analyses of A. africana.
APPENDIX S5. Mean log-likelihood for each number of genetic
clusters (K) obtained from the use of structure software on the SSR data of Afzelia.
APPENDIX S6. Genetic structure of African diploid Afzelia
spe-cies using SSRs (N = 241 A. africana; N = 113 A. quanzensis) and tess3r software.
APPENDIX S7. The number of K (1–10) ancestry components best
explaining the genetic structure of A. africana assessed using the cross-entropy criterion obtained from the sNMF program on SNP data.
LITERATURE CITED
Ahouangonou, S., and B. Bris. 1995. Afzelia africana Sm. Flamboyant 42: 7–10. Allal, F., H. Sanou, L. Millet, A. Vaillant, L. Camus-Kulandaivelu, Z. A. Logossa, F.
Lefevre, and J.-M. Bouvet. 2011. Past climate changes explain the phylogeog-raphy of Vitellaria paradoxa over Africa. Heredity 107: 174–186.
Andrews, S. 2010. FastQC: a quality control tool for high throughput sequence data. Website: http://www.bioin forma tics.babra ham.ac.uk/proje cts/fastqc. Ariwaodo, J. O., and J. L. Harry-Asobara. 2015. Preliminary investigation on
flowering and fruiting pattern in a plantation grown Afzelia africana Sm stand in Umuahia, Nigeria. American Journal of Plant Sciences 6: 219–227.
Aubréville, A. 1959. La flore forestière de la Côte d’Ivoire, vol. I, revised 2nd ed. Publication no. 15. Centre Technique Forestier Tropical, Nogent-sur-Marne, France.
Aubréville, A. 1968. Légumineuses. Césalpinioidées. Flore du Gabon. vol. 15: 111–118, Museum National d’Histoire Naturelle, Paris, France.
Bationo, B. A., S. J. Ouédraogo, and S. Guinko. 2001. Longévité des graines et contraintes à la survie des plantules d’Afzelia africana Sm. ex Pers. dans une savane boisée du Burkina Faso. Annals of Forest Science 58: 69–75.
Bizoux, J. P., K. Daïnou, N. Bourland, O. J. Hardy, M. Heuertz, G. Mahy, J. L. Doucet, et al. 2009. Spatial genetic structure in Milicia excelsa (Moraceae) indicates extensive gene dispersal in a low-density wind-pollinated tropical tree. Molecular Ecology 18: 4398–4408.
Bolger, A. M., M. Lohse, and B. Usadel. 2014. Trimmomatic: a flexible trimmer for Illumina sequence data. Bioinformatics 30: 2114–2120.
Bonnefille, R. 2007. Rainforest responses to past climatic changes in tropi-cal Africa. In M. B. Bush, J. R. Flenley, and W. D. Gosling [eds.], Tropitropi-cal rainforest responses to climate change, 117–170. Praxis Publishing, Chichester, UK.
Born, C., O. J. Hardy, M. H. Chevallier, S. Ossari, C. Attéké, E. Jean Wickings, M. Hossaert-McKey, et al. 2008. Small scale spatial genetic structure in the cen-tral African rainforest tree species Aucoumea klaineana: a stepwise approach to infer the impact of limited gene dispersal, population history and habitat fragmentation. Molecular Ecology 17: 2041–2050.
Brummitt, R. K., A. C. Chikuni, J. M. Lock, and R. M. Polhill. 2007. Leguminosae, subfamily Caesalpinioideae. In J. R. Timberlake, G. V. Pope, R. M. Polhill, and E. S. Martins [eds.], Flora Zambesiaca, vol. 3, part 2, 1–228. Royal Botanic Gardens, Kew, UK.
Bryja, J., L. Granjon, G. Dobigny, H. Patzenhauerová, A. Konečný, J. M. Duplantier, P. Gauthier, et al. 2010. Plio-Pleistocene history of West African Sudanian sa-vanna and the phylogeography of the Praomys daltoni complex (Rodentia): the environment / geography / genetic interplay. Molecular Ecology 19: 4783–4799.
Budde, K. B., S. C. González-Martínez, O. J. Hardy, and M. Heuertz. 2013. The ancient tropical rainforest tree Symphonia globulifera L. f. (Clusiaceae) was not restricted to postulated Pleistocene refugia in Atlantic Equatorial Africa.
Heredity 111: 66–76.
Caye, K., T. M. Deist, H. Martins, O. Michel, and O. François. 2016. TESS3: fast inference of spatial population structure and genome scans for selection.
Molecular Ecology Resources 16: 540–548.
Chybicki, I. J. 2017. INEST 2.2 The user manual (last update 14/09/2017). Website: https://www.ukw.edu.pl/praco wnicy /stron a/igor_chybi cki/softw are_ ukw [accessed November 2019].
Chybicki, I. J., and J. Burczyk. 2009. Simultaneous estimation of null alleles and inbreeding coefficients. Journal of Heredity 100: 106–113.
Coates Palgrave, M., and K. Coates Palgrave. 2002. Trees of southern Africa, 3rd ed. Struik Publishers, Cape Town, South Africa.
Cornuet, J. M., and G. Luikart. 1996. Description and power analysis of two tests for detecting recent population bottlenecks from allele frequency data.
Genetics 144: 2001–2014.
Daïnou, K., G. Mahy, J. Duminil, C. W. Dick, J.-L. Doucet, A. S. L. Donkpegan, M. Pluijgers, et al. 2014. Speciation slowing down in widespread and long-living tree taxa: insights from the tropical timber tree genus Milicia (Moraceae).
Heredity 113: 74–85.
Daïnou, K., C. Blanc-Jolivet, B. Degen, P. Kimani, D. Ndiade-Bourobou, A. S. L. Donkpegan, F. Tosso, et al. 2016. Revealing hidden species diversity in closely related species using nuclear SNPs, SSRs and DNA sequences—a case study in the tree genus Milicia. BMC Evolutionary Biology 16: 259.
David, P., B. Pujol, F. Viard, V. Castella, and J. Goudet. 2007. Reliable selfing rate estimates from imperfect population genetic data. Molecular Ecology 16: 2474–2487.
Debout, G. D., J.-L. Doucet, and O. J. Hardy. 2011. Population history and gene dispersal inferred from spatial genetic structure of a Central African timber tree, Distemonanthus benthamianus (Caesalpinioideae). Heredity 106: 88–99. Demenou, B. B., J.-L. Doucet, and O. J. Hardy. 2018. History of the fragmenta-tion of the African rain forest in the Dahomey Gap: insight from the demo-graphic history of Terminalia superba. Heredity 120: 547–561.
Depristo, M. A., E. Banks, R. Poplin, K. V. Garimella, J. R. Maguire, C. Hartl, A. A. Philippakis, et al. 2011. A framework for variation discovery and genotyping using next-generation DNA sequencing data. Nature Genetics 43: 491–498.
Dick, C. W., O. J. Hardy, F. A. Jones, and R. J. Petit. 2008. Spatial scales of pol-len and seed-mediated gene flow in tropical rain forest trees. Tropical Plant
Biology 1: 20–33.
Donkpegan, A. S. L., O. J. Hardy, P. Lejeune, M. Oumorou, K. Daïnou, and J.-L. Doucet. 2014. Un complexe d’espèces d’Afzelia des forêts africaines d’in-térêt économique et écologique (synthèse bibliographique). Biotechnologie
Agronomie Société et Environnement 18: 233–246.
Donkpegan, A. S. L., J.-L. Doucet, K. Daïnou, and O. J. Hardy. 2015. Microsatellite development and flow cytometry in the African tree genus Afzelia (Fabaceae, Caesalpinioideae) reveal a polyploid complex. Applications in Plant Sciences 3: 1400097.
Donkpegan, A. S. L., J.-L. Doucet, J. Migliore, J. Duminil, K. Daïnou, P. Rosalia, J. Wieringa, et al. 2017. Evolution in African tropical trees displaying ploidy-habitat association: the genus Afzelia (Leguminosae). Molecular
Phylogenetic Evolution 107: 270–281.
Doyle, J. J., and J. L. Doyle. 1987. A rapid DNA isolation procedure for small quantities of fresh leaf tissue. Phytochemical Bulletin 19: 11–15.
Duminil, J., S. Mona, P. Mardulyn, C. Doumenge, F. Walmacq, J.-L. Doucet, and O. J. Hardy. 2015. Late Pleistocene molecular dating of past popula-tion fragmentapopula-tion and demographic changes in African rain forest tree species supports the forest refuge hypothesis. Journal of Biogeography 42: 1443–1454.
Earl, D. A., and B. M. Vonholdt. 2012. STRUCTURE HARVESTER: a website and program for visualizing STRUCTURE output and implementing the Evanno method. Conservation Genetics Resources 4: 359–361.
Eaton, D. A., and R. H. Ree. 2013. Inferring phylogeny and introgression using RADseq data: an example from flowering plants (Pedicularis: Orobanchaceae). Systematic Biology 62: 689–706.
Ekblom, R., and J. Galindo. 2011. Applications of next generation sequencing in molecular ecology of non-model organisms. Heredity 107: 1–15.
Elshire, R. J., J. C. Glaubitz, Q. Sun, J. A. Poland, K. Kawamoto, E. S. Buckler, and S. E. Mitchell. 2011. A robust, simple genotyping-by-sequencing (GBS) ap-proach for high diversity species. PLoS ONE 6: e19379.
Evanno, G., S. Regnaut, and J. Goudet. 2005. Detecting the number of clusters of individuals using the software structure: a simulation study. Molecular
Ecology 14: 2611–2620.
Evrard, Q. 2015. Ecologie de reproduction du doussié, Afzelia bipindensis Harms, en forêt dense humide tropicale gabonaise. Mémoire, Gembloux Agro-Bio Tech, University of Liège, Liège, Belgium.
Falush, D., M. Stephens, and J. K. Pritchard. 2003. Inference of population struc-ture using multilocus genotype data: linked loci and correlated allele fre-quencies. Genetics 164: 1567–1587.
Fischer, M. C., C. Rellstab, M. Leuzinger, M. Roumet, F. Gugerli, K. K. Shimizu, R. Holderegger, and A. Widmer. 2017. Estimating genomic diversity and popu-lation differentiation – an empirical comparison of microsatellite and SNP variation in Arabidopsis halleri. BMC Genomics 18: 69.
Frantz, A. C., S. Cellina, A. Krier, L. Schley, and T. Burke. 2009. Using spatial Bayesian methods to determine the genetic structure of a continuously distributed population: clusters or isolation by distance? Journal of Applied
Ecology 46: 493–505.
Frichot, E., F. Mathieu, T. Trouillon, G. Bouchard, and O. François. 2014. Fast and efficient estimation of individual ancestry coefficients. Genetics 196: 973–983.
Gathua, M. 2000. The effects of primates and squirrels on seed survival of a can-opy tree, Afzelia quanzensis, in Arabuko-Sokoke Forest, Kenya. Biotropica 32: 127–132.
Geerling, C. 1982. Guide de terrain des ligneux sahéliens et soudano-guinéens, 82–83. Meded. Landbouwhogesch, Wageningen, Netherlands.
Gérard, J., and D. Louppe. 2011. Afzelia africana Sm. ex Pers. In R. H. M. J. Lemmens, D. Louppe, and A. Oteng-Amoako [eds.], Record from PROTA4U. PROTA (Plant Resources of Tropical Africa), Wageningen, Netherlands. Website: http://www.prota 4u.org/search.asp.
Gerhardt, K., and C. Todd. 2009. Natural regeneration and population dynam-ics of the tree Afzelia quanzensis in woodlands in southern Africa. African
Journal of Ecology 47: 583–591.
Hardy, O. J. 2015. Population genetics of autopolyploids under a mixed mating model and the estimation of selfing rate. Molecular Ecology Resources 16: 103–117.
Hardy, O. J., and X. Vekemans. 1999. Isolation by distance in a continuous pop-ulation: reconciliation between spatial autocorrelation analysis and popula-tion genetics models. Heredity 83: 145–154.
Hardy, O. J., and X. Vekemans. 2002. Spagedi: a versatile computer program to analyse spatial genetic structure at the individual or population levels.
Molecular Ecology 2: 618–620.
Hardy, O. J., C. Born, K. Budde, K. Daïnou, G. Dauby, J. Duminil, E.-E. B. Ewédjé, et al. 2013. Comparative phylogeography of African rain forest trees: a review of genetic signatures of vegetation history in the Guineo-Congolian region.
Comptes Rendus Geoscience 345: 284–296.
Heuertz, M., J. Duminil, G. Dauby, V. Savolainen, and O. J. Hardy. 2014. Comparative phylogeography in rainforest trees from Lower Guinea, Africa.
PLOS One 9: e84307.
Hoffmann, A. A., C. M. Sgrò, and T. N. Kristensen. 2017. Revisiting adaptive po-tential, population size, and conservation. Trends in Ecology Evolution 32: 506–517.
Houehanou, T. D., K. Prinz, and F. Hellwig. 2019. Characterization of 15 nuclear microsatellite markers for Afzelia africana (Fabaceae) and related species.
Applications in Plant Sciences 7: e1249.
Ikabanga, D. U., T. Stévart, K. G. G. Koffi, F. K. Monthé, E. C. N. Doubindou, G. Dauby, A. Souza, et al. 2017. Combining morphology and population genetic analysis uncover species delimitation in the widespread African tree genus
Santiria (Burseraceae). Phytotaxa 321: 166–180.
Jacana, J. 1997. Sappi tree spotting Lowveld. Jacana Education, Johannesburg, South Africa.
Jinga, P., and M. V. Ashley. 2018. A mountain range is a strong genetic barrier between populations of Afzelia quanzensis (pod mahogany) with low genetic diversity. Tree Genetics and Genomes 14: 4.
Jinga, P., J. Palagi, and V. A. Ashley. 2016. Development of microsatellite loci of pod mahogany, Afzelia quanzensis (Fabaceae), by Illumina shotgun sequenc-ing, and cross-amplification in A. africana. Applications in Plant Sciences 4: 16000010.
Kato, M., Y. Kosaka, A. Kawakita, Y. Okuyama, C. Kobayashi, T. Phimminith, and D. Thongphan. 2008. Plant–pollinator interactions in tropical monsoon for-ests in southeast Asia. American Journal of Botany 95: 1375–1394.
Kyndt, T., A. E. Assogbadjo, O. J. Hardy, R. Glele Kakaï, B. Sinsin, P. Van Damme, and G. Gheysen. 2009. Spatial genetic structuring of baobab (Adansonia
digitata, Malvaceae) in the traditional agroforestry systems of West Africa. American Journal of Botany 96: 950–957.
Lézine, A. M. 1989. Late Quaternary vegetation and climate of the Sahel.
Quaternary Research 32: 317–334.
Li, H., and R. Durbin. 2009. Fast and accurate short read alignment with Burrows-Wheeler transform. Bioinformatics 25: 1754–1760.
Li, H., B. Handsaker, A. Wysoker, T. Fennell, J. Ruan, N. Homer, G. Marth, et al. 2009. The sequence alignment/map format and SAMtools. Bioinformatics 25: 2078–2079.
Librado, P., and J. Rozas. 2009. DnaSP vol 5: a software for comprehensive analy-sis of DNA polymorphism data. Bioinformatics 25: 1451–1452.
Linder, H. P., H. M. de Klerk, J. Born, N. D. Burgess, J. Fjeldsa, and C. Rahbek. 2012. The partitioning of Africa: statistically defined biogeographical regions in sub-Saharan Africa. Journal of Biogeography 39: 1189–1205.
Lioubimtseva, E., B. Simon, H. Faure, L. Faure-Denard, and J. M. Adams. 1998. Impacts of climatic change on carbon storage in the Sahara-Gobi desert belt since the Last Glacial Maximum. Global and Planetary Change 16–17: 95–105.
Liu, N., L. Chen, S. Wang, C. Oh, and H. Zhao. 2005. Comparison of single-nucle-otide polymorphisms and microsatellites in inference of population struc-ture. BMC Genetics 6 (Supplement 1): S26.
Logossa, Z. A., L. Camus Kulandaivelu, F. Allal, A. Vaillant, H. Sanou, K. Kokou, and J. Bouvet. 2011. Molecular data reveal isolation by distance and past
population expansion for the shea tree (Vitellaria paradoxa C.F.Gaertn) in West Africa. Molecular Ecology 20: 4009–4027.
Loiselle, B. A., V. L. Sork, J. Nason, and C. Graham. 1995. Spatial genetic structure of a tropical understory shrub, Psychotria iofficinalis (Rubiaceae). American
Journal of Botany 82: 1420–1425.
Lompo, D., B. Vinceti, H. Konrad, H. Gaisberger, and T. Geburek. 2018. Phylogeography of African locust bean (Parkia biglobosa) reveals genetic divergence and spatially structured populations in West and Central Africa.
Journal of Heredity 109: 811–824.
Lowe, W. H., and F. W. Allendorf. 2010. What can genetics tell us about popula-tion connectivity? Molecular Ecology 19: 3038–3051.
Lyam, P. T., J. Duque-Lazo, W. Durka, F. Hauenschild, J. Schnitzler, I. Michalak, O. T. Ogundipe, and N. Muellner-Riehl. 2018. Genetic diversity and distribu-tion of Senegalia senegal (L.) Britton under climate change scenarios in West Africa. PLOS One 13: e0194726.
Maley, J. 1996. The African rain forest – main characteristics of changes in veg-etation and climate from the upper cretaceous to quaternary. Proceedings of
the Royal Society of Edinburgh 104B: 31–73.
Migliore, J., E. Kaymak, C. Mariac, T. L. P. Couvreur, B.-J. Lissambou, R. Piñeiro, and O. J. Hardy. 2018. Pre-Pleistocene origin of phylogeographical breaks in African rain forest trees: new insights from Greenwayodendron (Annonaceae) phylogenomics. Journal of Biogeography 46: 212–223. Monthe, F. K., J. Duminil, E. Kasongo Yakusu, H. Beeckman, N. Bourland, J.-L.
Doucet, et al. 2018. The African timber tree Entandrophragma congoense (Pierre ex De Wild.) A.Chev. is morphologically and genetically distinct from
Entandrophragma angolense (Welw.) C.DC. Tree Genetics and Genomes 14:
5.
Ndiade-Bourobou, D., O. J. Hardy, B. Favreau, H. Moussavou, E. Nzengue, A. Mignot, and J.-M. Bouvet. 2010. Long-distance seed and pollen dispersal inferred from spatial genetic structure in the very low-density rainforest tree, Baillonella toxisperma Pierre, in Central Africa. Molecular Ecology 19: 4949–4962.
Nei, M. 1987. Molecular evolutionary genetics, Columbia University PressNew York, NY.
Nielsen, R., D. R. Tarpy, and H. K. Reeve. 2003. Estimating effective paternity number in social insects and the effective number of alleles in a population.
Molecular Ecology 12: 3157–3164.
Odee, D. W., A. Telford, J. Wilson, A. Gaye, and S. Cavers. 2012. Plio-Pleistocene history and phylogeography of Acacia senegal in dry woodlands and savan-nahs of sub-Saharan tropical Africa: evidence of early colonisation and re-cent range expansion. Heredity 109: 372–382.
Omondi, S. F., E. Kireger, O. G. Dangasuk, B. Chikamai, D. W. Odee, S. Cavers, et al. 2010. Genetic diversity and population structure of Acacia senegal (L.) Willd. in Kenya. Tropical Plant Biology 3: 59–70.
Ouédraogo-Koné, S., C. Y. Kaboré-Zoungrana, and I. Ledin. 2008. Important characteristics of some browse species in an agrosilvopastoral system in West Africa. Agroforestry Systems 74: 213–221.
Pakkad, G., S. Kanetani, and S. Elliott. 2014. Genetic diversity and differentiation of an endangered tree species, Afzelia xylocarpa (Kurz) craib in Thailand revealed by nuclear microsatellite markers. African Journal of Biotechnology 13: 366–377.
Patterson, N., A. L. Price, and D. Reich. 2006. Population structure and eigen analysis. PLOS Genetics 2: e190.
Piñeiro, R., G. Dauby, E. Kaymak, and O. J. Hardy. 2017. Pleistocene population expansions of shade-tolerant trees indicate fragmentation of the African rainforest during the Ice Ages. Proceedings of the Royal Society, B, Biological
Sciences 284.
Piry, S., G. Luikart, and J. M. Cornuet. 1999. BOTTLENECK: a computer pro-gram for detecting recent reductions in the effective population size using allele frequency data. Journal of Heredity 90: 502–503.
Price, A. L., N. J. Patterson, R. M. Plenge, M. E. Weinblatt, N. A. Shadick, and D. Reich. 2006. Principal components analysis corrects for stratification in ge-nome-wide association studies. Nature Genetics 38: 904–909.
Quézel, P. 1965. La végétation au Sahara. Du Tchad à la Mauritanie. Gustav Ficher Verlag, Stuttgart, Germany.
Safner, T., M. P. Miller, B. H. McRae, M. J. Fortin, and S. Manel. 2011. Comparison of Bayesian clustering and edge detection methods for inferring boundar-ies in landscape genetics. International Journal of Molecular Sciences 12: 865–889.
Salzmann, U., P. Hoelzmann, and I. Morczinek. 2002. Late Quaternary climate and vegetation of the Sudanian zone of Northeast Nigeria. Quaternary
Research 58: 73–83.
Satabié, B. 1994. Biosystématique et vicariance dans la flore camerounaise.
Bulletin du Jardin Botanique National Belge 63: 125–170.
Sexton, G. J., C. H. Frere, A. Kalinganire, A. Uwamariya, A. J. Lowe, I. D. Godwin, P. J. Prentis, and M. J. Dieters. 2015. Influence of putative forest refugia and biogeographic barriers on the level and distribution of genetic variation in an African savannah tree, Khaya senegalensis (Desr.) A.Juss. Tree Genetics
and Genomes 11: 103.
Tajima, F. 1989. Statistical method for testing the neutral mutation hypothesis by DNA polymorphism. Genetics 123: 585–595.
Tsy, J. L., R. Lumaret, D. Mayne, V. A. Mohamed, Y. I. M. Abutaba, M. Sagna, S. Raoseta, and P. Danthu. 2009. Chloroplast DNA phylogeography sug-gest a West African centre of origin for the baobab, Adansonia digitata L. (Bombacoideae, Malvaceae). Molecular Ecology 18: 1707–1715.
Van Wyk, B., and P. Van Wyk. 1997. Field guide to trees of southern Africa. Struik Publishers, Cape Town, South Africa.
Vekemans, X., and O. J. Hardy. 2004. New insights from fine-scale spatial genetic structure analyses in plant populations. Molecular Ecology 13: 921–935. Vincens, A., L. Bremond, S. Brewer, G. Buchet, and P. Dussouillez. 2006. Modern
pollen-based biome reconstructions in East Africa expanded to southern Tanzania. Review of Palaeobotany and Palynology 140: 187–212.
Waller, M., and U. Salzmann. 1999. Holocene vegetation changes in the Sahelian zone of NE Nigeria: the detection of anthropogenic activity. Palaeoecology of
Africa and the Surrounding Islands 26: 85–102.
Watrin, J., A.-M. Lézine, and C. Hély. 2009. Plant migration and plant commu-nities at the time of the “green Sahara”. Comptes Rendus Geoscience 341: 656–670.
Watterson, G. A. 1975. On the number of segregating sites in genetical models without recombination. Theoretical Population Biology 7: 256–276. Yang, X., Y. Xu, T. Shah, H. Li, Z. Han, J. Li, and J. Yan. 2011. Comparison of
SSRs and SNPs in assessment of genetic relatedness in maize. Genetica 139: 1045–1054.
Zheng, X., D. Levine, J. Shen, S. M. Gogarten, C. Laurie, and B. S. Weir. 2012. A high-performance computing toolset for relatedness and principal compo-nent analysis of SNP data. Bioinformatics 28: 3326–3328.