Highly Integrated MEMS Resonators for CO2 Gas Sensing
By
Alberto PRUD HOMME BUELNA
MANUSCRIPT-BASED THESIS PRESENTED TO ÉCOLE DE
TECHNOLOGIE SUPÉRIEURE IN PARTIAL FULFILLMENT FOR A
MASTER’S DEGREE WITH THESIS IN ELECTRICAL ENGINEERING
M.A.Sc.
MONTREAL, JUNE 15, 2020
ÉCOLE DE TECHNOLOGIE SUPÉRIEURE UNIVERSITÉ DU QUÉBEC
This Creative Commons license allows readers to download this work and share it with others as long as the author is credited. The content of this work can’t be modified in any way or used commercially.
BOARD OF EXAMINERS (THESIS M.SC.A.)
THIS THESIS HAS BEEN EVALUATED BY THE FOLLOWING BOARD OF EXAMINERS
Mr. Frederic Nabki, Thesis Supervisor
Department of Electrical Engineering, École de technologie supérieure
Mr. Ricardo Izquierdo, President of the Board of Examiners
Department of Electrical Engineering, École de technologie supérieure
Mr. Dominic Deslandes, Member of the jury
Department of Electrical Engineering, École de technologie supérieure
THIS THESIS WAS PRENSENTED AND DEFENDED
IN THE PRESENCE OF A BOARD OF EXAMINERS AND PUBLIC MAY 29, 2020
RÉSONATEUR MEMS HAUTEMENT INTÉGRÉ POUR LA DÉTECTION DU CO2
Alberto PRUD HOMME BUELNA
RÉSUMÉ
Les capteurs de gaz sont une technologie largement utilisée pour de nombreuses applications, faisant de la crise climatique actuelle un déclencheur pour le développement de ces technologies pour mesurer les gaz à effet de serre, principalement le CO2.
Avec le développement de nouveaux processus de microfabrication, il a été possible de produire des micro-résonateurs pour de multiples applications, telles que les capteurs de gaz, offrant de multiples avantages par rapport aux capteurs commerciaux, grâce au fait qu’ils utilisent moins d’énergie, sont plus petits et plus économiques à produire.
Bien que les différentes parties qui intégreraient les micro-résonateurs devant être utilisés comme capteurs aient fait l’objet de recherches pendant des années, la possibilité de créer un capteur MEMS entièrement intégré comme capteur de gaz n’a pas été suffisamment explorée. Il est donc nécessaire de déterminer s’il est possible de créer un capteur MEMS entièrement intégré basé sur les micro-résonateurs, qui soit fonctionnel et présente une compétitivité sur le marché actuel des capteurs de gaz.
Ce projet est axé sur la création d’un prototype de capteur MEMS CO2 entièrement fonctionnel
dont la variable de mesure est la variation de la fréquence de résonance du micro-résonateur intégré, pour lequel ils ont été caractérisés par de multiples revêtements à base d’amines polymères.
Avec la mise au point réussie d’un capteur MEMS pour le CO2, il est possible de réaliser une
solution entièrement intégrée en utilisant des micro-résonateurs et qui peut être compétitive avec les capteurs existants sur le marché, cependant, en raison de l’impact de variables externes telles que la pression, la température et l’humidité sur la performance du capteur, il est nécessaire de réaliser des éléments de compensation qui garantissent la fiabilité et la précision de ces capteurs.
Mots-clés: résonateur MEMS, Polyethylenimine; Micro-résonateur; Capteur de CO2; Capteur
de gaz; Capteur d'humidité; Oxyde de graphène réduit; Revêtements; Capteur de masse, capteur régénératif, adsorbant CO2.
HIGHLY INTEGRATED MEMS RESONATORS FOR CO2 GAS SENSING
Alberto PRUD HOMME BUELNA ABSTRACT
Gas sensors are a technology widely used for many applications and purposes. Notably, the current climate crisis is a motivation for the development of sensors to measure greenhouse gases, mainly CO2. With the development of new microfabrication
processes it has been possible to produce micro-resonators for multiple applications, such as gas sensors, offering multiple advantages over commercial sensors, thanks to the fact that they use less energy, are smaller, and are more economical to produce. While the different parts of an integrated micro-resonator sensor have been researched for years, the possibility of creating a fully integrated gas sensor using a micro-resonator has not been sufficiently explored. This has created the need to examine whether it is possible to create a fully integrated microelectromechanical system (MEMS) CO2 sensor based on micro-resonators, which is functional and competitive
with the current gas sensor market.
This master’s thesis is focused on the creation of a fully functional CO2 MEMS sensor
prototype whose measurement variable is the variation of the resonance frequency of the integrated micro-resonator in the presence of a CO2 concentration in air. For this
purpose, multiple adsorbance coatings based on polymeric amines are characterized. Afterward, a fully integrated MEMS CO2 sensor is implemented, including both
electronics and micro-resonator with its adsorbent coating. It is shown that the sensor can be competitive with commercial optical CO2 sensors. However, due to the impact
of external variables such as pressure, temperature and humidity on the performance of the sensor, it is necessary to perform compensation to guarantee the reliability and accuracy of the measurements.
Keywords: MEMS resonator, Polyethylenimine; Micro-resonator; CO2 Sensor; Gas
Sensor; Humidity Sensor; Reduced Graphene Oxide; Coatings; Mass Sensor, Regenerative sensor, CO2 adsorbent.
TABLE OF CONTENTS
Page
INTRODUCTION ...1
CHAPTER 1 LITERATURE REVIEW ...9
1.1 Main parameters of gas sensors ...9
1.2 Gas sensing techniques ...10
1.2.1 Methods based on impedance variation ... 11
1.2.2 Methods based on other kinds of variations ... 15
1.2.3 Comparative of CO2 sensor (ranges and precision) ... 19
1.2.4 Conclusion ... 21
1.3 Microelectromechanical system (MEMS) ...21
1.3.1 MEMS resonators ... 23
1.3.2 MEMS mass sensing for gas concentration measurement ... 29
1.4 Material adsorbent coatings ...46
1.4.1 Selectivity ... 46
1.4.2 Interaction with other gases ... 47
1.4.3 External influences ... 47 1.4.4 Deposition technique ... 47 1.4.5 Reversibility ... 47 1.4.6 Sensitivity ... 48 1.4.7 Partition coefficient ... 48 1.4.8 Regeneration of coatings ... 49 1.5 Conclusion ...52
CHAPTER 2 COMPARISON BETWEEN LINEAR AND BRANCHED POLYETHYLENIMINE AND REDUCED GRAPHENE OXIDE COATINGS AS A CAPTURE LAYER FOR MICRO RESONANT CO2 GAS CONCENTRATION SENSORS ...55
2.1 Introduction ...56
2.2 Materials and Methods ...59
2.2.1 Coating Preparation ... 60
2.2.2 Test Setup... 65
2.2.3 Micro-resonator Characteristics ... 67
2.3 Results ...68
2.3.1 Linear and Branched Polyethylenimine Coatings Characterization ... 69
2.3.2 Linear Polyethylenimine with reduced Graphene Oxide Coating Characterization ... 71
2.3.3 Performance Comparison between the Coatings ... 73
2.3.4 Micro-resonator CO2 sensor Proof-of-concept ... 77
2.4 Discussion ...79
CHAPTER 3 AN 8 MW FULLY INTEGRATED REGENERATIVE RESONANT MEMS CO2 SENSOR USING LINEAR POLYETHYLENIMINE AS
A CAPTURE LAYER ...85
3.1 Introduction ...86
3.2 System Integration ...88
3.2.1 MEMS micro-resonator fabrication and characterization ... 88
3.2.2 Adsorption coating deposition ... 90
3.2.3 CO2 sensor characterization setup ... 92
3.2.4 MEMS CO2 integration... 93
3.3 Measurement Results ...96
3.3.1 Response to CO2 concentrations ... 97
3.3.2 Impact of ambient conditions... 101
3.3.3 Long term stability ... 102
3.4 Discussion ...104
3.5 Conclusions ...106
CONCLUSION AND DISCUSSION...108
LIST OF TABLES
Page
Table 1.1 Sensors performance comparison ...20
Table 1.2 Main published micro-resonators for gas sensing ...34
Table 1.3 Excitation methods in resonators ...37
Table 1.4 PolyMUMPS fabrication parameters ...42
Table 1.5 PiezoMUMPS fabrication parameters ...45
Table 1.6 Most common adsorbent coating for gas sensors ...51
Table 2.1 Frequency shift of each coating at different concentration of CO2 ...74
Table 2.2 Linearized coefficient of the frequency shift by ppm of CO2 ...74
Table 2.3 Adsorption time for each coating ...75
Table 2.4 Recovery time for each coating ...76
Table 2.5 Frequency shift of the micro-resonator at different CO2 concentrations ...79
Table 2.6 Comparison of the studied CO2 adsorbing coatings with other published works ...80
Table 3.1 Comparison of the studied CO2 MEMS sensor with other published works ...105
LIST OF FIGURES
Page
Figure 0.1 CO2 generation sources ...1
Figure 0.2 Global CO2 concentration level ...2
Figure 0.3 Main elements of a resonant MEMS resonant gas sensor ...4
Figure 1.1 Gas Sensing methods ...11
Figure 1.2 Recovery time of gas sensors ...11
Figure 1.3 Metal Oxide sensor diagram ...12
Figure 1.4 Polymer sensor diagram ...14
Figure 1.5 Carbon Nanotubes sensors ...14
Figure 1.6 Optical Sensors ...16
Figure 1.7 Calorimetric sensors...17
Figure 1.8 Gas Chromatography Sensors ...17
Figure 1.9 Piezoelectric sensors ...18
Figure 1.10 Undamped system diagram ...24
Figure 1.11 Damped system diagram ...25
Figure 1.12 Trace of system with different level of damping ...26
Figure 1.13 Amplitude of resonance by damping ...27
Figure 1.14 Q factor diagram ...28
Figure 1.15 Frequency deviation diagram ...30
Figure 1.16 Resonant modes of MEMS bridge ...31
Figure 1.17 Cantilever micro-resonator ...32
Figure 1.18 Bridge micro-resonator ...32
Figure 1.20 Disc micro-resonator ...33
Figure 1.21 Piezoelectric actuation in resonator ...35
Figure 1.22 Electrostatic cantilever ...35
Figure 1.23 Electro-thermal micro-resonator ...36
Figure 1.24 Electrostatic MEMS resonator operation ...40
Figure 1.25 PolyMUMPS lateral cut representation ...41
Figure 1.26 Piezoelectric MEMS resonator operation ...43
Figure 1.27 PiezoMUMPS lateral cut representation ...44
Figure 1.28 Coating regeneration diagram ...50
Figure 2.1 (a) Branched Polyethylenimine Molecule, and (b) Lineal Polyethylenimine Molecule ...60
Figure 2.2 Coating deposition technique, (a) Spin coater for the Quartz Crystal used for initial coating tests, (b) Micro-drop deposition by piezo probe used for the micro-resonator ...62
Figure 2.3 Reduced Graphene Oxide by Microwave reduction ...63
Figure 2.4 SEM image of the quartz crystal coated with the (a) Branched PEI layer, (b) Linear PEI layer and (c) rGO with Linear PEI layer ...64
Figure 2.5 IR absorption spectroscopy result for the three deposited coatings on the quartz crystals ...65
Figure 2.6 Diagram of the characterization setup ...65
Figure 2.7 (a) Setup for the quartz crystals and the resonator characterization, (b) Close-up of the micro-resonator during the characerizacion with the laser from the vibrometer visible ...66
Figure 2.8 Cross-section of the micro-resonator with oxide as sacrificial layer ...67
Figure 2.9 (a) 3D view of the real micro-resonator obtained by the Olympus LEXT OLS4000 Confocal microscope, (b) Eigenfrequency FEM COMSOL simulation ...68
Figure 2.10 Quartz crystal frequency shift in response to different CO2 concentration cycles for (a) Branched PEI coated crystal, and (b) Linear PEI coated crystal ...70
Figure 2.11 Branched PEI and Linear PEI coated crystals ...71 Figure 2.12 Frequency shift of the quartz crystal with LPEI+rGO ...72 Figure 2.13 Response of the three different coatings at CO2 concentrations
of (a) 0.1%, (b) 0.5%, and (c) 1% ...73 Figure 2.14 Frequency shift of each coating from 0.05% to 1% of CO2 ...75
Figure 2.15 (a) Adsorption time for each coating at different CO2 concentrations,
(b) Recovery time for each coating at different CO2 level ...75
Figure 2.16 Frequency shift at different range of air humidity from 15
to 75 %RH...76 Figure 2.17 Response of the coated micro-resonator to a 0.8% CO2 concentration
variation ...77 Figure 2.18 Behavior of the micro-resonator over time at different concentrations
of CO2 ...78
Figure 3.1 Cross-section of the MEMS resonator based on a cantilever structure. ....89 Figure 3.2 Uncoated micro-resonator (a) SEM micrograph, and (b) 3D
view obtained by confocal microscope. ...89 Figure 3.3 Micro-resonator resonance frequency at (a) mode 1, (b) mode 2,
(c) mode 3; (d) Vibrometer resonant frequency measurement of
the three modes of the micro-resonator ...90 Figure 3.4 Setup used for the deposition of the LPEI coating using the two-axis
piezo actuator ...91 Figure 3.5 Vibrometer measurement after the LPEI coating deposited ...92 Figure 3.6 (a) Diagram of the characterization setup, (b) Setup for the CO2 gas
sensor characterization ...93 Figure 3.7 MEMS CO2 sensor block diagram ...94
Figure 3.8 Measured CO2 MEMS sensor signal waveforms at the different points
labelled in Fig. 3.7 steady-state at (a) P1 and (b) P2, and (c) startup
transient of the resonator at P3...95 Figure 3.9 Fully integrated sensor, (b) Sensor integrated with protector casing ...96 Figure 3.10 MEMS and optical sensor response to different CO2 concentrations ...97
Figure 3.11 Adsorption and Recovery times based in the CO2 concentration ...99
Figure 3.12 MEMS sensor frequency deviation by CO2 concentration ...100
Figure 3.13 Response of the MEMS sensor to variations in (a) humidity,
(b) temperature and (c) atmospheric pressure. ...101 Figure 3.14 Long term test of the CO2 MEMS sensor ...103
LIST OF ABREVIATIONS AlN Aluminum Nitride
BPEI Branched Polyethylenimine
CAGR Compound Annual Growth Rate Calculator
CO2 Carbon Dioxide
GO Graphene Oxide
LPEI Linear Polyethylenimine
MEMS Microelectromechanical systems NDIR Nondispersive Infrared Detector
NOX Nitrogen Oxide
O Oxygen PCB Printed Circuit Board PEI Polyethylenimine PPM Parts per Million
QCM Quartz Crystal Microbalance Q-Factor Quality Factor
rGO Reduced Graphene Oxide SAW Surface Acoustic Wave
SEM Scanning Electron Microscopy VNA Vector Network Analyzer % RH Relative Humidity
LIST OF SYMBOLS ζ Damping ratio Y Young’s modulus ρ Material density wn Natural frequency m Mass k Spring constant τ Period Fn Natural frequency Cc Damping coefficient
Wd Damped natural frequency Q Q-factor
Fmax Resonance Frequency
INTRODUCTION Motivation
The concentration of greenhouse gases in air have increased in recent years, and the consequences have begun to be visible in our environment. The source of these gases is mainly based on industrial processes, combustion engines in the transport system, electricity production, among others (EPA, 2017). The main CO2 sources are summarized in Figure 0.1.
Figure 0.1 CO2 generation sources
Adapted from EPA (2017)
Concentration levels of gases harmful to humans have become a metric that requires constant supervision for open areas or enclosed spaces (Arshak, 2004; Kumar, Kim, & Hancke, 2013; Mahyuddin & Awbi, 2012). The common effects presented in humans are shown in Table 0.1
Table 0.1 Effects of different levels of CO2 concentration in humans
Taken from Satish et al. (2012)
CO2 concentration Effects in humans
250-400 ppm Normal outdoor ambient air
400-1,000 ppm Concentrations typical of occupied indoor spaces 1,000-2,000 ppm Complaints of drowsiness and poor air
2,000-5,000 ppm Headaches, sleepiness and stagnant, stale, stuffy air. >40,000 ppm Exposure may lead to serious oxygen deprivation resulting
The global CO2 concentration level in the atmosphere has been steadily increasing over the
last decades. The measurements made indicate that the global CO2 level of 400 ppm has been
exceeded in 2018, being a drastic change in a short period of time from 340 ppm in only a period of 20 years (ESRL, 2020). The change of CO2 levels during the last years is show in
Figure 0.2.
Figure 0.2 Global CO2 concentration level
Adapted from ESRL (2020)
The constant need to monitor the concentration of gases such as CO2 in open spaces or areas
of common use among people, has encouraged the development of economical, reduced and low power consumption gas sensors. Notably, the sensors with the greatest expansion potential are Oxygen (O), Carbon Dioxide (CO2), and Nitrogen Oxide (NOX) sensors. This has led to
the market for gas sensors being valued at more that USD 2 billion since 2018 with a Compound Annual Growth Rate Calculator (CAGR) of 7.8% to reach in 2025. ("Gas Sensor Market Size, Share & Trends Analysis Report By Product (CO2, NOx, CO, O2 Sensors), By
Technology (Semiconductor, Infrared), By End Use (Building Automation & Domestic Appliance, Industrial), And Segment Forecasts, 2019 - 2025," 2019).
Research problem
The sensors for measuring the concentration of gases in the air has been a subject of research and development both academically and industrially, due to their wide range of applications, especially for measuring the concentration of toxic gases or for gas control in chemical processes that require precision in the concentration of the elements in reaction. The measurement of the concentration of CO2 in the air has now become very important due to its
impact on both human health and the climatic effects that develop because of the high concentrations present in the air (Aleixandre & Gerboles, 2012).
Different techniques are used in a sensor to measure the concentration of gases (Nazemi, Joseph, Park, & Emadi, 2019). Certain are resistive, which are formed by a metal oxide that changes its resistance or conductivity when exposed to different ambient gases (Dey, 2018; C.-H. Yu, Huang, & Tan, 2012). Another common method used in gas sensors is electrochemical reactions that happen between the gas and the an electrolyte producing a current that depends on the gas concentrations (J. Zhang et al., 2019). Infrared Gas Absorption is one of the most common technology for CO2 sensors. These sensors pass infrared light through the gas and the
asymmetric molecules presented in the gas adsorb the radiation at determined bands of adsorption characteristic of each molecule (Bogue, 2015).
L. M. Roylance in 1979 (Muro, 2013) pioneered MEMS resonant gas sensors which have become an innovative method of gas measurement, and are based on the mechanical properties of microstructures. Every mechanical structure has a resonance mode, whose frequency is given by the dimensions, geometry and material of which it is made. Microfabrication has allowed creating structures so small that they are susceptible to the weight of a few gas molecules, which adhere to the microstructure by means of an adsorbent material that is a function of the type of gas of interest (Subhashini & Juliet, 2012; Zribi, Knobloch, Tian, & Goodwin, 2005).
MEMS gas sensors have been shown to have the potential to measure concentrations in the range of parts per billion in volume requiring a much smaller volume and a very low current consumption compared to traditional systems (Lv, Xu, Yu, Xu, & Li, 2018). These sensors have two elements that define their sensitivity and operating capabilities. The first is the coating that will adsorb the molecules of the gas to be monitored by increasing the mass of the micro-resonator, whereby the resonance frequency will decrease depending on the concentration of the gas. The second element is the microstructure which will resonate at a certain frequency based on its dimensions and geometry (R. Abdolvand, B. Bahreyni, J. E.-Y. Lee, & F. Nabki, 2016).
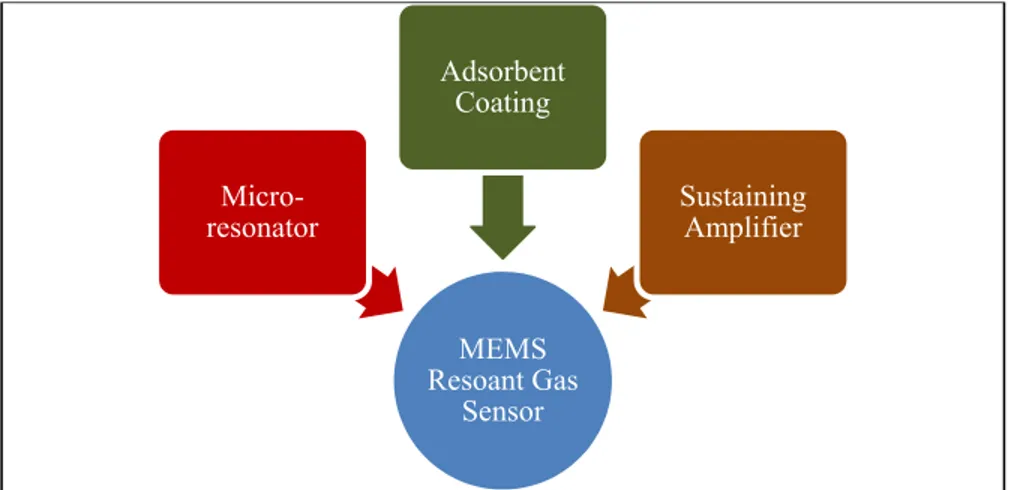
Multiple parameters define the gas sensors performance but the most relevant are their selectivity to the target gas, reaction and recovery times, and lifetime. In the MEMS gas sensors these characteristics depend mostly on the adsorbent coating, the gas selectivity being the most critical and complex of the parameters (Smulko Janusz, 2015). Figure 0. shows the main elements required to implement a MEMS resonant gas sensor.
Figure 0.3 Main elements of a resonant MEMS resonant gas sensor
The micro-resonator requires a transducer to keep the micro-structure in resonance, transducing electrical energy to mechanical energy. This can be done through piezoelectric materials, electrostatic actuation, thermal actuation, etc. In addition to the transducer, a closed loop control system is normally developed to maintain the micro-resonator in constant
MEMS Resoant Gas Sensor Micro-resonator Adsorbent Coating Sustaining Amplifier
resonance. Its design is a function of the characteristics of the micro-resonator and its application, this control system is known as a sustaining amplifier. Its main function is to amplify, condition, and feedback the signal generated by the micro-resonator to achieve a stable oscillator equilibrium based on the resonance frequency of the micro-resonator. This oscillation can in turn be monitored in order to capture resonant frequency changes in the micro-resonator due to the absorbent coating in the presence of gas molecules.
Research Objectives
The goal of this thesis is the development of a fully integrated and operational CO2 MEMS
sensor that has similar capabilities to commercial sensors with regard to measurement range. Size and low power consumption of the sensor are also important parameters to minimize to make it suitable for highly integrated systems.
The specific objectives are:
• the design of a micro-resonator for the measurement of gas concentration by applying a commercial MEMS fabrication process, as well as existing simulation and modeling techniques;
• the analysis of CO2 adsorbent materials for use with the micro-resonator in order to enable
good CO2 adsorption and recovery performance;
• the design of a sustaining amplifier co-designed to support oscillation of the micro-resonator;
• the integration of the micro-resonator, adsorbent coating and sustaining amplifier and characterization of the resulting sensor.
Ultimately, the micro-resonator was designed, fabricated and coated with a adsorbent coating, and the electronics were designed and integrated with the micro-resonator to achieve an integrated CO2 sensor. Characterization of the sensor and its comparison to a commercial CO2
sensor were carried out in order to define the strengths and areas of opportunity for improvement of the proposed sensor.
Contributions
The main contribution of this work is the development of a fully integrated CO2 MEMS sensor
that can show the capabilities and limitations of this kind of technology applied as mass sensors for gas sensing. The design, fabrication and integration are presented during the next chapters. The contributions of each element previously mentioned that were necessary to integrate the solution are:
1. Evaluation of the geometries and excitation method for micro-resonators for gas sensing
During the development of this work, two micro-resonator chips were manufactured using different manufacturing and excitation techniques in order to ascertain the optimal micro-resonator geometry for the targeted application. The first chip was manufactured using the PolyMUMPS commercial process, which uses electrostatic excitation and has three layers of Polysilicon available. The second chip was manufactured using the commercial process of PiezoMUMPS, which uses a layer of piezoelectric material for the micro-resonator’s excitation. Different geometries were manufactured in the two chips and were analyzed to be applied in the CO2 MEMS sensor.
2. Comparison between multiple adsorbent materials for CO2
For the selection of the adsorbent material, three options based on Polyethylenimine (PEI) were analyzed, in which its properties and performance were analyzed under different conditions allowing the best of them to be selected for use with the micro-resonator.
3. Fully integrated CO2 MEMS sensor demonstration
The micro-resonator, adsorbent coating and sustaining amplifier were integrated to demonstrate a complete integrated CO2 sensor. Once the sensor was integrated, a complete
characterization was carried out showing the capabilities and limitations of this type of solutions for the measurement of CO2 concentration, as well as its advantages over commercial
sensors.
4. Adsorbent material disposition method and gas chamber test setup
A deposition method to deposit a droplet of adsorbent material on a released micro-resonator after its micro-fabrication was devised.
A custom gas chamber test setup was designed and implemented to characterize the proposed sensor and allow its optical characterization using a vibrometer.
Thesis Outline
This is a manuscript-based thesis. Hence, chapters 2 and 3 present one journal paper each. The thesis is organized as follows:
Chapter 1 covers the literature review on gas sensing techniques of multiple sensors focussing on the advantages and disadvantages of each one. Also the operation principle of the MEMS resonators for the mass sensors is described, with a general introduction to the adsorption materials used in this kind of sensors.
Chapter 2 presents a comparison between the Linear and Branched Polyethylenimine to be applied as adsorption coating. Also, includes the evaluation of Linear Polyethylenimine with reduced graphene oxide. For the coating’s characterization, quartz crystals were used. Once the best coating was selected, an electrostatic MEMS resonator was tested as a proof-of-concept.
Chapter 3 includes the complete integration of the MEMS CO2 sensor. The design and
The coating used was Linear Polyethylenimine which was the one that provided the best results in Chapter 2. The sustaining amplifier and its integration with the micro-resonator is shown. Characterization of the resulting sensor to different CO2 levels, atmospheric pressure, humidity
and temperature are presented, and it is compared to a commercial CO2 sensor.
In the last chapter, the conclusions and discussion of this thesis are presented, including recommendations for future research and improvements.
CHAPTER 1 LITERATURE REVIEW
This chapter will discuss the most common techniques to measure the concentration of gases in environment atmosphere. A comparison of the advantages and disadvantages of each one will be made. The targeted gas will be CO2 as it is the focus of this thesis.
1.1 Main parameters of gas sensors
The measurement of the gas concentration in a specific space is of high relevance for many sectors, i.e. industrial production, mining, automotive, medical applications, environment conditions, indoor air quality, etc.
Each sector has specific requirements based in the conditions and applications of the sensor; this requirement will define the sensing technique to be used and the performance will be delimited by this technique.
Amongst the main characteristics that a sensor needs to satisfy, we find the sensibility of detection of the target gas, this means the minimum value of concentration that the sensor is capable of measuring with precision.
The repeatability of the measurements within the same conditions is a basic value that establishes the reliability of the sensor to be applied. The selectivity of the target gas is a crucial parameter in special at environment atmosphere, where the mixture and concentration of different gases change constantly, and the sensor needs to separate the target gas and obtain a reliable measure of it in comparison with the rest of the gas mixture.
Reaction time can be an important parameter for specific application, where the reaction of a subsystem depends of the measurement of the target gas in real time, or in systems where the
concentration of the gas changes drastically in a short period and it is necessary to follow this change with precision.
The concentration range of the gas that the sensor can operate is defined by the measure range. This limitation could be paramount when the process to be evaluated changes to a much wider range. The sensors with a wide concentration range usually have very low precision.
Once the sensor takes the measurement it is important that the system readapts to the current condition, this is known as reversibility. The sensing technique that uses a non-reversible chemical process, shortens the life span of the product, or alters its performance with the passing of time, also affected by the damage caused by the same reaction.
As a commercial consideration the fabrication cost will be an important parameter that defines whether the technology is competitive with other technologies. In the same way the power consumption will be a definitive parameter, specially for portable sensing equipment where the energy is provided by internal batteries (Arshak, Moore, Lyons, Harris, & Clifford, 2004; D. D. Lee, 2001; X. Liu et al., 2012).
1.2 Gas sensing techniques
As a general classification of the techniques used in the main gas sensor, it is possible to consider two main blocks, an electrical resistance variation based in the presence of the target gas and a second group of techniques that uses physics behaviors, like photons absorption, sound waves absorption or mass additional that change mechanical properties of the sensor.
Figure 1.1 Gas Sensing methods Taken from X. Liu et al. (2012)
1.2.1 Methods based on impedance variation
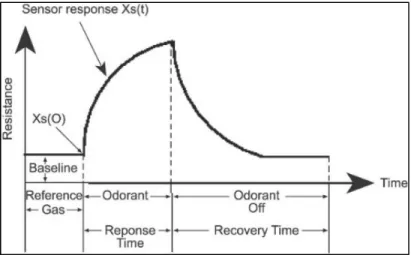
This method of measurement is based in the variation of the electrical properties of the material that conforms the sensor that will react proportionally to the concentration of the target gas in contact with the sensing material. For this technique, different materials and measurements can be used, these are the most used.
Figure 1.2 Recovery time of gas sensors Taken from Arshak et al. (2004)
1.2.1.1 Metal Oxide Semiconductor
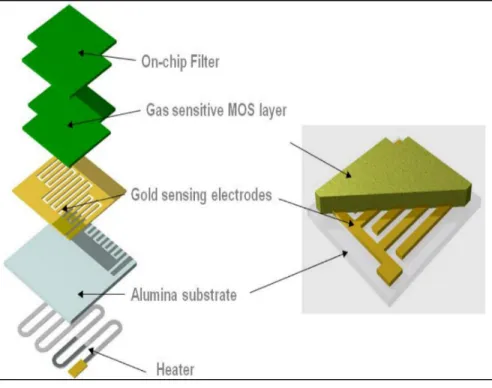
The metal oxide semiconductor sensors are based in the reaction of oxidation or reduction when the target gas gets in contact with the metal oxide surface. These reactions will cause a proportional change in the electrical resistance of the semiconductor in relation to the concentration of the gas present in the atmosphere (Arshak et al., 2004).
The metal oxide semiconductor sensor is very used for the detection of the inflammable gases and certain toxic gases. This kind of sensor usually includes a high temperature surface that will increase the performance of detection, a consequence of the nature of operation (D. D. Lee, 2001).
Figure 1.3 Metal Oxide sensor diagram Taken from Binions et Naik (2013)
This kind of sensors usually require a working temperature between 25°C to 600°C and the selectivity of the gases can be affected because if the temperature deviates too much from the optimal value, other gas components may be more reactive towards (X. Liu et al., 2012).
Because the principle of operation, this kind of sensors present a high sensibility and a very good recovery time and stability. The required space for this kind of sensor is equivalent to others that use different techniques and can be integrated directly with the control circuit.
The main disadvantage of this technology is the high consumption of energy in comparison with other sensors as consequence of the necessity of work at high temperature, that represents an energy loss in case of portable sensors (Dey, 2018).
1.2.1.2 Polymer
While the gas sensor based in metal oxide semiconductor has a high sensibility especially for inorganic gases and some organic compounds, the polymer sensor can be applied for the detection of inorganic gases as CO2 and H2O with better sensibility and stability (D. D. Lee,
2001).
In the case of the polymers as gas concentration sensors, it can be applied in two ways, as a conductive polymer and as a non-conductive polymer. As a conductive polymer the electrical resistance of the polymer will be affected linearly to the concentration of the target gas with a similar behavior of the metal oxide semiconductor.
In the case of the non-conductive polymer the target gas will be absorbed changing the mass of the polymer, this change can be applied in sensing systems like Quartz Crystal Microbalances, Surface acoustic wave, resonators, etc.
This kind of sensor will be evaluated in the next chapters. The selective factor of this kind of sensors depends on the physisorption mechanisms of the polymer used in the sensors. Polymer base sensors have the advantage of being capable of operating at room temperature, this represents a good alternative to the metal oxide sensor because of the reduction of the energy required to operate with portable sensors powered by batteries. Another quality of this kind of sensor is the low cost of production and the simple principle of operation.
Figure 1.4 Polymer sensor diagram Taken from D. D. Lee (2001)
The polymer sensors provide a high linear response to concentration for various analyses and good repeatability after a long number of exposures. Also, it has a high discrimination with a fast response and good recovery. This kind of material have high sensitivity to humidity and the sensor response can drift with time.
1.2.1.3 Carbon Nanotubes
The carbon nanotubes as gas sensing material uses the same principle of measurement of the polymers but with a bigger area to capture the gas, it can have a higher sensibility. The main difference with the metal oxide is the same as the polymers, it can work at ambient temperature, so it has a low power consumption.
Figure 1.5 Carbon Nanotubes sensors Taken from Akbari et al. (2014)
By having a high sensibility, it can measure the concentration of the gas without a preconcentration of the target gas, this facilitates the integration with the controller, reducing weight and production costs.
The nanotubes can be categorized in single-walled carbon nanotubes (SWCNTs) and multiwall carbon nanotubes (MWCNTs). MWCNTs are usually used for remote detection of carbon dioxide (CO2), oxygen (O2), and ammonia (NH3) depending on the measured changes in
MWCN’s permittivity and conductivity. The measure of CO2 and O2 shows that the response
is both linear and reversible, which means that the operation process only involves physisorption (Akbari et al., 2014).
1.2.2 Methods based on other kinds of variations
As it is possible to observe in the sensors with variation in the electrical resistance, the principle of operation is basically the same, only with the difference of the necessity of operating at high temperature but the signal to be evaluated will be the same.
Other methods to measure the concentration of gas can include techniques that use physics behaviors, like photons absorption, sound waves absorption or resonance systems that change the mechanical properties of the sensor proportionally to the concentration of the gas.
1.2.2.1 Optical measurement
The measurement of the gas concentration by optical system applies the spectroscopy principle, which is based in the molar absorptivity of the photon at specific wavelengths by the molecules of the gas, that will define the kind of gas and the concentration of it in the volume analyzed.
Based in the principle that this kind of sensors do not operate by contact of the gas with some reactive, the sensor will not be deteriorated and will offer a higher sensibility, a good selectivity and a better stability in comparison with the non-optical sensors (X. Liu et al., 2012).
Figure 1.6 Optical Sensors Taken from X. Liu et al. (2012)
The molecules of CO2 and CO have a unique spectrum at 4.25 and 4.7m in the IR region, and
the volume of photons absorbed will be in linear relation to the concentration of the gas.
Considering the capabilities and advantages of this kind of sensors it can be considered an excellent option, but at the same time, it is seriously restricted for the general applications due to miniaturization and high cost. Only a few commercial gas sensors are based on optical principles (Arshak et al., 2004; D. D. Lee, 2001).
1.2.2.2 Calorimetric
The calorimetric gas sensors use the thermal transmission coefficient of the gases to measure the concentration of the target gas in the volume. Usually this kind of sensors are used to detect gases with a significant difference in the thermal conductivity in relation with the air or combustible gases.
Figure 1.7 Calorimetric sensors Taken from X. Liu et al. (2012)
The main disadvantage of this kind of techniques for gas measurement is the low selectivity caused by the nature of the physical basis of the operation. In the same way the energy consumption is an important point to be considered in this technique (Spinelle et al., 2017).
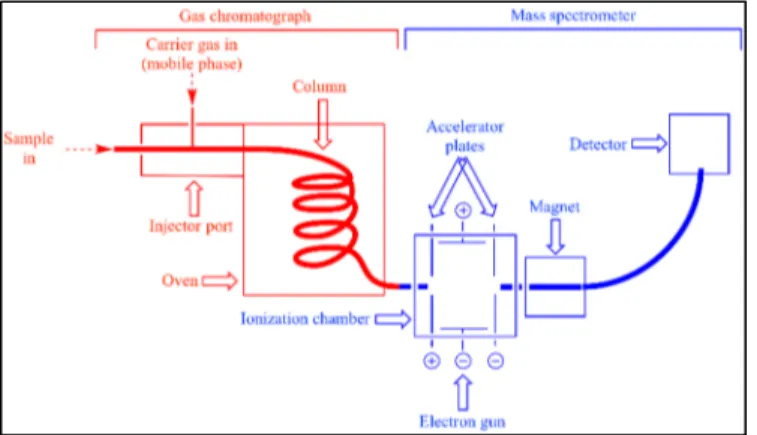
1.2.2.3 Gas Chromatography
The gas chromatography is one of the most precise methods for gas sensing but usually it is focused for laboratory applications, a consequence of the kind of equipment, the complexity of the process and the interpretation of the results.
Figure 1.8 Gas Chromatography Sensors Taken from Jimenez, Riu, et Rius (2007)
The cost of this kind of equipment is very elevated in comparison with any other kind of gas sensing and the miniaturization for a portable version represents a high technology development, which represents a non-viable application for commercial sensors (Jimenez et al., 2007).
1.2.2.4 Piezoelectric sensors
The piezoelectric sensor uses the combination of the absorption material properties for specific gases and the addition of mass for a resonant structure. In this kind of systems, the sensor can be confirmed by a surface acoustic wave (SAW) device and the quartz crystal microbalance (QCM). The SAW device produces a surface wave that travels along the surface of the sensor while the QCM produces a wave that travels through the bulk of the sensor (Arshak et al., 2004; D. D. Lee, 2001).
Figure 1.9 Piezoelectric sensors Taken from Smith (2007)
The resonance frequency of the quartz will shift proportionally to the addition of the mass into the coating that can be a polymer or any other substance that absorbs the target gas. The most critical element for the selectivity of the gas is the coating, this will determine the sensibility and operation range in the concentration of the gas.
This kind of sensor has a good response time and the recovery time will depend on the coating; in some cases it is necessary to include a heat generation element to facilitate the desorption of the gas absorbed.
The disadvantage of this sensor is the complexity of the circuitry and the interpretation of the results in comparison with the polymers or the oxide metal sensors, which change the resistance linearly. In this case it is necessary to measure the frequency shift with high precision, ignoring the noise generated by the natural variations of the system. The same principle of measurement can be applied for different resonant structures, as cantilever, bridges, etc. This will be the case of analysis of this project.
1.2.3 Comparative of CO2 sensor (ranges and precision)
Table 1.1 shows the analysis of how the market for sensors designed for the measurement of CO2 in the air is mainly covered by NDIR technology, due to the great advantage mentioned
above.
Also, the range covered by most of the available sensors is 300 to 10000 ppm, given the industrial applications it is necessary to be able to make such high measurements in the concentration of CO2. On the other hand, it is not common to find sensors that guarantee the
linearity of their signal below 300 ppm, because as aforementioned, the average concentration in the atmosphere is around 350 ppm, so it will not be common to find environments smaller than this concentration.
As far as accuracy is concerned, there is a wide range that will obviously depend on the quality of the sensor and the requirements of the application, however, it is possible to find acoustic or resonant sensors that reach a sensitivity of fractions of ppm (Chuang, Wu, Lu, & Lin, 2017; Gomes, Duarte, & Oliveira, 1995).
The response time also varies drastically from model to model and between technologies, however, the average time is between 10 and 15 seconds, being useful for most applications, and even measuring atmospheric conditions can be extended to minutes with no major impact on the process.
Table 1.1 Sensors performance comparison
Model/Paper Technique Range (ppm) Accuracy (ppm) Response time (s)
K30 NDIR 0-2000 30 30 S100 NDIR 0-5000 30 20 AN100 NDIR 0-5000 30 60 T6615 NDIR 0-5000 200 30 MT30 NDIR 0-5000 75 120 K30-FR NDIR 10000 30 2 H30-ER NDIR 1000 30 0.5 K33-ICB NDIR 10000 30 2 K33-ELG NDIR 30000 200 2 K33-BLG NDIR 100 30 15 LP8 NDIR 30000 200 15 S8 NDIR 10000 50 16 Sprint-WR NDIR 500 20 2 COZIR-WR Led-NDIR 10000 70 0.05 COZIR-AMB Led-NDIR 10000 50 0.25 COZIR-RM Led-NDIR 10000 50 1 MISIR Led-NDIR 10000 50 1 MiniR Led-NDIR 5000 50 0.5 Win-0005 Led-NDIR 10000 70 30
J.A Theile Acoustic 1000 100 N.R
A. Z Sadek Acoustic 1000 70 N.R
A. Z Sadek Acoustic 1500 80 N.R
1.2.4 Conclusion
After a brief collection of information on the existing sensors in the market and the main technologies they use, as well as their main advantages and areas of opportunity, it is possible to conclude that the measurement system to be developed should be able to cover the same requirements as the existing sensors, improving the range and accuracy that have been obtained, as well as providing a different option in measurement technique.
Among the main improvements that should be included is the ability to make measurements with an adequate linearity in a concentration range from 0 to 10000 ppm, which would give an important advantage. Also, to obtain a higher sensitivity that is in the tenth of a part per million ppm.
Finally, the energy consumption should be as low as possible, in order to give an energy advantage and cover areas where optical-based sensors have not been able to reach, as well as hot-plate sensors or any resistive techniques, which have a relatively high energy consumption. The stability on thermal changes and compensation on the humidity level must be a critical factor in the operation and precision of the system to be developed, otherwise it would be very limited to the operation in real situations.
1.3 Microelectromechanical system (MEMS)
MEMS are typically defined as small devices composed of microfabricated active and passive elements that perform different functions such as perception, data processing, communication and environmental performance. The types of MEMS devices can range from relatively simple structures that have no moving parts, to very complex electromechanical systems in which multiple elements move under the control of integrated electronics.
Thanks to advances in the field of semiconductors, MEMS is a technology that can be applied using a wide variety of materials and manufacturing techniques; the choice will depend on the type of device to be manufactured and the commercial sector in which you wish to operate.
This vision of MEMS, where microsensors, micro actuators, microelectronics and other technologies can be integrated into a microchip, is expected to be one of the most important advances of the future.
MEMS generally vary in size from one micrometer (one millionth of a meter) to one millimeter (one thousandth of a meter). At this level of size scale, the constructs of classical physics are not always true. Due to the large surface area in relation to the volume of MEMS, surface effects such as electrostatics and viscosity dominate volume effects such as inertia or thermal mass. Therefore, the design and characterization stage of the microsystems will be essential for the analysis and development of new applications (Layton, 2010).
MEMS can be classified into six different types:
Sensors: MEMS devices designed to measure changes in the environment. These microsystems include chemical, motion, inertial, thermal, and optical sensors.
Actuators: are a group of devices designed to provide a stimulus to other components or MEMS devices. In microsystems the actuators are operated electrostatically or thermally. RF MEMS: are a class of devices used to transmit radio frequency signals. Typical devices
include switches, capacitors, antennas, etc.
MOEMS (Micro-Opto-Electro-Mechanical Systems): are devices designed to direct, reflect, filter, and/or amplify light. These components include optical switches and reflectors.
Microfluidic MEMS: they are designed to interact and work with fluids. Devices such as micro-pumps and micro-valves are designed to handle small volumes of fluid.
Bio MEMS: devices that, like many MEMS for microfluids, are designed to specifically interact with biological samples. Devices such as these are made to interact with proteins, biological cells, medical reagents, etc. and can be used to provide medication or other medical tests on site (Layton, 2010).
1.3.1 MEMS resonators
As mentioned, there are several methods for measuring the concentration of gases. In the field of MEMS technology, it is possible to apply these techniques for the manufacture of sensors, however, in this work only the measurement of gas concentration by means of mass measurement is studied.
This type of measurement is normally performed by means of Quartz crystals, which can detect extremely low changes in mass, detection is performed by means of variation in the oscillation frequency. Applying the same property of a vibrating body, a resonant sensor will be manufactured which, by absorbing the gas molecules, will make a displacement in the natural frequency; the difference will lie in the geometry and materials to be used (Stephen Beeby, 2004).
1.3.1.1 Vibrations
It is a cyclic movement of a system with determined frequency, amplitude and direction, which depends of the geometry, mechanical properties and external forces acting in the system that occurs about an equilibrium point.
1.3.1.2 Simple Harmonic Motion
The simple harmonic movement is a periodic, vibratory movement in the absence of friction, produced by the action of a recuperating force that is directly proportional to the position, and which is described as a function of time by a trigonometric function (sine or cosine).
1.3.1.3 Undamped system
An undamped system is a theoretical system whose existence is not possible, because it is not characterized by mechanical nor frictional losses, but it allows to establish the basic equations of the movement of a harmonic system, which will be initiated to complete the system.
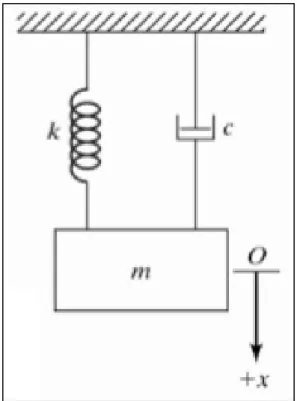
Figure 1.10 Undamped system diagram Adapted from Layton (2010)
Newton’s equation for the mass m where the force m𝑥 generated by the mass on the spring is equal and contrary to the force kx applied by the spring on the mass:
𝑚𝑥 + 𝑘𝑥 = 0 (1.1)
where x = 0 characterizes the initial point of the displacement.
𝑤 = 𝑘
𝑚 (𝑟𝑎𝑑/𝑠𝑒𝑐) (1.2)
Where 𝑤 represents the natural frequency.
The sinusoidal oscillation runs continuously, and the time interval to complete the cycle is called period:
𝜏 = 2𝜋
The reciprocal of the period is the natural frequency: 𝑓 = 1 𝜏 = 1 2𝜋 𝑘 𝑚 = 𝑤 2𝜋 (1.4) 1.3.1.4 Damped system
All real oscillators are subjected to some friction. Friction forces are dissipative and the work they do is transformed into heat that is dissipated outside the system. As a result, movement is damped, unless some external force maintains it. If the damping is greater than a certain critical value, the system does not oscillate, but returns to the equilibrium position. The speed with which this return occurs depends on the magnitude of the damping, and two different cases may occur: over damping and critically damped movement.
Figure 1.11 Damped system diagram Adapted from Layton (2010)
When the damping does not exceed this critical value, the system performs a slightly damped movement, like the simple harmonic movement, but with an amplitude that decreases exponentially over time.
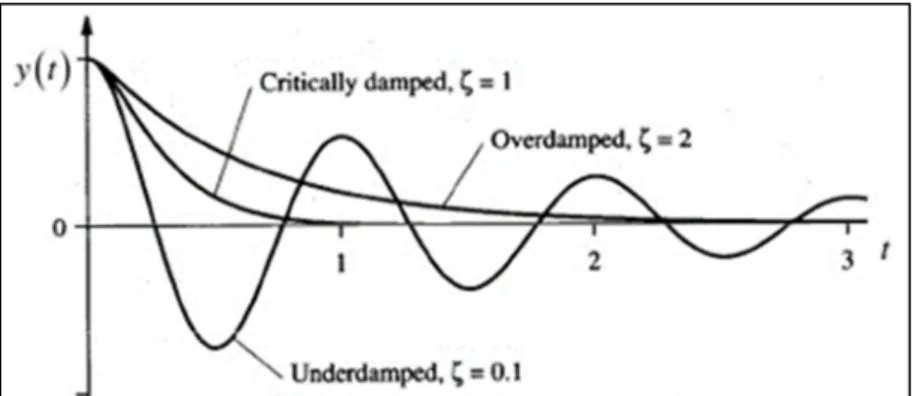
Figure 1.12 Trace of system with different level of damping Adapted from Mahajan (2006)
The differential equation of motion of mass m for the undamped system is:
𝑚𝑥 + 𝑐𝑥 + 𝑘𝑥 = 0 (1.5)
The critical damping coefficient 𝑐 is defined as:
𝑐 = 2√𝑘𝑚 = 2𝑚𝑤 (1.6)
The ratio 𝜁 is defined as the fraction of critical damping:
𝜁 = 𝑐 𝑐 (1.7)
The damped natural frequency is related to the undamped natural frequency by the equation:
1.3.1.5 Forced vibration damped system
Unlike the free damped system, the forced vibration system has an external force that excites the system at a specific frequency as well as a defined amplitude. When this frequency is equal to the value of the system's natural frequency, the amplitude of the vibrating element will peak, and is considered the most efficient value in the system.
This frequency is usually avoided in engineering as it puts at risk the integrity of the structures, however, in this case it requires the highest efficiency and sensitivity of the system, so it is constantly sought to obtain such value.
1.3.1.6 Resonance
Resonance is the characteristic of all bodies to vibrate at a specific frequency given its physical characteristics, this value is also known as natural frequency, and will be the key point of analysis of this system.
Figure 1.13 Amplitude of resonance by damping Adapted from Mahajan (2006)
1.3.1.7 Q Factor
The Q factor, also called the quality factor or selectivity factor, is a parameter that measures the ratio between the reactive energy it stores and the energy it dissipates over a complete signal cycle. A high Q factor indicates a low rate of energy loss relative to the energy stored by the resonator.
For the estimation of the Q value the properties of the system must be known, however, it can become very complex, so a technique known as -3 dB bandwidth method is applied, which, based on the amplitude curve and the resonant frequency, allows us to obtain the Q factor easily, as shown below:
𝑄 =𝐹 Δ𝑓 → ∆𝑓 = 0.707 ∗ 𝑓 (1.9) 𝑄 = √𝑘𝑚 𝑐 (1.10)
Figure 1.14 Q factor diagram Adapted from Mahajan (2006)
Damping in a system can be defined by noting the maximum response. This is defined by the Q-factor sometimes and defined with respect to mechanical vibration as:
𝑄 =1 2 𝜁
(1.11)
The damping is also indicated by the width of the resultant curve in the resonance frequency 𝑤 defined by: Δ𝑤 𝑤 = 1 𝑄 = 2𝜁 (1.12)
1.3.2 MEMS mass sensing for gas concentration measurement
As discussed at the beginning of this paper, it is possible to detect gas concentration by means of various techniques, however, all of them have a limitation mainly in the cost-dimensions-sensitivity relationship.
To try to provide a solution to this situation, mass sensors are available as an option by measuring the resonant frequency of a structure, which by means of a film of absorbent material will be able to capture the gas in the environment and measure its concentration.
1.3.2.1 Principle of Operation
As can be concluded from the previous module where the relationship between the natural frequency of a mechanical system, the mass and the damping coefficient is established, it is possible to define that the greater the mass, the lower the resonance frequency will tend to decrease.
By applying this principle, it is possible to create a resonant system which, by absorbing the target gas molecules, will cause an increase in the mass of the resonant body and since its damping coefficient will not vary, the resonant frequency will suffer a decrease proportional to the amount of the absorbed mass, this effect can be seen in the following figure.
Figure 1.15 Frequency deviation diagram Adapted from MIT (2016)
The relationship between the aggregate mass and the resonance frequency offset will depend on the dimensions, geometries and materials of the resonators. This topic has been extensively studied to obtain the best possible result.
1.3.2.2 Geometries and resonant modes
The resonators made by MEMS technology can be manufactured with different geometries, materials and manufacturing processes. The possible geometries of these resonators have been a subject of study for several decades, given that the efficiency of the resonator, as well as the sensitivity that will be obtained, is directly related to the dimensions and shape of the resonant system.
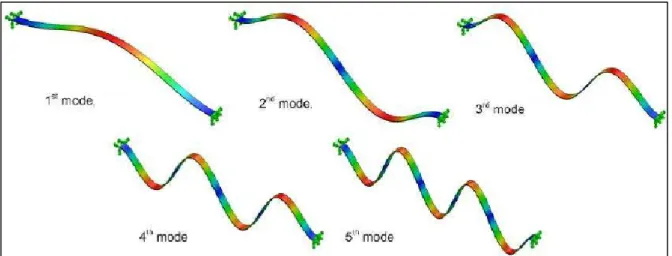
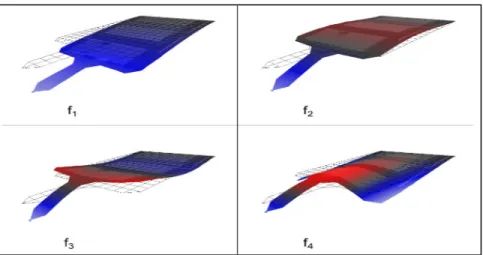
One of the properties of resonators are the modes to which they vibrate, this depends on the mechanical properties of the system and the frequency to which it is subjected. The most
common method to use in gas concentration sensors is mode 1, where the lowest resonance frequency is used, this is because it is the simplest to measure and because the application is sought to be as stable as possible (Stephen Beeby, 2004).
Figure 1.16 Resonant modes of MEMS bridge Adapted from Zaman et al. (2014)
As mentioned above, there is a possibility of creating a resonant system based on any desired geometry, each one of them presenting its advantages, which will depend on the mechanical properties already mentioned.
The resonators that have been widely used are based on beams, and these can be either with a fixed cantilever end, with both fixed bridge ends, among others. On the other hand, plates or discs held by small arms with low mechanical resistance have been used, reducing the intervention in their frequency of oscillation.
An important factor that has defined the type of geometry is the manufacturing processes, which have limited the ability to create complex geometries, this is due to the dimensions and tolerances existing in these systems, which have forced to create standardized manufacturing systems to obtain considerable repeatability (R. Abdolvand, B. Bahreyni, J. E. Y. Lee, & F. Nabki, 2016).
1.3.2.3 Resonator Geometries for mass sensing
Multiple geometry options are potentially applicable as sensors, however, in order to have a gas sensor it is necessary to have a high sensitivity, this will allow to obtain a detectable and low noise response with the addition of a minimum amount of mass.
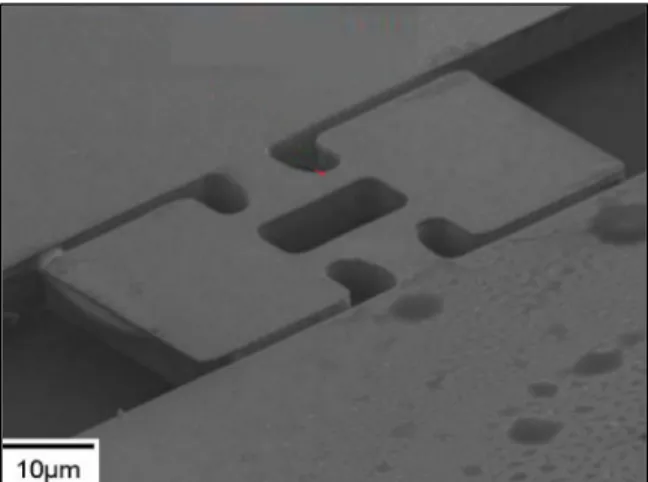
One of the most commonly used geometries is the fixed beam at one end, also known as a cantilever. This structure offers great sensitivity due to the amplitude of its resonant frequency and its alteration with increasing mass.
Figure 1.17 Cantilever micro-resonator Adapted from R. Abdolvand et al. (2016)
Another commonly used structure is a beam but attached at both ends known as a bridge. This structure has less sensitivity; however, it also shows greater stability and noise reduction.
Figure 1.18 Bridge micro-resonator Adapted from R. Abdolvand et al. (2016)
This type of structure tends to have the highest sensitivity to a lower absorbed mass, which makes it the best choice for this type of sensor.
Other not so common structures are free-free beam resonators, which have a greater freedom of movement, but their stability and sensitivity do not give them a competitive advantage among other geometries, in addition to having a much higher noise level than other structures.
Figure 1.19 Free-Free beam micro-resonator Adapted from Hajjam et Pourkamali (2012)
The plates or discs have been analyzed; however, they have not shown an advantage to the beams despite having a larger area and greater capacity to place a larger volume of absorption film.
Figure 1.20 Disc micro-resonator Adapted from Konno et al. (2011)
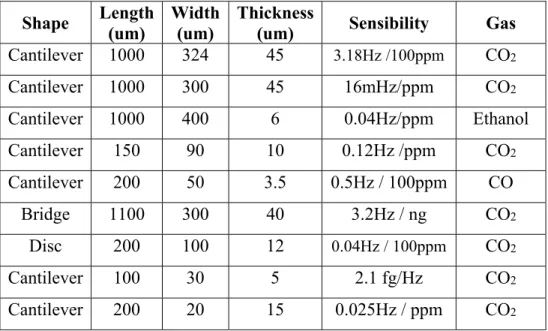
These are the sensors that have been most documented for airborne gas concentration measurement systems under the principle of absorption of target gas molecules. Among the most commonly used are the cantilever type, below you can find a comparison of the documented as well as their characteristics.
Table 1.2 Main published micro-resonators for gas sensing Adapted from Fanget et al. (2011)
Shape Length (um) Width (um) Thickness (um) Sensibility Gas
Cantilever 1000 324 45 3.18Hz /100ppm CO2 Cantilever 1000 300 45 16mHz/ppm CO2 Cantilever 1000 400 6 0.04Hz/ppm Ethanol Cantilever 150 90 10 0.12Hz /ppm CO2 Cantilever 200 50 3.5 0.5Hz / 100ppm CO Bridge 1100 300 40 3.2Hz / ng CO2 Disc 200 100 12 0.04Hz / 100ppm CO2 Cantilever 100 30 5 2.1 fg/Hz CO2 Cantilever 200 20 15 0.025Hz / ppm CO2
The table above shows some of the main gas sensors that apply the focused technique to this project. It can be concluded that most of the sensors use cantilever geometries due to the advantages mentioned above.
Another important factor to define is the means of action for these resonators, i.e. as mentioned above a system that operates in resonance, operates under an external force at a specific amplitude and frequency.
1.3.2.4 Actuation methods
For the excitation of the resonators, different methods can be used from piezoelectric effect, electrostatic attraction, heat expansion or magnetic actuation. In the case of the magnetic
actuation, there are many inconvenients in the use of this technique, like the size, the power, the interference with other elements inside the chip, etc.
Figure 1.21 Piezoelectric actuation in resonator
Adapted from Fowler, Bulut Coskun, et Reza Moheimani (2017)
One of the most commonly used systems for excitation of resonators is shown in the figure above: piezoelectric actuators, which allow impulse in both directions, are easily adaptable to the geometry of the resonator; the potential and current used are considerably low, which gives it a great advantage over other systems (Fowler et al., 2017; Mahdavi, Mehdizadeh, & Pourkamali, 2018).
Figure 1.22 Electrostatic cantilever Adapted from Han et al. (2018)
The figure above shows one of the most commonly used systems for excitation of resonators: the piezoelectric actuators, which allow impulse in both directions, are easily adaptable to the geometry of the resonator; the potential and current used are considerably low, which gives it a great advantage over other systems (R. Abdolvand et al., 2016; Wood, Svilicic, Mastropaolo, & Cheung, 2016).
Both the activation by means of piezoelectric actuators and electrostatic charges are devices that, in addition to generating the impulse for the resonator, provide feedback for the control of the exciter circuit, which facilitates the integration of the control system with the resonators (Stephen Beeby, 2004).
Figure 1.23 Electro-thermal micro-resonator Adapted from (Han et al., 2018)
One method of excitation with a different principle is that of thermo-expanding resonators, which use the flow of current in a conductor that tends to increase its temperature, expanding and generating a displacement. It is a very efficient and widely used system, however, it has the great disadvantage of the current consumption, the precision that the control system must have to avoid variations in the vibrations by a variation of the expansion factor between cycles. On the other hand, there are temperature sensitive coatings, which can be affected by the resonator temperature (Han et al., 2018).
Table 1.3 Excitation methods in resonators Adapted from Fanget et al. (2011)
Shape Length
(um)
Width (um)
Thickness
(um) Sensibility Gas Excitation
Cantilever 1000 324 45 3.18Hz/100ppm CO2 Electrostatic
Cantilever 1000 300 45 16mHz/ppm CO2 Electrostatic
Cantilever 1000 400 6 0.04Hz/ppm Ethanol Piezoelectric Cantilever 150 90 10 0.12Hz /ppm CO2 Piezoelectric Cantilever 200 50 3,5 0.5Hz / 100ppm CO Piezoelectric Bridge 1100 300 40 3.2Hz / ng CO2 Piezoelectric Semi-Disc 200 100 12 0.04Hz/100ppm CO2 Thermal Cantilever 100 30 5 2.1 fg/Hz CO2 Piezoelectric Cantilever 200 20 15 0.025Hz / ppm CO2 Piezoelectric
The table above compares the same resonators that have been analyzed, and the distribution between piezoelectric and electrostatic systems are the most used due to their simplicity, low current consumption and reliability.
1.3.2.5 Materials used in resonators
It would be possible to use any type of material used for traditional mechanics to manufacture the resonators from the operational point of view, however, the manufacturing processes and the compatibility of the materials currently used by the CMO’s manufacturing processes have limited to a few options.
Polysilicon is the most commonly used material in these resonators, since its mechanical properties are exceptional and very efficient in micro-mechanical systems, the coefficients of thermal expansion are low, which gives it an advantage in processes that require stability at various temperatures. The electrical properties of the doped material give it good conductivity
values, which has made it the most widely used option for this type of system (R. Abdolvand et al., 2016; Gargiulo, Pepe, & Caputo, 2014).
Despite these qualities, several models have been developed using different materials such as Anodic alumina, ZrO2/Y2O3, Borosilicate glass, among others. These materials are promising in processes that require a temperature close to 1000ºC, or processes with very low electrical resistance, processes in which polysilicon can hardly meet the requirements (Vasiliev et al., 2016).
1.3.2.6 MEMS resonators fabrication process
The fabrication of micro-resonators presents a technological challenge and very advanced methodologies due to the small dimensions and tolerances that these devices require to obtain the necessary resolution, repeatability and quality.
There are several standardized microfabrication processes that have been developed, which allow to create devices of great quality and with good repeatability. This is important when micro-devices are fabricated in order to ensure batch fabrication and uniform performance metrics between devices.
As previously mentioned, one of the most common methods of excitation of the micro-resonators is by means of a piezoelectric layer which will allow to generate the mechanical excitation to the micro-resonator but at the same time it will generate the necessary current to use it as a sensing element. A commercial process for manufacturing piezoelectric micro-resonators is PiezoMUMPS, which is offered by the company MEMSCAP.
Another type of micro-resonator that is common in this type of application is the electrostatic type, which basically uses the attraction force between two parallel plates to create the mechanical excitation to the device. This requires an DC voltage to be applied between the plates to accumulate charge onto them. This allows, in turn, for a current to be generated as the
micro-resonator’s capacitance varies during its motion, and allows for it to operate as a sensing element. These types of micro-resonators can be manufactured using the commercial process known as PolyMUMPS offered too by MEMSCAP, and also by the PiezoMUMPs process.
These two types of micro-resonators will be analysed in more detail to consider their advantages in the context of this thesis.
Electrostatic Micro-resonators
The electrostatic micro-resonators use the principle of attraction between two plates in which there is an electrical potential. The force depends on the area, distance between plates and bias electrical potential. This type of micro-resonator uses a fixed plate and another movable plate separated by a gap. If the excitation signal supplied to the micro-resonator has a sinusoidal shape the micro-resonator will vibrate at the same frequency increasing its amplitude as it approaches its resonance frequency. A typical diagram of a micro-resonator is shown in figure 1.24.
Figure 1.24 Electrostatic MEMS resonator operation Taken from Pashapur, Pesteii, Rezazadeh, et kouravand (2009)
Figure 1.24 shows an example of a cantilever-type micro-resonator, where the end of the beam has a greater attraction due to the fact that as it deforms, the gap between the electrodes decreases and the attraction force is greater. The distance between the plates is a critical factor for the operation of these micro-resonators, which will depend on the micro-manufacturing process.
Electrostatic MEMS resonators fabrication process using PolyMUMPs
PolyMUMPs is a three-layer polysilicon surface micromachining process. The process starts with n-type silicon wafers. The surface of the wafer is doped with phosphorus using a phosphate glass sacrifice layer (PSG) as the doping source. Then, after removal of the PSG film, a 600 nm low-voltage silicon nitride layer is deposited as an insulation layer. In figure 1.25 the lateral cut of the layers used in the PolyMUMPS are shown.
Figure 1.25 PolyMUMPS lateral cut representation Taken from (MEMSCAP, 2011).
A 500 nm LPCVD polysilicon film is deposited and modelled by photolithography. After creating the photoresist pattern, it is etched into a plasma system. A sacrificial layer of 2.0 µm phosphosilicate glass (PSG) is then deposited by LPCVD and annealed at 1050°C for 1 hour in an argon atmosphere.
The sacrificial layer is patterned with the dimples mask and are transferred to the PSG sacrifice layer using an RIE (Reactive Ion Etch) system. The Poly0 layer is patterned using a RIE. Subsequently, the first structural polysilicon layer (Poly1) is deposited with a thickness of 2.0 µm. A thin layer (200 nm) of PSG is deposited on the polysilicon and the wafer is annealed at 1050°C for 1 hour. The polysilicon is annealed with the phosphorus of the PSG layers.
The PSG layer is etched to produce a hard mask for subsequent polysilicon etching. After etching the polysilicon, the photoresist is removed and the remaining hard oxide mask is removed by the RIE. After etching the first layer of polysilicon, a second layer of sacrificial PSG is deposited with a 750 nm thickness.
The second structural layer of polysilicon (Poly2) is deposited and patterned by RIE, having a thickness of 1.5 µm. The wafer is then annealed for one hour at 1050 °C in order to dope the polysilicon and render it conductive.
The last layer deposited in the PolyMUMPs process is a 0.5 μm metal (gold) layer. The metal is patterned via liftoff. Finally the sacrificial layers are removed to release the structures using a wet HF etch.
Table 1.4 PolyMUMPS fabrication parameters Taken from (MEMSCAP, 2011).
The manufacturing process offered in the PolyMUMPS methodology has multiple limitations due to geometric tolerances, thickness of each layer and order of assembly. This is a critical factor and one of the limitations of this type of technology. Table 1.4 shows the manufacturing parameters and critical dimensions (CD) of each layer that make up the electrostatic devices manufactured with this technology.
Piezoelectric MEMS Resonators
As mentioned previously, piezoelectric micro-resonators have a thin layer of piezoelectric material deposited onto the surface which allows it to function as an excitation method but can also be used as a sensing element. The simplicity of its manufacturing process and lack of requirement of a bias DC voltage makes it a common resonator type.
Figure 1.26 Piezoelectric MEMS resonator operation Taken from Romani, Sangiorgi, Tartagni, et Paganelli (2011)
Figure 1.26 shows a scheme of a cantilever type resonator that when excited by a sinusoidal voltage, exhibits the expansion and compression of the piezoelectric material to generate a deformation of the resonator structure that depends on the resonant properties of the device.
Piezoelectric materials used in MEMS resonators
The piezoelectric effect describes the relationship between a mechanical voltage and an electrical voltage in solids. It is the ability of certain materials to produce an electrical charge in response to an applied mechanical stress. The reverse effect can also be observed, in which piezoelectric materials are deformed by the application of an electrical potential.
In the direct piezoelectric effect, the compression and expansion of a material generates opposite electrical charges on the respective faces of the sample. In the reverse piezoelectric effect, the application of a voltage to a piezoelectric material produces a certain amount of deformation.
Piezoceramic materials, such as aluminum nitride (AlN), have the property of being rigid and ductile, so they are good candidates for use as actuators, due to their high modulus of elasticity, which facilitates mechanical coupling to the structure. On the other hand, piezopolymers, such as PTFE, are better suited to act as sensors because they add a minimum rigidity to the structure