Université de Montréal
Origine des projections sensorimotrices dans des
sous-régions du cortex moteur primaire chez le singe capucin.
Par : Melvin Dea
Département de Neurosciences Faculté de Médecine
Mémoire présenté à la Faculté Médecine
en vue de l’obtention du grade de Maître ès Sciences (M.Sc.) en Sciences Neurologiques
Avril, 2015
Résumé
Certaines études ont démontrés que les connexions entre l’aire prémotrice ventrale (PMv) et la région de la main du cortex moteur primaire (M1) sont distribuées non-uniformément, ciblant des sous-régions spécifiques dans M1. Dans la présente étude nous avons voulu développer ces résultats en étudiant la distribution au sein de M1 des projections corticales issues de PMv, l’aire prémotrice dorsale (PMd), l’aire motrice supplémentaire (SMA) et les aires pariétales 1, 2 et 5. Pour se faire, nous avons combiné des approches électrophysiologiques et anatomiques chez trois singes naïfs du Nouveau Monde (Cebus
apella) pour examiner l’organisation et la spécificité topographique des projections corticales
dans M1. Nos résultats indiquent que quatre sous-régions à l’intérieur de la région dédiée à la main reçoivent des inputs prédominants de différentes aires sensorimotrices. Ces résultats suggèrent que des sous-régions de M1 puissent avoir des fonctions spécifiques pour le contrôle moteur de la main et des doigts.
Mots-clés : Cebus apella, singe, cortex moteur primaire, neuroanatomie, connections, inputs, ipsilatéral, sensorimoteur, réseau, main.
Abstract
Previous studies have provided evidence that the ventral premotor cortex (PMv) is not uniformly interconnected with the hand area of the primary motor cortex (M1) but instead, only has connections with specific sub-regions. In the present study, we wanted to expand on these results and investigate the distribution of cortical inputs originating from PMv, the dorsal premotor cortex (PMd), supplementary motor area (SMA), and parietal areas 1, 2 and 5within the hand area of M1. To do so, we combined electrophysiological and anatomical approaches in three naïve New World monkeys (Cebus apella) and examined the organisation and topographic specificity of ipsilateral cortical inputs to M1. Our results indicate that four sub-regions within the hand area of M1 receive predominant cortical inputs from different sensorimotor areas. These results suggest that M1 sub-regions are parts of different cortical networks that may serve specific functions for the control of hand and digit movements.
Keywords: Cebus apella, monkey, primary motor cortex, neuroanatomy, connections, inputs, ipsilateral, sensorimotor, network, hand area.
Table des matières
Résumé ... i
Abstract ... ii
Table des matières ... iii
Liste des tableaux ... v
Liste des figures ... vi
Liste des sigles et abréviations ... vii
Remerciements ... ix
Chapitre I. Introduction générale ... 11
Le réseau sensorimoteur chez le primate ... 17
Connexions corticocorticales générales de M1 ... 19
Division de M1 en sous-régions ... 21
Cytoarchitecture de sous-régions de M1 ... 21
Physiologie de sous-régions de M1 ... 22
Connectivité de sous-régions de M1 ... 22
Patron de connexions spécifique de M1 et PMv ... 24
Récapitulatif ... 25
Chapitre II. Manuscrit pour soumission ... 27
Abstract ... 29
Introduction ... 30
Materials and methods ... 33
Surgical procedures ... 33
Electrophysiological motor mapping ... 34
Electrophysiological somatosensory mapping ... 35
Neuronal tracer injections ... 36
Histological procedures ... 37
Results ... 41
Hand representations in primary motor and premotor cortex of cebus monkeys ... 41
Hand representations in the parietal cortex ... 43
Distribution of labelled cell bodies in the ipsilateral hemisphere ... 44
Discussion ... 47
Motor and somatosensory areas in the capuchin monkey ... 47
Pattern of projections from somatosensory areas to M1 ... 48
Pattern of projections from premotor areas to M1 ... 50
Support for subdivisions within the M1 hand area ... 52
Acknowledgements ... 54
Figures and legends ... 55
Chapitre III. Discussion générale ... 66
Aires pariétales et connexions corticospinales ... 67
Aires prémotrices et connexions corticospinales ... 71
Études lésionnelles ... 74
Études d’inactivation ... 75
Directions futures ... 77
Conclusion générale ... 80
Liste des tableaux
Chapitre 2: Manuscrit pour soumission Table 1. Neuroanatomical tracers efficacy
Liste des figures
Chapitre 1 : Introduction générale
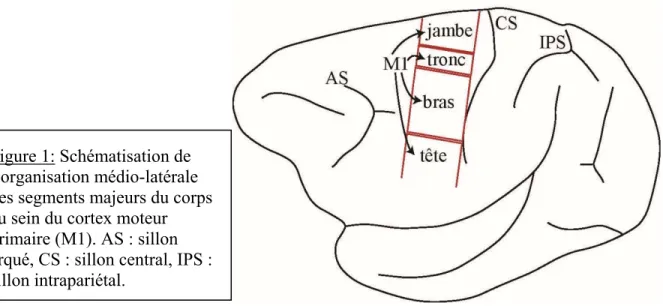
Figure 1 : Schématisation de l’organisation médio-latérale des segments majeurs du corps au sein du cortex moteur primaire (M1).
Figure 2 : Schématisation des aires corticales du réseau sensorimoteur à l’étude chez le singe capucin (Cebus apella).
Figure 3 : Schéma résumant la connectivité de la M1 avec d’autres aires corticales du réseau sensorimoteur chez le singe hibou
Chapitre 2: Manuscrit pour soumission Figure 1. Electrophysiological mapping.
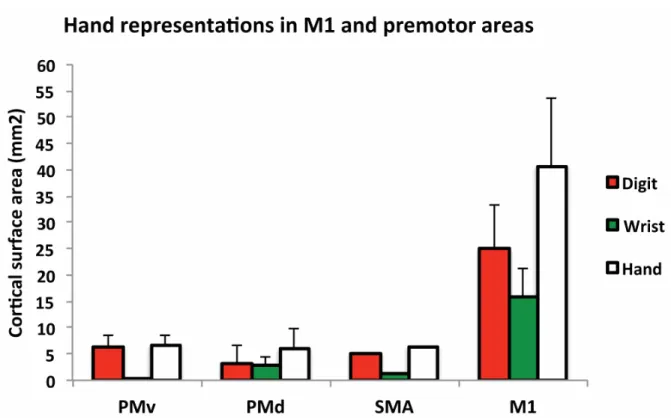
Figure 2. Cortical surface area of the hand representation in the primary (M1) and premotor areas.
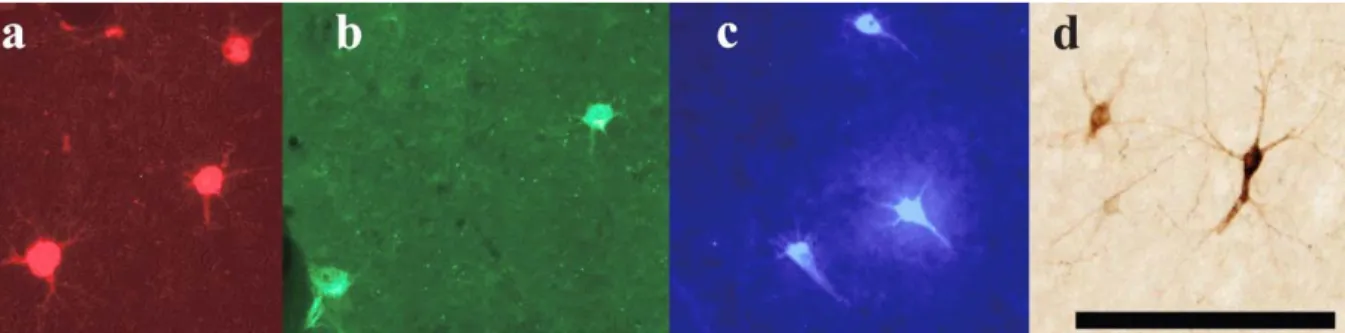
Figure 3. Photomicrographs of retrogradely labeled cells in the hemisphere ipsilateral to the injection of neuronal tracer.
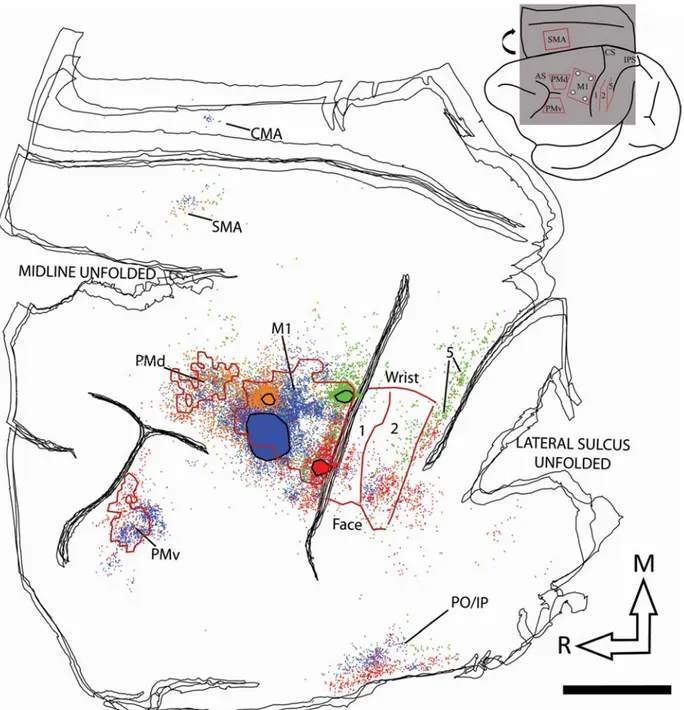
Figure 4: Reconstruction of the labelled cell bodies in CB-8.
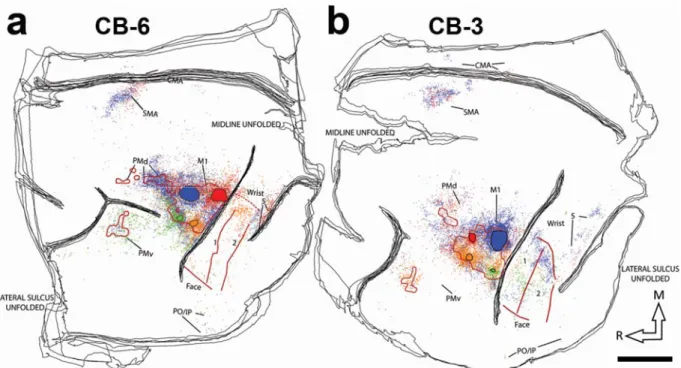
Figure 5: Reconstruction of the labelled cell bodies in CB-6 and CB-3. Figure 6: Proportion of labeled cell bodies in ipsilateral hemisphere.
Figure 7: Normalized strength of cortical projections to the M1’s hand area from the different areas of the ipsilateral hemisphere.
Chapitre 3: Discussion générale
Figure 1: Schéma résumant la connectivité de M1 avec d’autres aires corticales du réseau sensorimoteur chez le singe capucin (Cebus apella).
Liste des sigles et abréviations
CM : corticomotoneuronaleCMA : aire motrice cingulée CS : corticospinale
CST : faisceau corticospinal EMG : électromyographique
GABAA : récepteur de l’acide gamma-aminobutyrique de type A
ICMS : microstimulation intracorticale M1 : cortex moteur primaire
M1c : portion caudale du cortex moteur primaire M1r : portion rostrale du cortex moteur primaire PET : tomographie par émission de positrons PMd : aire prémotrice dorsale
PMv : aire prémotrice ventrale
PV : aire somatosensorielle pariétale ventrale S1 : aire somatosensorielle primaire
S2 : aire somatosensorielle secondaire SMA : aire motrice supplémentaire
SMAd : portion dorsale de l’aire motrice supplémentaire SMAm : portion médiale de l’aire motrice supplémentaire
Remerciements
Je tiens tout d’abord à remercier mon directeur de recherche, Numa Dancause, pour m’avoir accueilli dans son laboratoire et de m’avoir fait confiance avec un projet de maîtrise audacieux de neuroanatomie chez un modèle de primates. Merci à Stephan Quessy pour toute l’aide octroyée au cours de cette maîtrise. Je n’oublierai jamais la chance que j’ai eu d’y consacrer les dernières années en votre compagnie, tant pour les chirurgies overnight, les discussions lors des lunchs, des 5à7 au Vices et Versa, mais surtout pour votre passion et dévouement envers la recherche scientifique. Merci également à tous les autres membres du laboratoire pour tout votre appui et assistance à tous les niveaux, tant sur le plan scientifique que personnel.
Je tiens aussi à remercier les membres de mon comité de parrainage pour votre présence et l’attention que vous avez porté à mon projet, ainsi qu’aux membres de mon jury, d’avoir accepté d’évaluer mon mémoire de maîtrise.
Je tiens à remercier tous mes ami(e)s proches, ainsi qu’aux membres de mon équipe d’hockey, Des Piwis et des Hommes, pour votre soutien et vos encouragements. Merci de m’avoir aidé à décompresser, déstresser et faire le vide part moment.
Un merci tout particulier à Silvia Themelidis, ton amour et soutien inconditionnel face aux différentes étapes de mon cheminement de maîtrise m’ont été indispensable! Thank you
Finalement, un énorme merci à mes parents et mes sœurs sans qui rien de tout ça n’aurait pu se concrétiser. C’est grâce à votre appui et présence que je suis rendu jusqu’ici! Sans vous je n’y serais pas arrivé. Merci infiniment, je vous aime de tout cœur!
Chapitre I. Introduction générale
Les premiers travaux de stimulation du cortex moteur par électrodes de surfaces ont permis de mettre à jour une organisation distincte des différentes parties du corps et des mouvements, autant chez l’humain (Penfield and Boldrey, 1937) que chez le macaque (Woolsey et al., 1952). Les efférences du cortex moteur sont organisées de façon systématique avec un arrangement spatial médio-latéral des segments du corps, avec la représentation de la jambe en médial, puis suivent latéralement le tronc, le bras et la tête. Le cortex moteur primaire (M1) est donc organisé somatotopiquement, ayant différents territoires corticaux régissant les segments majeurs du corps.
Chaque segment majeur du corps, mentionné ci-dessus, semble également avoir un arrangement somatotopique médio-latéral qui lui est propre. Par exemple, au sein même du territoire réservé à la représentation générale du bras, on retrouve médialement l’épaule, puis se succèdent latéralement le coude, le poignet, l’auriculaire, l’annulaire, le majeur, l’index et le petit doigt (Penfield and Boldrey, 1937, Woolsey et al., 1952). Ces premiers travaux ont
Figure 1: Schématisation de l’organisation médio-latérale des segments majeurs du corps au sein du cortex moteur primaire (M1). AS : sillon arqué, CS : sillon central, IPS : sillon intrapariétal.
donc présenté une organisation fonctionnelle de M1 selon une somatotopie et une topographie bien précise. Par contre, ces études initiales ont suggéré que la représentation des outputs moteurs originaires du territoire destiné au bras de M1 présente des chevauchements importants entre des parties adjacentes du corps. Par exemple, Penfield et Boldrey ont noté entre autres des entremêlements au niveau des représentations du pouce et de l’auriculaire (Penfield and Boldrey, 1937). D’autres travaux utilisant des méthodes de stimulation de surface chez le macaque ont démontré une somatotopie à l’intérieur même du territoire dédié à la représentation de la jambe de ce singe de l’Ancien Monde (Chang et al., 1947). Dans ce cas-ci, chaque muscle entourant la cheville posséderait un seul point de représentation focal précis, tout en présentant un chevauchement avec les représentations des autres muscles entourant l’articulation de la cheville. Ainsi, en plus d’un arrangement somatotopique des segments majeurs du corps au sein de M1, il y existerait un second degré d’organisation somatotopique à l’intérieur même de chacun de ces territoires dédiés aux représentations générales du corps.
Plusieurs groupes de recherche se sont par la suite penchés sur la question de l’organisation fonctionnelle détaillée au sein même des territoires corticaux consacrés aux représentations générales du corps, plus particulièrement celle du bras. Ainsi, l’avènement de nouvelles techniques électrophysiologiques plus invasives, telles que la microstimulation intracorticale (ICMS), l’enregistrement de neurones isolés, de spike-triggered averaging ou encore de stimulus-triggered averaging, a permis d’observer avec une meilleure résolution l’organisation fine à l’intérieur des différents territoires de représentations majeures du corps dans M1, et ce chez plusieurs modèles de primates. Des travaux effectués chez le singe capucin ont d’abord démontré qu’il existait aussi une carte topographique de la représentation
M1 du bras de ce singe du Nouveau Monde (Asanuma and Rosen, 1972). Selon cette carte motrice, l’organisation corticale de chaque muscle entourant une articulation du bras posséderait un point de représentation focal précis avec un pourtour qui chevauche les représentations de muscles dont les fonctions se complémentent (Asanuma and Rosen, 1972), tel que retrouvé à l’intérieur de la représentation de la jambe du macaque (Chang et al., 1947). Ainsi, les muscles et mouvements liés à un même segment majeur du corps et ayant des outputs moteurs similaires seraient colocalisés dans M1, témoignant d’une somatotopie à l’intérieur même d’un territoire dédié à la représentation d’un segment majeur du corps, retrouvant donc une organisation fonctionnelle du cortex moteur ressemblant à ceux initialement présentés.
Par la suite, d’autres travaux s’attardant aux détails à l’intérieur même du territoire dédié à la représentation du bras chez le macaque permirent d’établir que la position de la représentation des doigts est située caudalement dans M1, dans le mur antérieur du sulcus central (Kwan et al., 1978, Sessle and Wiesendanger, 1982). Cette aire destinée aux mouvements des doigts est ensuite partiellement bordée par une succession d’aires ayant chacune la forme d’un « U » celles-ci dédiées, dans l’ordre, à la représentation du poignet, du coude et de l’épaule (Kwan et al., 1978, Sessle and Wiesendanger, 1982). Ainsi, la représentation distale du bras de M1 est située au centre de représentations successivement de plus en plus proximales. Aussi, l’aire corticale destinée à la représentation d’une articulation du bras présente un chevauchement considérable avec celle d’une autre articulation contiguë du bras, tandis que les zones représentant deux articulations non contiguës du corps, telles que les doigts et les lèvres par exemple, se chevauchent minimalement ou pas du tout (Kwan et al.,
M1 ne semble pas présenter une organisation fonctionnelle somatotopique médio-latérale stricte, ainsi que le proposaient précédemment les travaux de quelques groupes pionniers. Malgré cela, ceux-ci suggèrent toujours une ségrégation des mouvements et muscles proximaux et distaux.
Par la suite, des travaux extensifs de cartographie par ICMS chez le singe-hibou, le singe-écureuil et le macaque ont testé davantage le concept d’organisation de M1 et révélé encore plus sa complexité (Gould et al., 1986, Huntley and Jones, 1991, Donoghue et al., 1992). Les cartes des mouvements évoqués par ICMS ont de nouveau démontré une somatotopie globale des segments majeurs du corps dans M1 similaire aux travaux précédents, avec une organisation médio-latérale successive des territoires consacrés aux mouvements des jambes, du tronc, des bras et de la tête (Gould et al., 1986). Par contre, l’organisation fine à l’intérieur de chacun de ces territoires réservés à la représentation générale d’une section du corps ne semble suivre aucun plan d’arrangement topographique précis et constant (Gould et al., 1986, Huntley and Jones, 1991, Donoghue et al., 1992). De plus, cette organisation locale présente des variations considérables en ce qui a trait aux détails fins de chacune de ces représentations entre les sujets (Gould et al., 1986, Huntley and Jones, 1991, Donoghue et al., 1992). L’organisation au sein du territoire dédié à la représentation de la main de M1 est alors présentée comme une mosaïque de représentations de mouvements n’ayant pas de topographie précise (Gould et al., 1986, Huntley and Jones, 1991, Donoghue et al., 1992). Le territoire dédié à la représentation du bras de M1 serait donc dépourvu d’une organisation somatotopique médio-latérale intrinsèque. Selon ce modèle, les zones dédiées aux représentations de mouvements distaux et proximaux se mêlent l’une à l’autre. De plus, un
représentation du bras de M1 et les mouvements d’articulations non contiguës peuvent être obtenus de points de stimulation voisins (Gould et al., 1986, Huntley and Jones, 1991, Donoghue et al., 1992). L’arrangement en mosaïque et l’entremêlement des différentes représentations de muscles au niveau de la représentation du bras de M1 permettraient de placer ceux-ci à proximité l’un de l’autre pour la régulation et la coordination de mouvements mettant à contribution plusieurs articulations, ou encore pour permettre un réarrangement entre les groupes fonctionnels lors de l’apprentissage d’une nouvelle aptitude (Huntley and Jones, 1991, Donoghue et al., 1992, Schieber, 2001).
D’autres travaux chez le macaque rhésus notent aussi l’absence d’une organisation somatotopique au sein de la représentation du bras de M1. L’enregistrement de neurones isolés, alors que l’animal effectue une série de mouvements isolés, soit d’un doigt, soit du poignet, a permis de démontrer que la majorité des neurones isolés déchargeaient en lien avec les mouvements instruits de deux séries ou plus (Schieber and Hibbard, 1993). De ce fait, les populations neuronales consacrées à un mouvement isolé du poignet ou d’un doigt se chevauchaient grandement et apparaissaient coextensives. Donc les neurones générant une activité suite à un mouvement instruit précis étaient distribués dans le territoire de la représentation de la main de M1, démontrant une grande distribution spatiale de changements d’activité neuronale lors de l’exécution des divers mouvements requis (Schieber and Hibbard, 1993). Ainsi, le mouvement d’un doigt dépendrait d’une population neuronale distribuée dans le segment consacré à la représentation de la main dans M1 et non d’une population neuronale organisée somatotopiquement, rejoignant le concept d’un arrangement détaillé en mosaïque à l’intérieur de la représentation du bras de M1.
D’autres travaux chez le singe-écureuil, réalisés au moyen de la technique du
stimulus-triggered averaging, ont aussi démontré une organisation non somatotopique au sein même de
la représentation du bras de M1. Il s’agit d’un arrangement où un noyau de représentations distales (poignet, main intrinsèque et doigts) au niveau du mur antérieur du sulcus central est entouré partiellement d’une zone de représentations proximales (coude et épaule) en forme de fer à cheval (Park et al., 2001, Park et al., 2004). Ce qui différencie ces travaux-ci de ceux relatant une organisation similaire en forme de croissant mentionnés plus haut (Kwan et al., 1978, Sessle and Wiesendanger, 1982) est l’identification d’une zone de transition relativement large où s’entremêlent la représentation proximale en forme de fer à cheval et le noyau de représentations distales acculé au sulcus central qu’elle encercle partiellement (Park et al., 2001, Park et al., 2004). Ainsi cette région corticale de M1, où se côtoient représentation proximale et distale du bras, pourrait permettre de solliciter l’action de groupes fonctionnels de muscles qui se retrouvent près les uns des l’autres et d’offrir un substrat potentiel pour la régulation de synergies musculaires lors de la coordination de mouvements impliquant plusieurs articulations (Park et al., 2001, Park et al., 2004) ou, tel que mentionné précédemment, pour permettre un réarrangement entre les groupes fonctionnels lors de l’apprentissage d’une nouvelle aptitude (Donoghue et al., 1992).
De ces travaux étudiant l’organisation fonctionnelle de M1, il ressort donc que les segments majeurs du corps de M1 sont organisés somatotopiquement de façon générale avec un arrangement spatial médio-latéral de ceux-ci, avec la représentation de la jambe en médial, puis latéralement le tronc, le bras et la tête, et ce grâce à différentes études mentionnées dans cette section (Kwan et al., 1978, Sessle and Wiesendanger, 1982, Gould et al., 1986, Huntley
qu’à l’intérieur même de l’un de ces segments, tel que la représentation du bras de M1, il ne semble pas y avoir d’arrangement somatotopique qui prévale. Il s’agit plutôt d’une zone où se côtoient les représentations de divers muscles permettant une plus grande interaction entre différents muscles du bras, de la main et des doigts. Cette flexibilité du cortex moteur et ses représentations multiples d’un seul et même muscle laissent à penser que celles-ci interagiraient peut-être différemment avec d’autres aires corticales. Voyons donc comment cette organisation fonctionnelle de M1 se situe dans le réseau sensorimoteur de primates et d’humains.
Le réseau sensorimoteur chez le primate
Débutons par un survol des principales aires corticales qui interagissent avec M1, soit des aires prémotrices et quelques aires du cortex pariétal. Une aire prémotrice est par définition une zone corticale dans le lobe frontal disposant d’un accès direct à M1 ainsi qu’à la moelle épinière, et qui possède une représentation distale de la musculature du bras distincte de celle de M1 (Dum and Strick, 1991, 2002, Chouinard and Paus, 2006). Ainsi les aires prémotrices pourraient avoir une influence directe sur la planification de mouvements des bras, mais aussi une influence indirecte en passant par M1. Parmi ces aires du cortex frontal, on retrouve l’aire prémotrice dorsale (PMd), l’aire prémotrice ventrale (PMv), l’aire motrice supplémentaire (SMA) et l’aire motrice cingulée (CMA).
L’aire somatosensorielle primaire (S1), qui se retrouve dans la portion antérieure du cortex pariétal, est pour sa part subdivisée en quatre bandes parallèles médio-latérales correspondant en fait à des subdivisions au sein de celle-ci (Kaas, 2004). Dans le cortex somatosensoriel, les aires 3a, 3b, 1 et 2 qui composent S1 comportent chacune une
représentation de récepteurs sensoriels des segments majeurs contralatéraux du corps. Chez le macaque, l’aire 3a représente principalement les informations des propriocepteurs du corps, les aires 3b et 1 reçoivent majoritairement des informations issues des récepteurs cutanés, tandis que l’aire 2 reçoit un mélange des deux types de récepteurs sensoriels mentionnés (Kaas, 2004). Suivant caudalement ces aires somatosensorielles, on retrouve entre autres l’aire 5 et l’aire 7b. Ces aires du cortex pariétal postérieur, comme la majorité de celles qui s’y trouvent, sont solicitées dans la production d’habilitées manuelles complexes par l’intégration d’informations sensorielles à celles-ci (Padberg et al., 2005, Padberg et al., 2010). Plus précisément, l’aire 5 serait solicitée lors de mouvements d’atteinte et de préhension qui sont coordonnés et visuellement guidés (Padberg et al., 2010).
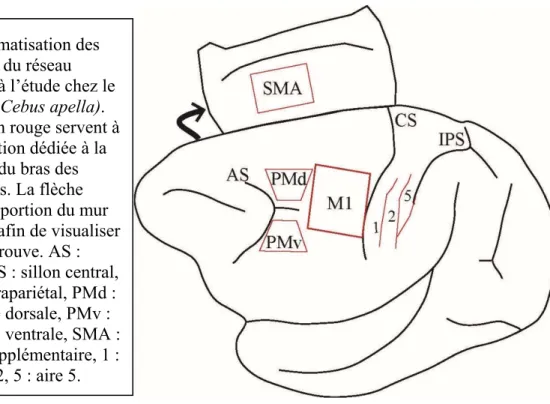
Figure 2: Schématisation des aires corticales du réseau sensorimoteur à l’étude chez le singe capucin (Cebus apella). Les contours en rouge servent à entourer la portion dédiée à la représentation du bras des différentes aires. La flèche représente une portion du mur médian déplié afin de visualiser SMA, qui s’y trouve. AS : sillon arqué, CS : sillon central, IPS : sillon intrapariétal, PMd : aire prémotrice dorsale, PMv : aire prémotrice ventrale, SMA : aire motrice supplémentaire, 1 : aire 1, 2 : aire 2, 5 : aire 5.
Connexions corticocorticales générales de M1
En plus de l’évolution des techniques électrophysiologiques qui permirent de mieux comprendre M1, considérons maintenant les techniques neuroanatomiques. Depuis les travaux de Brodmann , qui établirent les fondements des divisons cytoarchitecturales du cortex (Brodmann, 1909, Brodmann and Garey, 2007), l’utilisation de diverses techniques de marquage et l’évolution des traceurs neuronaux auront mis en évidence les connexions des différents territoires dédiés aux segments majeurs du corps de M1, autant entre eux qu’avec d’autres régions corticales. Parmi ces régions corticales connectées avec M1, on retrouve des aires prémotrices, des aires somatosensorielles et quelques-unes du cortex pariétal postérieur.
Suite à l’injection de divers traceurs neuronaux, les connexions corticocorticales intrinsèques de M1 qui sont révélées sont principalement restreintes à la représentation du segment majeur du corps qui fut injecté (Matsumura and Kubota, 1979, Godschalk et al., 1984, Huntley and Jones, 1991, Stepniewska et al., 1993). Chez le macaque par exemple, l’injection de la peroxydase de raifort à l’intérieur de la représentation distale du bras localisé par ICMS a mis en évidence des connexions antérogrades et rétrogrades dans toute la représentation du bras et une absence quasi totale de connexions avec les territoires consacrés aux autres représentations majeures du corps ( i.e. jambe, tête et tronc) (Huntley and Jones, 1991). Il y aurait donc un réseau de connexions corticocorticales interreliant toutes les représentations du bras de M1 entre-elles. Ainsi, une division somatotopique du corps a des projections sur l’étendue rostrocaudale de ladite représentation dans M1, ce qui indique une forte interaction au niveau de M1 entre sa portion rostrale (M1r) et caudale (M1c), tant au niveau du bras que de la jambe, par exemple (Stepniewska et al., 1993). De plus, l’utilisation
en évidence des connexions avec la même représentation majeure du corps dans divers autres aires corticales, que ce soit la région de la main et l’avant-bras (Matsumura and Kubota, 1979, Huntley and Jones, 1991, Stepniewska et al., 1993, Tokuno and Tanji, 1993, Tokuno et al., 1997, Stepniewska et al., 2006), du tronc (Stepniewska et al., 1993, 2006), de la tête (Stepniewska et al., 1993, Tokuno and Tanji, 1993, Tokuno et al., 1997, Stepniewska et al., 2006) ou les jambes (Stepniewska et al., 1993) qui sont injectés. Chez le macaque, par exemple, l’injection de deux traceurs fluorescents rétrogrades (Fast Blue et Diamidino Yellow) dans la représentation des doigts et de l’épaule de M1, respectivement, révèle des connexions réciproques réparties sur la totalité du territoire représentant le bras dans M1, retrouvant même des somas de neurones doublement marqués (Tokuno and Tanji, 1993). Ceci met à nouveau en lumière les connexions intrinsèques importantes au sein même du territoire dédié au bras de M1. De plus, ces deux traceurs furent observés dans la même représentation de plusieurs autres aires prémotrices, sensorielles et pariétales, ainsi que dans la représentation du segment majeur du corps de M1 où le site d’injection est retrouvé. Ceci révèle donc le caractère somatotopique des projections de la représentation du bras de M1 qui interagiraient préférentiellement avec la région dédiée au bras d’autres aires du réseau sensorimoteur. Ainsi, selon les résultats de plusieurs études chez des primates de l’Ancien Monde ou du Nouveau Monde, l’injection de traceurs neuronaux dans la représentation du bras de M1 révèle des connexions organisées somatotopiquement avec les aires prémotrices PMd, PMv et SMA, ainsi qu’avec les aires somatosensorielles 3a, 1, 2 et S2 (Jones et al., 1978, Leichnetz, 1986, Ghosh et al., 1987, Stepniewska et al., 1993, 2006). De faibles connexions sont aussi observées avec l'aire somatosensorielle 3b, le cortex postérieur pariétal et l’aire motrice cingulée (CMA) (Leichnetz, 1986, Stepniewska et al., 1993, 2006). De plus, chez le macaque,
les aires 5 et 7b envoient des projections à M1 (Jones et al., 1978, Sessle and Wiesendanger, 1982, Godschalk et al., 1984, Leichnetz, 1986, Tokuno and Tanji, 1993, Tokuno et al., 1997, Rizzolatti et al., 1998). La connectivité de M1 sera abordée plus en détail à la section qui suit.
Division de M1 en sous-régions
Avec l’évolution des techniques électrophysiologiques et neuroanatomiques, la compréhension que nous avions de M1 a évolué. Ainsi, M1 chez les primates serait subdivisé en une portion rostrale (M1r) et une portion caudale (M1c) qui posséderait chacune des caractéristiques différentes (Jones et al., 1978, Strick and Preston, 1982a, b, Stepniewska et al., 1993, Preuss et al., 1996, Stepniewska et al., 2006). Seront donc abordés ci-dessous trois aspects qui auront permis d’avancer cette hypothèse d’une subdivision de M1, soit la cytoarchitecture, la physiologie et la connectivité. Cette subdivision en une région caudale et rostrale serait similaire chez l’humain (Geyer et al., 1996).
Cytoarchitecture de sous-régions de M1
Au niveau cytoarchitectural, chez le singe-hibou les cellules pyramidales de la couche laminaire V sont plus larges dans la partie caudale que dans la partie rostrale de M1 (Stepniewska et al., 1993, Preuss et al., 1996). Chez l’humain, une différence significative du volume de neurones et des densités laminaires des couches II à VI existe également entre la portion rostrale et caudale de la représentation du membre antérieur de M1 (Geyer et al., 1996). Il semble donc que des différences cytoarchitecturales existent entre M1r et M1c chez le primate et chez l’humain.
Physiologie de sous-régions de M1
En termes de physiologie, l’enregistrement de l’activité neuronale au niveau du territoire dédié au bras de M1 lors de la manipulation de la main et de l’avant-bras permettait une distinction de la portion rostrale et caudale de M1 en relation avec les inputs sensoriels qu’elle reçoit. Ainsi, chez le singe-écureuil la subdivision M1c reçoit des inputs somatosensoriels principalement d’ordre cutané, tandis que la subdivision M1r reçoit plutôt des inputs somatosensoriels musculaires ou articulaires (Strick and Preston, 1982b). Il semble donc y avoir une ségrégation entre les inputs somatosensoriels envoyés vers l’une et l’autre des subdivisions de M1. Chez l’humain, il fut démontré par l’analyse de patrons d’activation de scan de tomographie par émission de positrons (PET) que deux sous-régions de M1 sont activées différemment lorsque des sujets sains effectuent diverses tâches motrices solicitant les doigts (Geyer et al., 1996). Ainsi, en effectuant diverses tâches requérant du sujet qu’il appuie sur un bouton avec un seul doigt suite à des stimuli somatosensoriels visuels ou tactiles, ou encore lors d’une tâche de mémoire, deux zones d’activations émergeaient, et ce différentiellement selon les tâches demandées. Dans ce cas-ci aussi, on note un certain chevauchement entre les zones d’activation décelé par PET (Geyer et al., 1996). Dans ces travaux qui s’attardent aux différences physiologiques potentielles au sein de M1, notons que l’apport d’information somatosensorielle est distribué différentiellement entre M1r et M1c.
Connectivité de sous-régions de M1
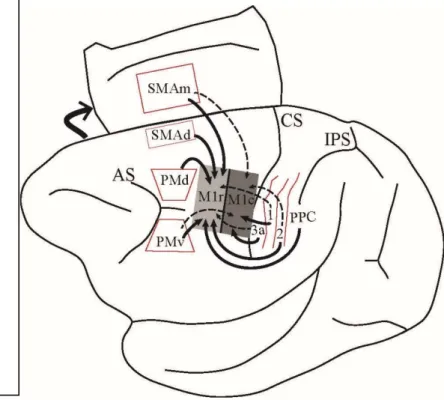
Au sujet de la connectivité de M1r et M1c avec d’autres aires corticales, leurs patrons de connexions présentent des distinctions (Figure 3). Comme mentionné à la section précédente, l’utilisation de traceurs neuronaux rétrogrades injectés dans un seul segment
majeur du corps de M1 marque typiquement la même représentation du corps dans plusieurs autres aires corticales. Chez le singe-hibou, M1r reçoit les inputs de la représentation du membre antérieur de PMd, de la portion dorsale de SMA (au niveau de la convexité du mur médian; SMAd) et du cortex postérieur pariétal (Stepniewska et al., 1993). Au niveau somatosensoriel, la représentation du membre antérieur de M1r reçoit principalement des inputs de l’aire 2 et minoritairement des aires 3a et 1, tandis que M1c reçoit une faible quantité d’inputs de l’aire 2 et reçoit de façon prédominante des inputs des aires 3a et 1 (Stepniewska et al., 1993). Pour ce qui est de PMv et la portion médiale de SMA (à l’intérieur du mur médian; SMAm), les deux subdivisions de M1 en reçoivent des inputs, mais M1r en reçoit de façon plus abondante. Au niveau du sulcus latéral, les aires PV et S2 envoient des projections aux deux subdivisions de M1 (Stepniewska et al., 1993).
Figure 3: Schéma résumant la connectivité de la M1 avec d’autres aires corticales du réseau sensorimoteur chez le singe hibou tel qu’énoncé ci-dessus. Les inputs reçus par la portion rostrale ou caudale M1 sont représentés par les flèches pleines, tandis que des
connexions plus faibles sont représentées par des flèches pointillées. M1r : M1 rostral, M1c : M1 caudale, SMAd : SMA dorsale, SMAm : SMA médiale, 3a Aire 3a, PPC : cortex pariétal postérieur et autres conventions telles qu’aux figures précédentes.
On peut donc affirmer que les deux subdivisions de M1 sont différentes sur plusieurs plans, selon leurs cytoarchitectures, leurs propriétés physiologiques et leurs patrons de connectivités corticocorticales. Par contre, les travaux étudiant la connectivité de M1 ne présentent pas une résolution spatiale suffisante permettant de discerner l’organisation fine au sein même de la représentation du bras de M1. Ceux-ci ne permettaient donc pas de quantifier avec une grande précision la topographie des projections reliant de possibles subdivisions de M1 avec d’autres aires corticales.
Patron de connexions spécifique de M1 et PMv
D’ailleurs, de plus amples travaux chez le singe-écureuil ont démontré quantitativement qu’il existe un patron de connexions spécifique entre la représentation détaillée du bras des aires corticales M1 et PMv (Dancause et al., 2006b). Dans la portion caudale de la représentation distale de l’avant-bras de M1, seule la portion latérale possède des connexions avec PMv (Dancause et al., 2006b). Il y a donc un premier regroupement des connexions entre la représentation distale de PMv et M1 qui est formé au niveau caudolatéral de la représentation distale du membre antérieur de M1. Par contre, dans la subdivision rostrale de M1, autant la portion médiale et que latérale sont connectée à PMv. Il y a donc un deuxième et troisième regroupement des connexions entre la représentation distale de PMv et M1 qui est formée au niveau rostrolatéral et rostromédial de la représentation distale du membre antérieur de M1. Ainsi, ces travaux combinant données électrophysiologiques concernant la représentation distale de l’avant-bras avec des données neuroanatomiques ont démontré que la portion rostrolatérale de M1 est la sous-région de M1 qui est la plus fortement connectée avec PMv, tandis que la portion caudomédiale est largement dépourvue de
connexion avec PMv. La distinction entre le patron de connexions de la portion médiale et latérale de M1c, mais aussi en M1r, laisse entrevoir une potentielle division de celles-ci en deux sous-régions, le tout subdivisant M1 en quatre sous-régions, dont les projections présenteraient possiblement une topographie particulière comparé à d’autres aires prémotrices ou pariétales.
C’est donc dans le but de mettre à jour la connectivité de ces quatre sous-régions potentielles de M1 que nous avons entrepris les présents travaux chez trois singes naïfs du Nouveau Monde (Cebus apella). Nous avons voulu détailler la possible relation spécifique et précise entre des subdivisions de M1 et diverses aires corticales déjà connues pour leurs liens avec M1 en tirant profit d’une combinaison de techniques électrophysiologiques et neuroanatomiques. Nous stipulons donc que les subdivisions de M1 proposées jusqu’ici ne se limiteraient plus à deux, mais plutôt à au moins quatre sous-régions présentant des patrons de connexions distincts avec différentes aires du réseau sensorimoteur. De ce fait, nous suggérons que ces sous-régions de M1 contribueront à des fonctions spécifiques associées au contrôle moteur du bras, de la main et des doigts, en fonction de leurs différents emplacements au sein des diverses boucles d’interactions du réseau sensorimoteur.
Récapitulatif
Le développement d’une variété de techniques a permis de faire évoluer notre compréhension de l’organisation de M1. Certains travaux ont décrit des zones de spécialisation dans la représentation du membre antérieur de M1, proposant une distinction, tant sur le plan cytoarchitectural, physiologique, que connectionnelle, entre M1r et M1c (Jones et al., 1978, Strick and Preston, 1982a, b, Humphrey and Reed, 1983, Stepniewska et al., 1993,
Geyer et al., 1996, Preuss et al., 1996, Stepniewska et al., 2006). On note aussi que la représentation distale de PMv est interconnectée précisément avec des subdivisions de celle de M1, illustrant à nouveau la distinction entre la portion caudale et rostrale de M1, mais également entre la portion médiale et latérale de chacune (Dancause et al., 2006b). Considérant le patron de connexions spécifique entre PMv et des subdivisions précises de M1, nous proposons que des patrons de connexions spécifiques entre ces subdivisions de la représentation du membre antérieur de M1 et celle d’autres régions corticales émergeront. Nos travaux examineront donc l’origine des projections sensorimotrices chez le singe capucin afin d’approfondir nos connaissances de la spécificité du réseau anatomique cortical des sous-régions de M1. Ces données nous aideront à comprendre le type d’interactions avec d’autres aires corticales qui peuvent prendre place dans ces mêmes sous-régions. Ultimement, ces résultats permettront de mieux comprendre comment l’organisation interne de M1 et l’existence de sous-réseaux corticaux pourraient contribuer à fractionner le contrôle de mouvement exercé par M1.
Chapitre II. Manuscrit pour soumission
Different patterns of cortical inputs to subregions in the primary
motor cortex hand representation
Melvin Dea1, Adjia Hamadjida1,2, Guillaume Elgbeili3, Stephan Quessy1, and Numa
Dancause1,2
1Département de Neurosciences,
2 Groupe de recherche sur le système nerveux central (GRSNC) Pavillon Paul-G-Desmarais,
Université de Montréal
3 Psychosocial Research Division, Douglas Institute Research Centre, Verdun, QC, Canada
Running title: Cortical networks of sub-regions in M1
Abstract
The primary motor cortex (M1) plays an essential role in the control of hand movements in primates and is part of a complex cortical sensorimotor network involving multiple premotor and parietal areas. In a previous study, we found that the ventral premotor cortex (PMv) projected mainly to 3 regions within the M1 forearm representation (rostro-medial (RM); rostro-lateral (RL) and lateral (CL)) with very few projections caudo-medially (CM). These results suggest that projections from premotor areas to M1 are not uniform, but rather segregated into subregions. The goal of the present work was to study how inputs from diverse areas of the ipsilateral cortical network are organized within the M1 hand representation. In cebus apella, different retrograde neuroanatomical tracers were injected in 4 subregions of the hand area of M1 (RM, RL, CM and CL). We found a different pattern of input to each subregion of M1. The predominant input to RM was from PMd, RL from PMv and CL from area 2. The proportion of inputs to CM was more evenly distributed among regions of the ipsilateral hemisphere. These results support that the M1 hand representation is composed of several subregions, each part of a unique cortical network.
Introduction
One common finding across neuroanatomical and functional studies is that the primary motor cortex (M1) is not uniform but may be comprised of subregions with distinct characteristics. For example, the caudal part of M1 has larger pyramidal cells than the rostral part (Stepniewska et al., 1993, Preuss et al., 1996) and, whereas the hand representation extends across both regions, current intensity to evoke movements with intracortical microstimulation (ICMS) tends to be lower caudally (Preuss et al., 1996). It is also in the caudal part of M1 that most neurons with monosynaptic projections onto motoneurons controlling hand and arm muscles are located (Rathelot and Strick, 2006, 2009).
The hand representation of M1 is part of an extensive network of cortical areas that interact for the production of arm movements. Several premotor as well as somatosensory areas send projections to M1 (Stepniewska et al., 1993, Dum and Strick, 2005), providing a substrate by which they can modulate the activity and outputs of M1 neurons (Tokuno and Nambu, 2000, Davare et al., 2008, Prabhu et al., 2009, Ziluk et al., 2010). Neuroanatomical tracing studies also often report that the distribution of these cortical inputs in M1 is not homogeneous. Projections from somatosensory areas are denser in the caudal portion of the M1 hand representation and are sparser rostrally (Stepniewska et al., 1993, 2006). Interhemispheric projections seem to follow an inverse pattern. They are located primarily in rostral M1, and are virtually absent in caudal M1 (Gould et al., 1986, Dancause et al., 2007). Inputs from ispilateral premotor areas have also been proposed to preferentially target rostral M1 (Stepniewska et al., 1993, Dum and Strick, 2005, Dancause et al., 2006b, Stepniewska et al., 2006).
In a previous study, we analyzed the topographic distribution of projections from the ipsilateral PMv in relation to the M1 arm representation and found a more complex pattern than expected (Dancause et al., 2006a). PMv’s projections were not simply primarily targeting the rostral M1 but rather formed 3 clusters (rostromedial, rostrolateral and caudolateral), leaving only the caudomedial region of M1 receiving few projections from PMv. These results extend the concept of M1 subdivisions beyond the rostro-caudal axis and suggest that PMv has a very specific pattern of connections with 4 regions within M1. One possibility is that other premotor and sensory areas also preferentially project to specific regions within M1 altogether forming multiple specialized zones, each with a distinct pattern of cortical connections. This idea was recently supported in a study using long-trains of stimulation to identify ‘functional zones’ (i.e. reach, defense and grasp) within the frontal cortex and the posterior parietal cortex (Gharbawie et al., 2011a). Injections of tracers in each zone revealed a unique pattern of connections. For example, the M1 grasp zone had few connections with S1 and was densely connected with the lateral portion of the posterior parietal cortex, where the parietal grasp zone is located. In contrast, the M1 defense zone had dense connections with S1 and had broader connections in the parietal cortex, with both the defense and grasp zones.
In the present set of experiments, our goal was to study the topographic specificity of cortical projections to M1. In particular, we wanted to directly compare the pattern of ipsilateral inputs to the 4 potential subregions (rostromedial (RM), rostrolateral (RL), caudomedial (CM) and caudolateral (CL)), within the M1’s hand representation highlighted in our previous studies (Dancause et al., 2006a). We found that the proportion of input from each distant area of the sensorimotor cortex substantially varied across M1. These results show that
premotor and somatosensory cortical areas. We propose that the M1 hand area is composed of multiple integration nodes that process and integrate largely different cortical inputs and could support specialized aspects of motor functions.
Materials and methods
Surgical proceduresThree naïve young adult female capuchin monkeys (Cebus apella), with weight ranging from 1.2kg to 3.5kg, were used in the present study. Our experimental protocol conformed to the guidelines of the Canadian Council on Animal Care and was approved by the Comité de Déontologie de l’Expérimentation sur les Animaux of the Université de Montréal.
All surgical procedures were conducted on the left hemisphere under aseptic conditions. Anesthesia was induced with an intramuscular injection of Ketamine (Ketaset®; 15mg/kg) and transitioned to isoflurane (~2% in 100% O2). The animal was placed in a
stereotaxic frame, pre-medicated with an intramuscular injection of Dexamethasone 2 (Vetoquinol®; 0.5 mg/kg). Lactated ringer’s solution was delivered intravenously (10 ml/kg/h) and pulse rate, respiration rate, arterial oxygen saturation and body temperature were monitored and documented throughout the surgery. A dose of Mannitol 20% (1500 mg/kg) was given intravenously prior to the craniotomy to prevent swelling of the brain.
A craniotomy and durectomy exposed the forelimb areas of M1, PMv, dorsal premotor cortex (PMd), supplementary motor area (SMA), as well as the primary somatosensory cortex (S1) and the lateral portion of area 5. The cortex was covered with warm silicone oil and digital photographs of the exposed brain surface taken. Digital pictures were imported in technical illustration software (Canvas, ADC systems). A grid (250µm resolution) was overlaid on the photomicrograph and used to guide electrode penetrations during electrophysiological mapping. For the collection of electrophysiological data, isoflurane was
withdrawn and anesthesia maintained with intravenous injections of Ketamine (20mg/kg/hr) and Diazepam (Valium; 0.01mg/kg/hr). Intracortical microstimulation (ICMS) mapping techniques were used to identify the location of motor representations (Nudo et al., 1992, Dancause et al., 2006c, Dancause et al., 2007). Multi-unit recording techniques were used to locate S1 (area 1 and area 2) and area 5 (Dancause et al., 2006b, Padberg et al., 2007, Padberg et al., 2010). After physiological data collection, neuronal tracers were injected in M1. At the end of the surgery, monkeys received a subcutaneous injection of Carprofen (Rimadyl®; 10 mg/kg), Enrofloxacin (Baytril®; 5 mg/kg) and intramuscular injection of buprenorphine (Temgesic®; 0.01mg/kg). The recovery of the monkey was closely supervised and the drug regiment ensued for 3 days. At the end of the tracer incubation period of 21 days, the animal was killed with a lethal dose of pentobartital, the brain perfused and processed for tissue sectioning.
Electrophysiological motor mapping
In all 3 animals, we identify the location of the hand representation in M1, PMd and PMv with ICMS. SMA’s hand representation was also located with ICMS in 2 animals (CB-6 and CB-8). A glass-coated tungsten microelectrode (impedance ~1 MΩ; FHC Bowdoin, ME USA) mounted on a micromanipulator (David Kopf Instruments, model 2662, Tujunga, CA) was lowered perpendicularly into the cortex. Cortical maps were derived using standard ICMS trains (Mansoori et al., 2014, Touvykine et al., 2015). A stimulation train consisted of 13 monophasic cathodic square pulses (0.2ms duration; 3.3ms interpulse interval) and trains were delivered at 1Hz. At each cortical site, electrical stimulation was applied at different depths (1750µm-6000µm) to identify the regions at which responses were evoked with the lowest
2500μm and for SMA between 3000μm-4000μm. Microelectrode interpenetration distances were 1000μm in M1 and 500μm in PMd, PMv and SMA. At each penetration site, once the depth with maximal response was identified, the movement evoked at threshold current intensity (the current at which movements were evoked by 50% of the stimulation trains) was identified by visual inspection and by palpation of the arm muscles by one experimenter and confirmed by another. This movement was used to construct the motor maps. If no movement was evoked at a maximum current intensity of 100μA, the site was defined as unresponsive. The evoked movements were categorized using conventional terminology (Gould et al., 1986, Nudo et al., 1996a, Dancause et al., 2006c). Sites evoking movements of the digits and wrist and forearm (pronation and supination) were grouped into the hand representation. As defined, the hand representation in M1 typically forms a contiguous area that is surrounded by non-responsive sites caudally and sites evoking movements of the elbow, shoulder and face at the other borders (Nudo and Milliken, 1996, Nudo et al., 1996a, Nudo et al., 1996b, Dancause et al., 2006c).
Electrophysiological somatosensory mapping
To get some insights on the location of the hand representation and borders between areas in the parietal cortex, we conducted somatosensory mapping using multiunit recording techniques (Dancause et al., 2006b). A glass coated tungsten microelectrode (impedance ~1 MΩ), similar to that used for ICMS, was lowered perpendicularly to the exposed cortex at depths varying from 500μm to 1000μm. The depth of the electrode was adjusted to obtain most robust response to stimulation of the receptive field. Signals were filtered, amplified and played through loud speakers for monitoring of the neuronal activity. Light touch, brushing,
fields and the modality of the stimulus driving the most vigorous cortical responses (Sur et al., 1982, Dancause et al., 2006b). We made one or two medio-lateral row(s) of microelectrode penetrations with 500μm interpenetration distance to identify all five digits in area 1 and the medial and lateral boundaries of the hand representation. An additional one or two rostro-caudal row(s) were made to identify the borders between area 1, area 2 and area 5. We established these borders based on the modality of the stimulus driving the neural responses most effectively, the size and location of receptive fields and the capacity to drive vigorous neural responses with stimulation of the receptive fields (Padberg et al., 2007, Padberg et al., 2010). Because of time restrictions caused by motor mapping, we chose not to conduct extensive documentation of the sensory cortex in our animals. In particular, we did not explore the walls of the central sulcus for the identification of area 3a and 3b and thus, did not include connections to these areas in our quantitative analyses. In addition for area 5, we only collected information about the rostral border. The limited physiological sensory mapping data collected should be kept in mind and the conclusions about proportions of projections to M1 from these areas weakened accordingly.
Neuronal tracer injections
Once the motor mapping procedures completed, the animal was put back on isoflurane anesthesia (~2% in 100% O2) for the injection of 4 neuronal tracers all within the M1’s hand
area. Based on previous results (Dancause et al., 2006a), the M1 hand representation was arbitrarily subdivided into 4 quadrants (RM, RL, CM and CL). One of 4 neuroanatomical tracers, Biotinylated dextran amine (BDA; 3,000 MW; Invitrogen), Fluoro-ruby (FR; 3,000 MW; Invitrogen), Fast blue (FB; Dr. Illig Plastics GmbH) and Fluoro-emerald (FE; 3,000
injected at the 4 sites within M1’s hand area (RM, RL, CM and CL) to minimize any bias that may be caused by the properties of the tracers. A 1µL Hamilton syringe coupled to a microsyringe pump controller (Harvard apparatus, Holliston, MA) was used for all injections. In order to label the cortex through all layers of the grey matter, injections were made in three boluses at pre-determined depths (1,800µm, 1,500µm and 1,200µm), creating a column labelling all layers of the grey matter. Following each bolus of injection, the syringe was kept in place for 5 minutes to reduce potential backflow. The amounts of tracer injected at each injection site are provided in Table 1.
Histological procedures
Twenty-one days following neuronal tracer injections, the animals were deeply anesthetized with ketamine (Ketaset®; 15mg/kg; intramuscular) and administered with a lethal dose of pentobarbital (Euthansol; 100mg/kg; intraperitoneal). The animals were perfused transcardially with a solution of 0.2% heparin in 0.1M phosphate buffered saline (PBS; pH=7.4), followed by 3% paraformaldehyde in 0.1M PBS (pH=7.4). The brain was removed and the cerebral cortex isolated. The fronto-parietal cortices were then flattened between two glass slides (Gould and Kaas, 1981, Killackey et al., 1983, Dancause et al., 2005, Dancause et al., 2006b). The cortical block of tissue was post-fixed for two hours in a solution of 20% sucrose, 3% paraformaldehyde in 0.1M PBS, followed by a solution of 20% sucrose with 2% dimethyl sulfoxide in 0.1M PBS overnight and a solution of 20% sucrose in 0.1M PBS for 48 hours. The cryoprotected tissue was quickly frozen at -55°C with methyl butane before being stored at -80°C. Sections were cut tangentially to the cortical surface with a cryostat (thickness 50µm for CB-3 and 40µm for CB-6 and CB-8). The sections were collected in series of six.
following injection of one of the 3 fluorescent tracers (FR, FE and FB). Those sections were immediately mounted after sectioning, air-dried and coverslipped the same day. The second and fifth sections (2/6) were processed to examine the cell bodies labeled with BDA. The third section and sixth sections were kept for Nissl staining (1/6) and myelin staining (1/6). Details of our histology protocols for the BDA and myelin staining have been previously published (Dancause et al., 2005, Dancause et al., 2006b).
Neuroanatomical reconstruction and quantification of labelled cells
To study the distribution of labeled cell bodies, we used a neuroanatomical reconstruction system (Neurolucida, MicroBright-Field, Colchester, VT) associated with a microscope (Olympus BX51, Tokyo, Japan). Sections that were reconstructed had to include the entire cortical region of interest. Incomplete or broken sections were not analysed. The numbers of sections reconstructed for each injection are provided in Table 1. Tangential sectioning facilitated the coregistration of anatomical and neurophysiological data (Xiao and Felleman, 2004, Dancause et al., 2005). In reconstructed sections, the location of large blood vessels, corresponding to large spherical holes, was marked. The same landmarks, along with the points of entry in the cortex of large blood vessels were identified on the photomicrograph used to construct the physiological maps. Reconstructed sections and the photomicrograph along with physiological maps were imported into Adobe Photoshop CS5 (Adobe Systems, San Jose, CA) and were aligned using landmarks, such as sulci and tracer injections sites, and the pattern of blood vessels. The co-registered data allowed us to identify the cortical areas that were physiologically defined on the anatomical sections. As only information about the caudal border of area 5 was available, our contour extended from that border caudally, along
Neuroexplorer, an analysis program linked to Neurolucida (Dancause et al., 2006a, Dancause et al., 2006b).
For each injection site in a monkey, the number of labeled cell bodies in the various ipsilateral cortical areas was counted as a percentage of the total number of neurons labeled with this tracer in the reconstructed hemisphere. Because the count of labeled cells in M1 was affected by the multiple injections cores, we excluded all cells located in M1 from this calculation. The percentages thus only represent extrinsic ipsilateral inputs to M1 (Dancause et al., 2006b). Results from the 3 monkeys were combined to obtain the final distribution of cells following injections in the RM, RL, CM and CL M1. An ANOVA, with monkeys as the statistical units, was conducted on each of the 4 subregions of M1 to determine whether or not the percentages differ between areas. Post-Hoc analyses were conducted to determine which areas significantly differed from the others, using Tukey to correct for multiple testing. In addition, for each monkey, a chi-square test was conducted to determine if the distribution of labeled neurons across cortical areas were the same for the 4 subregions of M1.
Last, to compare the pattern of projections of each distant cortical area to each other, we normalized the percentage values according to the following formula:
1 = %
%
Where area n is the distant area studied (i.e. PMv, PMd, SMA, area 1, area 2 and area 5) and area H is the area with the highest proportion of labeled cells following injections in a given subregion of M1 (RM, RL, CM and CL). The values obtained vary between 1, for area H with the highest proportion of labeled cells, to potentially 0 in the case of an area with no
strength of the projections from area n to the subregion in comparison to the other cortical areas we studied in the sensorimotor network.
Results
Hand representations in primary motor and premotor cortex of cebus monkeys
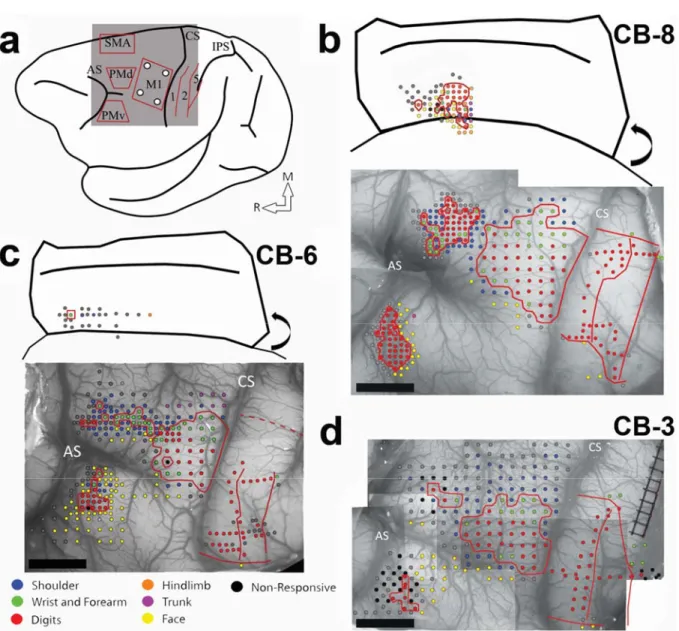
In the present study using ICMS techniques, we provide the most complete documentation of the hand representations in motor and premotor cortex in cebus monkeys to date. Figure 1 shows the electrophysiological mapping data from all 3 monkeys. Sites evoking digits, wrist and forearm formed a contiguous area in M1 that was surrounded by movements of the elbow, shoulder, orofacial or non-responsive sites. The M1 hand representation extended over a large cortical area, and comprised many sites evoking digit as well as site evoking wrist movements (Figure 2). In all 3 monkeys, proximal and non-responsive sites were typically found at the medial and rostral borders of the hand representation. At the lateral border orofacial responses were the most frequent. In one animal (CB-6), we also evoked trunk movements at the medial border of M1’s hand area. Caudally, responses were evoked with low current intensities on the convexity of the rostral bank of the central sulcus. We unsuccessfully attempted to evoke movements along the sulcus (depths of ~2000µm to ~4000µm), supporting that in cebus monkeys M1 is largely located on the convexity and that area 3a is situated in the anterior bank of the central sulcus (Felleman et al., 1983, Dum and Strick, 2005). The accessibility to the M1 hand representation facilitated motor mapping and allowed us to target our tracer injections to consistent locations in relation to the organization M1, as defined with ICMS techniques.
Additional ICMS mapping was conducted to locate the hand representations in PMv, PMd and SMA. The hand representation of PMv was found laterally to the spur of the arcuate sulcus. The average distance between the M1 and PMv hand representations for the 3
monkeys was 6.5mm. Almost exclusively digit movements could be evoked in PMv and the hand representation was much smaller than in M1 (Figure 2). Caudally and medially to the hand representation, cortical sites evoking orofacial movements were typically found. In some cases, we also evoked trunk, shoulder or elbow movements. Laterally and rostrally, cortical sites were typically non-responsive and we did not evoke movements along the caudal wall of the sulcus (depths of ~2000µm to ~4000µm). Thus, as for M1, it appears that the hand representation of PMv in cebus monkeys is located on the cortical surface. The PMd hand area was located medially to the spur of the arcuate sulcus. It was in close proximity, but separated from the M1 hand representation (average distance 0.7mm). The size of the hand representation in PMd was comparable to PMv. However, a greater proportion of wrist movements were evoked in PMd than PMv (Figure 2). Non-responsive and proximal sites were found at the medial, rostral and lateral borders of the PMd hand area. In addition, some sites eliciting orofacial movements were found at the lateral border. In one case (CB-6), the PMd hand representation was not contiguous, but was rather formed of several isolated clusters separated by non-responsive sites and sites evoking proximal movements. We were able to locate the SMA’s hand area in two monkeys (CB- 8 and CB-6). In comparison to PMv and PMd, responses were elicited at greater depths (~2500µm to ~4000µm), suggesting that most of the SMA hand representation is located along the medial wall. Based on these 2 monkeys, the distance between the M1 and SMA hand representations was 8.2mm. We collected enough data to construct a motor map in only one monkey (CB-8). Although this would have to be confirmed in additional animals, it appears that the size of SMA hand representation is comparable to other premotor areas (Figure 2). Ventrally, non-responsive sites surrounded the hand representation. Rostrally, in addition to non-responsive sites, we
found several orofacial responses. At both the dorsal and caudal borders of the SMA hand representation, we found sites from which we could evoke hindlimb, trunk, shoulder and elbow movements.
Hand representations in the parietal cortex
In the parietal cortex, we conducted electrophysiological mapping using multiunit recording techniques (Felleman et al., 1983, Dancause et al., 2006b, Padberg et al., 2007). One or two medio-lateral row(s) of electrode penetrations was done in area 1 of S1. The receptive fields of digits were organized somatotopically, with digit 5 found most medially and digit 1 most laterally. Lateral to the hand representation, we found receptive fields on the face and medial to the hand representation, the receptive fields were on the wrist and forearm. Due to time constraints, we could not identify the medial border of hand representation in CB-6 and thus, the location of this border was estimated based on somatosensory mapping data of other cebus monkeys from our laboratory (n=8). One or two rostro-caudal row(s) of electrode penetrations provided insights on the location of borders between area 1, area 2 and area 5. In area 1, neurons reacted to light cutaneous stimulations. In the rostral aspect of area 1, receptive fields were typically on the palm of the hand and were progressively found closer to the tip of digits has we moved the recording electrode caudally. The transition to area 2 was marked by the occurrence of larger receptive fields that covered several digits and often extended to the palm. Neurons in area 2 also often responded to movement of joints. In area 5, numerous sites were non-responsive or had activity that was weakly driven by manipulation of the hand and arm. Responsive sites typically reacted to joint manipulation, squeezing of multiple fingers or even the entire hand and forearm of the monkey (Padberg et al., 2007). Based on these results,
representation in area 1 and 2 and the borders between area 1, area 2 and area 5 for the quantification of labeled cells.
Distribution of labelled cell bodies in the ipsilateral hemisphere
Following identification of the hand area in M1, 4 different neuroanatomical tracers were injected in subregions (RM, RL, CM and CL). Figure 3 shows examples of neurons labeled by the different tracers. The use of multiple tracers injected in the same animal at physiologically identified locations allowed to directly compare the pattern of inputs of these subregions of M1 within each animal. Figure 4 shows the anatomical reconstruction of the flattened cortex and labeled cell bodies coregistered with the physiological mapping data of CB-8 and figure 5 shows CB-6 and CB-3. Within M1, the location and extent of the injection cores resulting from each injection are outlined. Each injection labelled many cells within M1 and several cells in all premotor and sensory areas for which we collected electrophysiological mapping data (i.e. PMv, PMd, SMA, area 1, area 2 and area 5). Additional cells were located along the cingulate sulcus in areas corresponding to the cingulate motor areas (CMAs) and the posterior operculum and inferior parietal cortex, in areas corresponding to the secondary somatosensory cortex (S2) and parietal ventral cortex (PV). We however excluded labeled cells in these areas from our quantitative analyses because the tissue in these regions was incomplete in several sections for each animal. In addition, the injection cores of the tracers prevented accurate counts in M1, and thus we also excluded these data of our quantitative analyses. The percentages of labeled cells thus reflect the distribution of ‘extrinsic’ inputs from PMv, PMd, SMA, area 1, area 2 and area 5 to the injected subregions of M1 (Dancause et al., 2006b). Cells in these areas represented more than 92% (mean = 95.0%) of the total
cells were inconsistently found in other areas, for example rostrally to PMv, between PMd and SMA or caudal to area 5 and account for the remaining proportion of labeled cells (~5%).
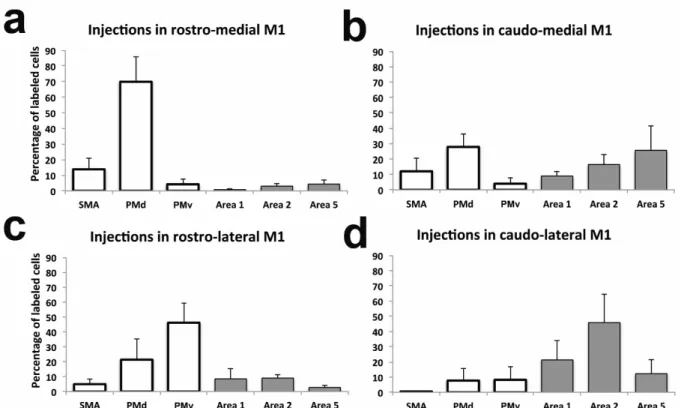
We first quantified the general pattern of inputs to M1. When pooling the data from all M1 injections (n=12), we found only slightly more labeled cells in premotor (55.1%) than in the somatosensory areas. PMd had the highest proportion of labeled cells (31.7%), followed by area 2 (18.6%), PMv (15.6%), area 5 (11.2%), area 1 (9.9%) and SMA (7.8%). Figure 6 shows separately the distribution of labeled cells that resulted from injections in each subregion of M1. A first striking feature of the distribution of labeled cells bodies after the different injections is that both rostral injections (RM and RL) labeled much more cells in the premotor areas (87.9% and 72.4% respectively). After injections in the RM M1 (n=3), most of these cells were in PMd (69.9%), followed by SMA (13.8%). When comparing the proportion of labeled cells in the different areas, we found that only the proportion of labelled cells in PMd was significantly greater than in all other cortical areas (p>0.05). Following injections in the RL M1 (n=3), most labeled cells were found in PMv (46.1%), followed by PMd (21.4%). Once again, only the proportion of labelled cells in PMv was significantly greater than in any other cortical area (p>0.05).
In contrast to rostral injections, both caudal injections (CM and CL) labeled more cells in the parietal cortex (51.1% and 79.4% respectively). Yet, after injections in the CM M1, the greatest proportion of labeled cells was in PMd (27.9%), followed by area 5 (25.6%). In addition, many labelled cells were also found in area 2 (16.4%), SMA (12.0%) and area 1 (9.0%) and fewer in PMv (4.0%). These proportions were not significantly different from each other. Thus, injections in the CM M1 resulted in a more even distribution of labeled cells
area 2 (45.8%), followed by area 1 (21.3%). The proportion of cells in area 2 was significantly greater than all other areas, with the exception of area 1. The proportion of labeled cells in area 1 was not significantly different from any other cortical area. For each monkey, a chi-square test confirmed that the distribution of labeled neurons across cortical areas was different following the injections in each of the 4 subregions of M1 (p<0.0001).
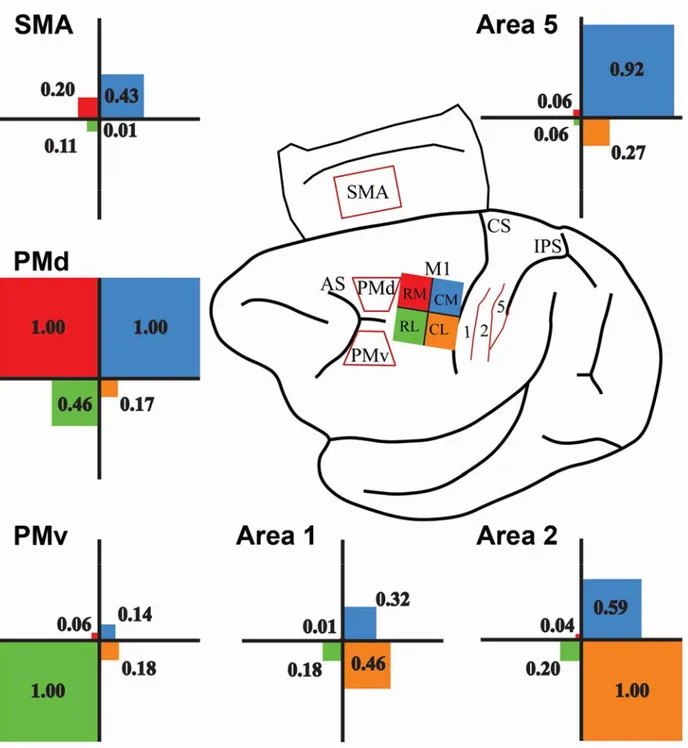
Next, we wanted to get better insights on the relative projections from each distant cortical area to the hand representation of M1. To do so, for each injection site the percentage of labeled cells found in a sensorimotor area was normalized to the predominant connection following this injection (Figure 7). We separated the strength of projections into 3 categories, Major (normalized projection value >0.67), Moderate (between 0.66 and 0.34) and Minor (<0.33). This analysis shows that PMd had the broadest pattern of projections, sending major projections to both RM and CM hand representation of M1, but also moderate projections to RL. PMv’s pattern of projection was more segregated, sending major projections to RL and minor projections to other subregions of M1. Among premotor areas, the relative strength of SMA projections across M1 subregions was the weakest. It only sent moderate projections to CM and minor projections to other subregions. All 3 parietal areas only sent minor projections to rostral M1 (both RM and RL). Area 1 had the weakest projections to the M1 hand area. It sent moderate projections to CL and minor projections to other subregions. Area 2 sent major projections to CL and moderate projections to CM. In contrast, area 5 major projections to CM and minor projections to CL.
Discussion
Our previous work highlighted that PMv projections to M1 are not uniformly distributed but rather specifically target 3 subregions (Dancause et al., 2006). In the present study, our objective was to understand further the organization of ipsilateral cortical inputs in the M1 hand area. In each monkey, we injected various retrograde neuroanatomical tracers in 4 regions of the M1 hand representation and quantified the labeled cells bodies across several ipsilateral premotor and somatosensory areas. Injections in each subregion resulted in a unique pattern of cortical labeled cells. These data support a view that M1 is composed of several zones each receiving inputs of unequal strengths from diverse motor and sensory cortical areas of the ipsilateral hemisphere. Neurons in these M1 subregions are thus part of specific networks in which they can primarily interact with distinct(s) interlocutor(s) for the production of motor outputs involved in hand movements.
Motor and somatosensory areas in the capuchin monkey
We chose to conduct our study in cebus monkeys a New World species capable pseudo-opposition of the thumb and index (Christel and Fragaszy, 2000) that can use tools such as branches and stones, approximating the function of macaque monkeys or even some great apes (Visalberghi et al., 1995, Moura and Lee, 2004, Evans and Westergaard, 2006). These specialized hand tasks could be sustained by the numerous corticomotoneuronal projections from M1 that are present in capuchin and lacking in less dexterous New World monkeys (Bortoff and Strick, 1993, Lemon, 2008). As suggested from previous studies (Gould and Kaas, 1981, Dum and Strick, 2005), we found that the hand representations of M1, PMv and PMd are located on the cortical surface and thus easily accessible for cortical mapping.
size of premotor areas, which all covered comparable cortical areas. This pattern is quite different than what has been reported in squirrel monkeys, another New World species, where PMv is much larger than other premotor areas (Dancause et al., 2006c, Dancause et al., 2007, Eisner-Janowicz et al., 2008, Dancause, 2013). It is not clear why PMd and SMA (although we have limited on SMA data in the present study) are larger in cebus monkeys in comparison to other New World primates. Perhaps the increased repertoire movements such as the opposition of the thumb rely on corticomotoneuronal connections, while the complexity of motor behaviors such as the use of tools emerged with the development of some premotor areas such as PMd and SMA.
Another appealing aspect of capuchin monkeys is that they have a well-defined area 2 in S1 (Padberg et al., 2007). In several other New World species, there is little support for the existence of area 2 (Merzenich et al., 1978, Padberg et al., 2005, Dancause et al., 2006b). In the present study, we did find receptive fields that are characteristic of area 2 and a transition that marked the rostral border of area 5. Altogether, the presence of these somatosensory areas with the accessibility of motor representations and behavioral traits of cebus monkeys make them a particularly appealing species to study the cortical network sustaining hand functions.
Pattern of projections from somatosensory areas to M1
There is a wealth of studies reporting that M1 is interconnected with S1 and with the posterior parietal cortex (Jones et al., 1978, Pons and Kaas, 1986, Ghosh et al., 1987, Stepniewska et al., 1993). Likewise, we consistently found that M1 received projections from these areas in all 3 monkeys. The large proportion of ipsilateral inputs to M1 originating from the parietal lobe (areas 1, 2 and 5) we found (44.9%) contrasts with a previous quantitative