UNIVERSITÉ DE MONTRÉAL
EXPERIMENTAL AND THERMODYNAMIC INVESTIGATION OF RE-Mg-Zn
(RE=Sc, Y, La, Ce, Pr, Nd, Pm, Sm, Eu, Gd, Tb, Dy, Ho, Er, Tm, Yb and Lu)
SYSTEMS
ZHIJUN ZHU
DÉPARTEMENT DE GÉNIE CHIMIQUE
ÉCOLE POLYTECHNIQUE DE MONTRÉAL
THÈSE PRÉSENTÉE EN VUE DE L’OBTENTION
DU DIPLÔME DE PHILOSOPHIAE DOCTOR
(GÉNIE MÉTALLURGIQUE)
AOÛT 2015
UNIVERSITÉ DE MONTRÉAL
ÉCOLE POLYTECHNIQUE DE MONTRÉAL
Cette thèse intitulée:
EXPERIMENTAL AND THERMODYNAMIC INVESTIGATION OF RE-Mg-Zn
(RE=Sc, Y, La, Ce, Pr, Nd, Pm, Sm, Eu, Gd, Tb, Dy, Ho, Er, Tm, Yb and Lu)
SYSTEMS
présentée par: ZHU Zhijun
en vue de l’obtention du diplôme de : Philosophiae Doctor
a été dûment acceptée par le jury d’examen constitué de : M. CHARTRAND Patrice, Ph. D., président
M. PELTON Arthur, Ph, D., membre et directeur de recherche
M. GHARGHOURI Michael, Dr., membre et codirecteur de recherche M. BALE Christopher, Ph. D., membre
DEDICATION
ACKNOWLEDGEMENTS
This research work was carried out at Center for Research in Computational Thermochemistry (CRCT) at École Polytechnique de Montréal under the guidance of Prof. A.D. Pelton. I gratefully acknowledge Prof. A. D. Pelton for his supervision and patience during my research. Prof. A.D. Pelton is a paragon of virtue and learning. Although he is very easygoing and easy to get along with, it is not the case when it comes to research-he is always strict on my research work. Needless to say, I benefit a lot from his instruction.
I am also indebt to my co-director Dr. Michael Gharghouri for his guidance of my experiments; to Prof. Mamoun Medraj for allowing me to use all the facilities at TMG lab in Concordia University; I would like to express my appreciation to both of you for your important suggestions to the Neutron Powder Diffraction experiments.
Special thanks goes to Prof. In-Ho Jung for proposing the current project; to Prof. Chistopher Bale for your excellent course on FactSage software; to Prof. Patrice Chartrand for your suggestion to the research; to Dr. Christian Robelin for your detailed explanation of the solution file and french translation of the Abstract; to Aimen Gheribi for your ab-initio calculation and French translation of “CONDENSÉ EN FRANÇAIS”; to Drs. Dmytro Kevorkov and Mostafa Ahmad for helping me prepare the samples; to Dr. Sooyeol Lee for helping with the neutron diffraction experiments; to Dr. Liling Jin for all your help during my research, to Dr. James Sangster for checking my thesis.
I also thank Dr. Jacques Melançon and Eve Belisle for helping with all the technical issue related to the computer or FactSage software.
I am grateful to all the staff members at Canadian Neutron Beam Center, without your help all the experimental work could not be finished.
All the members from CRCT: Mme Catherine Boucher, Dr. Sergei Degterov, Dr. Jean-Philippe Harvey, Dr. Wan-Yi Kim, Dr. Adarsh Shuklar, Dr. Guillaume Lambotte, Dr. Denis Shishin, Dr. Viktoria Prostakova, Mme Evgenii Nekhoroshev, Dr. Jian Wang, to name a few, are greatly appreciated for your friendship.
The financial support from the Natural Sciences and Engineering Research Council of Canada (NSERC) Magnesium Strategic Research Network are greatly appreciated.
I am particularly indebted to my wife, Yan Yang, for your support and understanding; to my daughter, Sirui Zhu, for all the happiness you bring to me; to all my family members and friends for your support and encouragement. I love you all!
RÉSUMÉ
Lors d’une “optimisation” / modélisation thermodynamique, des paramètres du modèle ajustables sont affinés à partir de toutes les données thermodynamiques et d’équilibres de phases disponibles de façon à obtenir un ensemble d’équations du modèle dépendant de la température et de la composition. A partir de ces équations du modèle, toutes les propriétés thermodynamiques et tous les diagrammes de phases peuvent être calculés par minimisation de l’énergie de Gibbs à l’aide d’un logiciel tel que FactSage. En général, l’optimisation d’un système ternaire commence par l’optimisation des trois sous-systèmes binaires. Les paramètres binaires du modèle sont ensuite utilisés pour estimer les propriétés des phases ternaires, et ces estimations sont ensuite améliorées par l’introduction de paramètres ternaires si nécessaire de façon à reproduire les données ternaires disponibles.
Tous les systèmes binaires Mg-Zn et Mg-RE (où RE = terre rare) ont déjà été optimisés auparavant et les paramètres du modèle pour ces systèmes sont disponibles dans le logiciel FactSage. Dans le présent projet, tous les systèmes binaires RE-Zn et la plupart des systèmes ternaires RE-Mg-Zn sont optimisés.
En premier lieu, toutes les données thermodynamiques et de diagrammes de phases disponibles pour les systèmes Re-Zn (Sc, Y, La, Ce, Pr, Nd, Pm, Sm, Eu, Gd, Tb, Dy, Ho, Er, Tm, Yb, Lu) ont été rassemblées et évaluées de manière critique. Les terres rares ont des propriétés très similaires. Les diagrammes de phases de tous les systèmes Re-Zn sont très semblables. Les tendances observées dans les propriétés des systèmes terre rare (RE)-Zn pour toute la séquence des terres rares ont été exploitées pour estimer les données manquantes et pour vérifier la cohérence des données existantes. Le Modèle de Miedema est également utilisé dans le présent projet pour évaluer l’enthalpie de mélange des phases liquides. A partir de toutes les données disponibles, une évaluation critique et une optimisation thermodynamiques de ces systèmes a été effectuée et des paramètres du modèle pour les propriétés thermodynamiques de toutes les phases ont été obtenus.
En second lieu, des expériences de diffraction de neutrons (DN) in-situ ont été réalisées pour des échantillons choisis dans les systèmes Ce-Mg-Zn et Nd-Mg-Zn de façon à identifier les phases et les températures de transition. Grâce à la grande capacité de pénétration des neutrons, des échantillons de grande taille (10-20 grammes) peuvent être utilisés dans le présent travail,
conduisant à un meilleur contrôle de la composition et à une résistance à l’oxydation accrue. Des informations plus précises à propos des relations de phases et du comportement en transformation découlent des présentes expériences de DN car celles-ci sont réalisées in-situ à des températures élevées. Toutes les données expérimentales de DN sont utilisées pour valider et affiner le modèle thermodynamique.
Finalement, toutes les données de diagrammes de phases pour les systèmes RE-Mg-Zn ont été évaluées de manière critique et tous les systèmes ternaires RE-Mg-Zn (à l’exception de Sc-Mg-Zn, Pm-Sc-Mg-Zn, Eu-Mg-Zn et Yb-Mg-Zn) ont été optimisés à partir des systèmes binaires Mg-Zn, Mg-RE et RE-Zn. Les tendances et régularités observées sont utilisées à nouveau lors de l’optimisation des systèmes ternaires. Comme on pouvait s’y attendre, tous les systèmes RE-Mg-Zn sont liés de près. Les systèmes Ce-Mg-RE-Mg-Zn et Nd-Mg-RE-Mg-Zn sont optimisés de façon critique en prenant en compte les nouvelles données de DN. L’optimisation thermodynamique de tous les autres systèmes RE-Mg-Zn est grandement facilitée par l’optimisation simultanée des systèmes Ce-Mg-Zn et Nd-Mg-Zn.
Il faut noter que le Modèle Quasichimique Modifié (MQM) est utilisé dans le présent projet pour décrire la phase liquide. Puisque l’ordre à courte distance est pris en compte par ce modèle, on s’attend à une meilleure description de la phase liquide.
Le présent projet a pour but de construire une banque de données thermodynamiques la plus complète et la plus précise possible pour les systèmes RE-Mg-Zn. Les chercheurs s’intéressant aux alliages de Mg pourront en bénéficier.
ABSTRACT
In a thermodynamic “optimization/modeling”, adjustable model parameters are refined based on all available thermodynamic and phase-equilibrium data in order to obtain one set of model equations as functions of temperature and composition. From the model equations, all the thermodynamic properties and phase diagrams can be back-calculated by Gibbs energy minimization using software such as FactSage. Generally, in the optimization of a ternary system one begins by optimizing the three binary sub-systems. The binary model parameters are then used to estimate the properties of the ternary phases, and these estimates are then refined by introducing ternary model parameters where required to reproduce available ternary data.
All binary Mg-Zn and Mg-RE (where RE = rare earth) systems have already been optimized and the model parameters of these systems are readily available in the FactSage software. In the present project, all binary RE-Zn and most of the ternary RE-Mg-Zn systems are optimized.
Firstly, all available phase diagram and thermodynamic data for the RE-Zn (Sc, Y, La, Ce, Pr, Nd, Pm, Sm, Eu, Gd, Tb, Dy, Ho, Er, Tm, Yb, Lu) systems have been collected and critically assessed. The rare earth elements have very similar properties. The phase diagrams of all RE-Zn systems are very similar. Trends in the properties of the rare earth (RE)-Zn systems as one traverses the rare earth series have been exploited for purposes of estimating missing data and for checking existing data for consistency. The Miedema Model is also used in the present project to estimate the enthalpy of mixing of the liquid phases. Based on all available data, critical thermodynamic evaluation and optimization of these systems have been carried out and model parameters for the thermodynamic properties of all phases have been obtained.
Secondly, in-situ neutron diffraction (ND) experiments have been performed on selected samples in the Ce-Mg-Zn and Nd-Mg-Zn systems to identify phases and transition temperatures. Due to the high penetrating power of neutrons, large samples (10-20 grams) are used in the present work, leading to better control of composition and increased resistance to oxidation. More accurate information about phase relationships and transformation behavior can also be expected from the present ND experiments because they are performed in-situ at high temperatures. All the ND experimental data are used to validate and refine the thermodynamic modelling.
Finally, all phase diagram data for the RE-Mg-Zn systems have been critically assessed and all ternary RE-Mg-Zn (excluding Sc-Mg-Zn, Pm-Mg-Zn, Eu-Mg-Zn and Yb-Mg-Zn) systems have been optimized, based on the binary Mg-Zn, Mg-RE and RE-Zn systems. Observed trends and regularities are again used in the optimization of the ternary systems. As expected, all RE-Mg-Zn systems are similarly closely related. The Ce-RE-Mg-Zn and Nd-RE-Mg-Zn systems are critically optimized taking into account the new ND data. Thermodynamic optimization of all other RE-Mg-Zn systems is greatly aided by simultaneous optimization of the Ce-Mg-Zn and Nd-Mg-Zn systems.
It should be noted that the Modified Quasichemical Model (MQM) is used in the present project to describe the liquid phase. Since short range ordering (SRO) is taken into account by this model, better description of the liquid phase is expected.
The present project is aimed at building the most complete and accurate thermodynamic database for the RE-Mg-Zn systems from which all investigators of Mg alloys can benefit.
CONDENSÉ EN FRANÇAIS
Le secteur des transports contribue pour environ un quart des émissions des gaz à effet de serre du Canada. Une des possibilités pour réduire ces émissions, en ce qui concerne le secteur des transports, est de réduire la masse des véhicules. Celle-ci peut être réalisé en remplaçant les composantes actuelles en acier soit par soit par le magnésium ou par des alliages d'aluminium puisque les alliages à base de magnésium sont parmi les plus légère matériaux de structure. Cependant, le magnésium à des propriétés mécaniques faibles par rapport à l'acier et aux alliages d'aluminium : à savoir une mauvaise de résistance mécanique et une mauvaise maniabilité. Des éléments d'alliage doivent être ajoutés pour améliorer les propriétés mécaniques du magnésium.
Le zinc est souvent ajouté dans les alliages magnésium pour augmenter la résistance mécanique par renforcement de la solution solide. Le magnésium et le zinc ont la même structure hexagonale compacte, la même valence et une électronégativité similaire. Les tailles des deux éléments diffèrent entre de 15 à 18%. Selon les règles de Hume-Rothery, le zinc est l'un des éléments les plus appropriés pour le renforcement des solutions solides dans les alliages de magnésium. L’aluminium est un autre élément d'alliage important dans les alliages magnésium. L'addition d’aluminium peut également augmenter la résistance mécanique des alliages magnésium en formant la phase Al12Mg17 dans la matrice de magnésium. L'effet de renforcement
de la phase Al12Mg17 est limité parce que cette phase devient molle à haute température. Par
conséquent, les alliages Al-Mg ne peuvent être utilisés à hautes températures.
L'un des inconvénients à l'ajout de zinc et d’aluminium and le magnésium est qu'ils ne peuvent pas augmenter la capacité de mise en forme d'alliages de magnésium. Il est communément accepté que les systèmes de glissement au sein du magnésium soient très limités. Par conséquence, la capacité de déformation des alliages de magnésium demeure marginale. L'ajout d'éléments de terres rares peut augmenter la déformabilité des alliages de magnésium, possiblement du à la capacité des terres rares de changer l'énergie de défaut d'empilement dans les alliages de magnésium. Les terres rares peuvent également augmenter la résistance mécanique des alliages de magnésium, soit par durcissement de la solution solide ou renforcement via la précipitation.
Les bases de données thermodynamiques sont essentielles pour le développement de nouveaux alliages de magnésium. Avec une base de données appropriée, il est toujours possible
de prédire les propriétés thermodynamiques et les phases présentes dans un alliage donné. Dans cette étude, une nouvelle base de données thermodynamique pour les systèmes RE-Mg-Zn (RE désignant un élément de terre rare) a été construite en utilisant la méthode de CALPHAD (Acronyme anglais de CALculation of PHAse Diagram)
L'optimisation thermodynamique des systèmes RE-Mg-Zn ont été réalisées selon les étapes suivantes:
1) Toutes les données expérimentales relatives aux systèmes binaires RE-Zn sont examinées de manière critique. En se basant sur les données expérimentales, les modèles thermodynamiques appropriés sont choisis pour toutes les phases binaires possibles. En particulier, le modèle Quasichimique modifié (MQM) est utilisé pour décrire la phase liquide. Le MQM a la particularité de rendre compte des interactions à courte distance au sein de la phase liquide et peut ainsi amener à de meilleures extrapolations dans les systèmes d'ordre supérieur.
2) Des tendances entre les propriétés de tous les systèmes binaires de type RE-Zn ont été établis sur la base de l’analyse de données expérimentales disponibles (à savoir : les points de fusion des éléments purs de terres rares ainsi que les composes RE-Zn similaires; les paramètres de maille des composés RE-Zn). Les tendances ont été utilisées pour estimer les données absentes de la littérature telles que les points de fusion et l'enthalpie de formation de composés. Comme tous les éléments de terre rare ont des propriétés très similaires, des composés stœchiométriques similaires sont attendus dans les différents systèmes RE-Zn. Par conséquent, des composés stœchiométriques de plusieurs systèmes ont été proposés alors qu’aucune évidence expérimentale n’est disponible dans la littérature. Le modèle semi-empirique de Miedema a également été utilisé pour estimer l'enthalpie de mélange des phases liquide et l'enthalpie de formation des phases solides.
3) En prenant compte de toutes les données, estimés ou expérimentales disponible dans littérature, 17 systèmes binaires RE-Zn (avec RE = Sc, Y, La, Ce, Pr, Nd, Pm, Sm, Eu, Gd, Tb, Dy, Ho, Er, Tm, Yb et Lu) ont été optimisés simultanément. En considérant les tendances trouvées, les paramètres du modèle ont également été proposés pour les phases métastables et aussi instables.
4) Toutes les données expérimentales sur les systèmes RE-Mg-Zn ternaires ont été recherchées dans la littérature et soumises à une étude critique. Seules les données compatibles avec les systèmes binaires déjà optimisés furent utilisées dans la procédure d'optimisation. Les systèmes ternaire RE-Mg-Zn ont ensuite été optimisés en fonction des systèmes binaires limite de et de toutes les données expérimentales disponibles dans la littérature.
5) Des expériences in situ diffraction de neutrons (ND) ont été réalisées sur des échantillons choisis dans les systèmes Ce Mg-Zn et Nd-Mg-Zn. Les transformations de phase au sein de ces échantillons ont été étudiées in situ. Les données ND ont ensuite été utilisées soit pour valider ou pour affiner la modélisation thermodynamique.
6) En tenant compte des tendances établies lors de l'optimisation de tous les systèmes binaires RE-Zn, les paramètres du modèle de toutes les phases ternaires ont été établis. Certains ajustements des paramètres du modèle pour les phases binaires ont été effectues pour une meilleure description des systèmes binaires et ternaires RE-Zn et RE-Mg-Zn. Les résultats de la présente étude sont présentés dans six articles, dont deux ont déjà été acceptés pour publication et quatre autres ont été soumis dans des revues a comite de lecture. Les six articles sont présentés dans les chapitres 4, 5, 6, 7, 8 et 9.
Évaluation thermodynamique et l'optimisation des plus léger systèmes binaires RE-Zn (La-Zn, Ce-(La-Zn, Pr-(La-Zn, Nd, Pm-Zn-Zn et Sm-Zn ainsi que Sc-Zn) ont été acceptés pour publication dans la revue "Journal of alloys and compounds" et présenté dans le chapitre 4. Les diagrammes de phase de tous les systèmes RE-Zn sont très similaires, sauf pour Sc-Zn. Des phases avec la même stœchiométrie peuvent être trouvées dans la plupart des systèmes RE-Zn. Par conséquent, les composés stœchiométriques nous avons supposé que le système Pm-Zn a les même composés stœchiométries que ceux des systèmes Nd-Zn et Sm-Zn même si aucune étude poussée n'a été effectuée pour le système Pm-Zn en raison sa nature radioactive. Toutes les données expérimentales disponibles sont examinées pour vérifier leur cohérence. Il a été supposé dans la présente étude que toutes les propriétés des systèmes RE-Zn obéissent aux mêmes tendances lorsque l’on parcourt la série RE. Les tendances ont été utilisées dans la présente étude pour estimer les données absentes de la littérature telle que l'enthalpie de mélange de la phase liquide, l'enthalpie de formation des composés stœchiométriques, les points de fusion des composés, etc. Les données de force électromotrice (FEM) et de pression de vapeur saturante ont directement été
utilisées dans la procédure d’optimisation. Cette approche est différente de la précédente optimisation ou les données thermodynamiques sont dérivées de la force électromotrice et des données de pression de vapeur saturante ont été utilisées. Aucune donnée de solubilité n’a été trouvée pour les composés. De plus tous les composés ont été exclusivement traités comme des composés stœchiométriques. La capacités calorifique de tous les composés sont supposés obéir à l'équation dite de Neumann-Kopp : Cp=xCP(RE)+(1-x)Cp(Zn). La Solubilité du zinc dans les
solutions terminales de structure cubique centré peuvent être observées dans les diagrammes de phases mesurées pour les systèmes : Ce-Zn, Zn-Pr, Nd-Zn et Sm-Zn et la limite de solubilité était d'environ la même pour tous ces systèmes. Par conséquent, la limite de solubilité a été supposée pour le système Sc-Zn, La-Zn et Pm-Zn. L'enthalpie des solutions liquides calculées à partir du modèle Miedema sont comparable à celles obtenues par l’optimisation thermodynamique. Le modèle semi-empirique de Miedema a été utilisé pour prédire l'enthalpie de mélange des solutions liquide dans les systèmes plus lourd RE-Zn la où aucune données thermodynamiques concernant les phases liquides ne sont disponibles dans la littérature. L'enthalpie de formation de plusieurs composés dans le système Zn-La a été calculée avec des calculs ab-initio. Une forte tendance à former des composés a été observée dans tous les systèmes RE-Zn, ce qui est un indice de l’ordre à courte distance dans la phase liquide. Le MQM est ainsi utilisé pour décrire la phase liquide.
Le chapitre 5 présente l'évaluation et l'optimisation thermodynamique des systèmes plus lourds RE-Zn (Eu-Zn, Gd-Zn, Tb-Zn, Dy-Zn, Ho-Zn, Er-Zn, Tm-Zn, Yb-Zn, Lu- Zn et Y-Zn). Les résultats ont été publiés dans la revue "Journal of alloys and compounds". Pour les systèmes plus lourd RE-Zn les données thermodynamiques sont très limitées, excepté pour le système Y-Zn. Les diagrammes de phase de l'Eu-Zn, Tm-Zn et Lu-Zn n’ont pas encore été établies. Des composés ont été signalés pour ces trois systèmes et leurs points de fusion sont proposés dans la présente étude, en utilisant les tendances établies plus tôt. Les diagrammes de phase des systèmes : Eu-Zn Tm-Zn et Lu-Zn ont ensuite été proposés. Tous les diagrammes de phase des systèmes plus lourds RE-Zn sont également très similaires, a l’exception des deux systèmes Eu-Zn et Yb-Eu-Zn, comme cela pouvait être attendu, puisque Eu et Yb ont une sous-couche électronique f a moitie remplis. Les points de fusion et les propriétés thermodynamiques des composés ainsi que les propriétés thermodynamiques des phases liquides ont ensuite été estimées à partir des tendances puis l’optimisation thermodynamique de l'ensemble des systèmes plus
lourd RE-Zn a été effectuée en tenant compte des données expérimentales et estimées. Il est à noter que les points de fusion et les propriétés thermodynamiques des phases métastables et instables ont également été proposés à partir des tendances obtenues au préalable et que l'ensemble de ces phases ont été incluses dans la procédure d'optimisation. Des paramètres sensés pour le modèle ont été proposés pour les phases métastables et instables. Les capacités calorifiques des composés des systèmes plus lourd RE-Zn ont également été formulées via l'équation Neumann-Kopp. Les capacités de calorifiques calculées sont en excellent accord avec celles mesurées pour les composes YZn, Y2Zn17, Gd2Zn17, TbZn, Tb2Zn17, HoZn et Yb2Zn17, ce
qui indique la validité de l'équation Neumann-Kopp pour ces composés. On peut donc également supposer que l'équation Neumann-Kopp est valide pour tous les composés dans le système binaire RE- Zn et ternaire RE-Mg-Zn.
Le troisième article (chapitre 6) présente la modélisation thermodynamique et l’étude in situ du système Ce-Mg-Zn par diffraction de neutrons. L'article a été soumis à la revue Acta Materialia. Il n’existe aucune donnée thermodynamiques pour le système Ce-Mg-Zn dans la littérature. Toutes les sections isothermes et isoplèthes existantes ont été prises en compte dans l'optimisation thermodynamique. Les structures cristallines de toutes les phases ont été analysées de façon critique et des modèles thermodynamiques appropriés ont été choisis pour ces phases. Toutes les phases ternaires existantes (τ1 à τ7 dans la présente étude) ont été examinées. En outre, les phases binaires et CeZn et CeMg ont été modélisées comme une solution; la solubilité du zinc dans les phases CeMg3 et CeMg12 ainsi que la solubilité du magnésium dans τ1 et τ3 a été prises
en compte. On a supposé que toutes les autres phases binaires ne sont étendues dans la région ternaire et toutes les autres phases ternaires ont été supposées être stœchiométriques. Des expériences in-situ de diffraction des neutrons (ND) ont été réalisées sur des échantillons pour étudier les transitions de phases afin de valider ainsi que d'affiner la modélisation thermodynamique. Ainsi, quatre échantillons ont été sélectionnés en se basant sur l'optimisation préliminaire. Tous les échantillons sont situés dans les régions triphasées car ils sont censés présenter le plus grand nombre de transitions, ce qui permet d’obtenir plus d'informations. Pour chaque échantillon des spectres de diffraction ont été prélevés tous les 5 °C, tout en étant refroidi à partir de l'état liquide; les séquences des températures de transition et des précipitations ont été obtenus par l'analyse des spectres de diffraction. Tous les paramètres du modèle ont été finalisés en tenant compte des données ND.
Le quatrième article (chapitre 7) présente la modélisation thermodynamique et d'étude in situ du système Nd-Mg-Zn par diffraction de neutrons. L'article a été également soumis à la revue Acta Materialia. Les phases correspondant à la plupart des phases ternaires observées dans le système Ce-Mg-Zn (τ2, τ3, τ4, τ5 et τ7) ont également été observées dans le système Nd-Mg-Zn. L'existence de la phase τ1 est encore incertaine et aucune étude n'a été effectuée dans le domaine de composition où τ6 pourrait exister. Les deux phases n’ont également pas été observées dans aucun autre des systèmes RE-Mg-Zn. Par conséquent, ils n’ont pas été pris en compte dans la présente optimisation. Tous les systèmes RE-Mg-Zn ont été optimisés simultanément et des tendances établies pour les systèmes binaires Zn-RE ont été utilisés. Les expériences in situ de ND ont été également effectuées sur des échantillons du système Nd-Mg-Zn. Les données ND dans cette étude ont été privilégiées dans l'optimisation thermodynamique car les expériences ont été réalisées à haute température avec la présence de la phase liquide. En outre, en raison de la force de pénétration élevée des neutrons, de grands échantillons ont été utilisés dans les expériences de ND, conduisant à un meilleur contrôle de la composition et une résistance accrue à l'oxydation. La plupart des données expérimentales (en particulier les données du liquidus) obtenues dans la littérature ainsi que les expériences actuelles de ND ont été bien reproduites.
Dans le cinquième article (chapitre 8) la modélisation thermodynamique des systèmes légers RE-Mg-Zn (La-Mg-Zn, Pr-Mg-Zn et Sm-Mg-Zn) sont présenté. Le système Sc-Mg-Zn n'a pas été optimisé lors de cette étude, car aucune étude expérimentale n'a été trouvée dans la littérature. Puisque le système binaire Sc-Zn est différent des autres systèmes RE-Zn, le système ternaire Sc-Mg-Zn devrait donc être différent des autres systèmes ternaires RE-Mg-Zn. Par conséquent, il est impossible de proposer des phases ternaires dans le système Mg-Sc-Zn. Le système Pm-Mg-Zn n’a également pas été pris en compte dans la présente étude car la description thermodynamique du système Pm-Mg n’est pas disponible. Seule une phase ternaire (phase V) a été observée dans le système ternaire La-Mg-Zn et cette phase est différente des phases des systèmes ternaires Ce-Mg-Zn et Nd-Mg-Zn. La phase τ3 est supposé exister dans tout les systèmes RE-Mg-Zn a donc également été supposer exister dans le système La-Mg-Zn. Une lacune de démixtion entre LaZn et LaMg a été observée. Cependant, les deux phases ont une fois de plus été modélisées comme des phases solutions solides étendues pour être compatible avec d'autres systèmes ternaires RE-Mg-Zn. Les systèmes Pr-Mg-Zn et Sm-Mg-Zn sont similaires aux systèmes Ce-Mg-Zn et Nd-Mg-Zn. L'optimisation des systèmes Pr-Mg-Zn et Sm-Mg-Zn est
grandement facilitée par l'optimisation simultanée d'autres systèmes RE-Mg-Zn, en particulier les systèmes Ce-Mg-Zn et Nd-Mg-Zn.
Le sixième article (chapitre 9) présente la modélisation thermodynamique des systèmes plus lourds RE-Mg-Zn (Gd-Mg-Zn, Tb-Mg-Zn, Dy-Mg-Zn, Ho-Mg-Zn, Er-MG Zn, Tm-Mg-Zn, Lu-Mg-Zn et Y-Mg-Zn). Les systèmes RE-Mg-Zn sont semblables les uns aux autres, mais différents des systèmes plus légers RE-Mg-Zn. Les systèmes Eu-Mg-Zn et Yb-Mg-Zn ne furent pas optimisés car aucune étude expérimentale ne fut effectuée pour les deux systèmes. En outre, les éléments Eu et Yb sont différents des autres éléments de terres rares; il est donc impossible de proposer des phases dans les systèmes ternaires Eu-Mg-Zn et Yb-Mg-Zn. La périodicité au sein de la phase ordonnée (phase LPSO, notée X dans la présente étude) et la phase icosaédrique (notée phase I) sont supposées exister dans tous les systèmes lourd RE-Mg-Zn. La phase τ3, une phase commune dans tous les systèmes RE-Mg-Zn, furent également considéré dans les systèmes plus lourd RE-Mg-Zn. Le système Y-Mg-Zn a été étudié par plusieurs auteurs. Toutes les données expérimentales ont été prises en compte dans la présente étude et une amélioration significative a été obtenue pour ce système. Toutes les sections isoplèthes et isothermes disponibles dans la littérature reproduits avec un bon accord.
Des informations détaillées sur le modèle semi-empirique de Miedema sont présentées dans l'annexe 1; Des exemples d'application de la base de données RE-Mg-Zn sont présentés à l'annexe 2; L'annexe 3 présente tous les spectres de diffraction de neutrons mesurés lors de cette étude; Les coefficients de dilatation thermique linéaire de Ta et Mo à haute température sont calculés à partir des spectres ND et figurent à l'annexe 4; enfin les calculs de la projection du liquidus ainsi que des réactions invariantes de tous les systèmes RE-Mg-Zn sont présentés à l'Annexe 5.
TABLE OF CONTENTS
DEDICATION ... III ACKNOWLEDGEMENTS ... IV RÉSUMÉ ... VI ABSTRACT ... VIII CONDENSÉ EN FRANÇAIS ... X TABLE OF CONTENTS ... XVII LIST OF TABLES ... XXIV LIST OF FIGURES ... XXVI LIST OF SYMBOLS ...XXXV LIST OF ABBREVIATIONS ... XXXVI LIST OF APPENDICES ... XXXVIIChapter 1 INTRODUCTION ... 1
1.1 The CALPHAD method ... 6
1.2 Thermodynamic modelling ... 8
1.2.1 Elements ... 8
1.2.2 Compounds ... 8
1.2.3 Terminal solid solutions ... 9
1.2.4 Compound energy formalism (CEF) ... 9
1.2.5 Modified Quasichemical Model ... 10
1.3 In-situ neutron diffraction ... 14
1.4 Objective of the present project ... 16
Chapter 2 LITERATURE REVIEW ... 17
Chapter 4 ARTICLE 1: CRITICAL ASSESSMENT AND OPTIMIZATION OF PHASE DIAGRAMS AND THERMODYNAMIC PROPERTIES OF RE-ZN SYSTEMS-PART I:
SC-ZN, LA-SC-ZN, CE-SC-ZN, PR-SC-ZN, ND-SC-ZN, PM-ZN AND SM-ZN ... 31
4.1 Introduction ... 31
4.2 Phase equilibrium and thermodynamic data ... 33
4.2.1 Sc-Zn system ... 33 4.2.2 La-Zn system ... 38 4.2.3 Ce-Zn system ... 43 4.2.4 Pr-Zn system ... 45 4.2.5 Nd-Zn system ... 46 4.2.6 Pm-Zn system ... 48 4.2.7 Sm-Zn system ... 48 4.3 Thermodynamic modeling ... 49 4.3.1 Elements ... 49 4.3.2 Compounds ... 49
4.3.3 Terminal solid solutions ... 49
4.3.4 Liquid solutions ... 50 4.4 Optimizations ... 52 4.5 Discussion ... 57 4.6 Conclusions ... 61 Acknowledgements ... 61 References ... 62
Chapter 5 ARTICLE 2: CRITICAL ASSESSMENT AND OPTIMIZATION OF PHASE DIAGRAMS AND THERMODYNAMIC PROPERTIES OF RE-ZN SYSTEMS-PART II-Y-ZN, EU-II-Y-ZN, GD-II-Y-ZN, TB-II-Y-ZN, DY-II-Y-ZN, HO-II-Y-ZN, ER-II-Y-ZN, TM-II-Y-ZN, YB-ZN AND LU-ZN ... 67
5.1 Introduction ... 67
5.2 Phase equilibrium and thermodynamic data ... 74
5.2.1 Y-Zn system ... 74 5.2.2 Eu-Zn system ... 79 5.2.3 Gd-Zn system ... 79 5.2.4 Tb-Zn system ... 80 5.2.5 Dy-Zn system ... 81 5.2.6 Ho-Zn system ... 82 5.2.7 Er-Zn system ... 83 5.2.8 Tm-Zn system ... 84 5.2.9 Yb-Zn system ... 84 5.2.10 Lu-Zn system ... 85 5.3 Thermodynamic modeling ... 85 5.3.1 Elements ... 85 5.3.2 Compounds ... 85
5.3.3 Terminal solid solutions ... 86
5.3.4 Liquid solutions ... 86 5.4 Optimizations ... 87 5.5 Discussion ... 93 5.6 Conclusions ... 94 Acknowledgements ... 95 References ... 96
Chapter 6 ARTICLE 3: THERMODYNAMIC MODELING AND IN-SITU NEUTRON DIFFRACTION INVESTIGATION OF THE CE-MG-ZN SYSTEM ... 100
6.2 Phase equilibrium and thermodynamic data ... 102 6.3 Experimental investigation ... 108 6.3.1 Sample #1 (Ce40Mg10Zn50) ... 111 6.3.2 Sample #2 (Ce16Mg40Zn44) ... 112 6.3.3 Sample #3 (Ce4Mg58Zn38) ... 112 6.3.4 Sample #4 (Ce20Mg22Zn58) ... 114 6.4 Thermodynamic optimizations ... 115
6.5 Comparison of calculations with experimental data ... 117
6.6 Discussion ... 122
6.7 Conclusions ... 123
Acknowledgements ... 123
References ... 124
Chapter 7 ARTICLE 4: THERMODYNAMIC MODELING AND IN-SITU NEUTRON DIFFRACTION INVESTIGATION OF THE ND-MG-ZN SYSTEM ... 128
7.1 Introduction ... 128
7.2 Phase equilibrium and thermodynamic data ... 130
7.3 Experimental investigation ... 138 7.3.1 Sample #1 (Nd15Mg65Zn20) ... 140 7.3.2 Sample #2 (Nd16Mg37Zn47) ... 142 7.3.3 Sample #3 (Nd6Mg41Zn53) ... 143 7.3.4 Sample #4 (Nd20Mg20Zn60) ... 143 7.4 Thermodynamic optimization ... 143
7.5 Comparison of calculations with experimental data ... 146
7.6 Discussion ... 150
Acknowledgements ... 151
References ... 152
Chapter 8 ARTICLE 5: THERMODYNAMIC MODELING OF THE LA-MG-ZN, PR-MG-ZN AND SM-MG-PR-MG-ZN SYSTEM ... 156
8.1 Introduction ... 156
8.2 Phase equilibrium and thermodynamic data ... 161
8.2.1 La-Mg-Zn ... 165
8.2.2 Pr-Mg-Zn ... 166
8.2.3 Sm-Mg-Zn ... 166
8.2.4 Ternary phases considered in the present study ... 167
8.3 Thermodynamic models ... 168
8.4 Comparison of calculations with experimental data ... 172
8.4.1 La-Mg-Zn ... 172 8.4.2 Pr-Mg-Zn ... 177 8.4.3 Sm-Mg-Zn ... 179 8.5 Discussion ... 182 8.6 Conclusions ... 183 Acknowledgements ... 184 References ... 185
Chapter 9 ARTICLE 6: THERMODYNAMIC MODELING OF THE Y-MG-ZN, GD-MG-ZN, TB-MG-GD-MG-ZN, DY-MG-GD-MG-ZN, HO-MG-GD-MG-ZN, ER-MG-GD-MG-ZN, TM-MG-ZN AND LU-MG-ZN SYSTEM ... 188
9.1 Introduction ... 188
9.2 Phase equilibrium and thermodynamic data ... 198
9.2.2 Gd-Mg-Zn ... 205 9.2.3 Tb-Mg-Zn ... 205 9.2.4 Dy-Mg-Zn ... 205 9.2.5 Ho-Mg-Zn, Er-Mg-Zn, Tm-Mg-Zn and Lu-Mg-Zn ... 206 9.2.6 Ternary phases considered in the present study ... 206 9.3 Thermodynamic models ... 207 9.4 Comparison of calculations with experimental data ... 213 9.4.1 Y-Mg-Zn ... 213 9.4.2 Gd-Mg-Zn ... 222 9.4.3 Tb-Mg-Zn ... 224 9.4.4 Dy-Mg-Zn ... 224 9.4.5 Ho-Mg-Zn, Er-Mg-Zn, Tm-Mg-Zn and Lu-Mg-Zn ... 226 9.5 Discussion ... 229 9.6 Conclusions ... 229 Acknowledgements ... 230 References ... 231 Chapter 10 GENERAL DISCUSSION ... 235 CONCLUSION AND FUTURE PERSPECTIVE ... 238 BIBLIOGRAPHIE ... 241 APPENDIX 1 – MIEDEMA MODEL ... 261 APPENDIX 2 – APPLICATION OF THE DATABASE-SCHEIL COOLING SIMULATION265 APPENDIX 3 – DIFFRACTION PATTERNS OF ALL SAMPLES... 268 APPENDIX 4 – COEFFICIENT OF LINEAR EXPANSION OF TA AND MO AT HIGH TEMPERATURES ... 276
APPENDIX 5 – CALCULATED LIQUIDUS PROJECTIONS AND INVARIANT REACTIONS IN THE OPTIMIZED RE-MG-ZN SYSTEMS ... 281
LIST OF TABLES
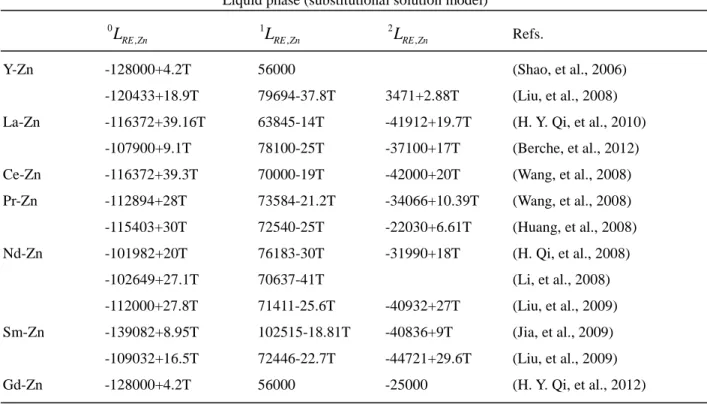
Table 2.1. The investigation status of the 17 RE-Zn systems ... 17 Table 2.2. Thermodynamic model parameters of the liquid phases of all the optimized RE-Zn
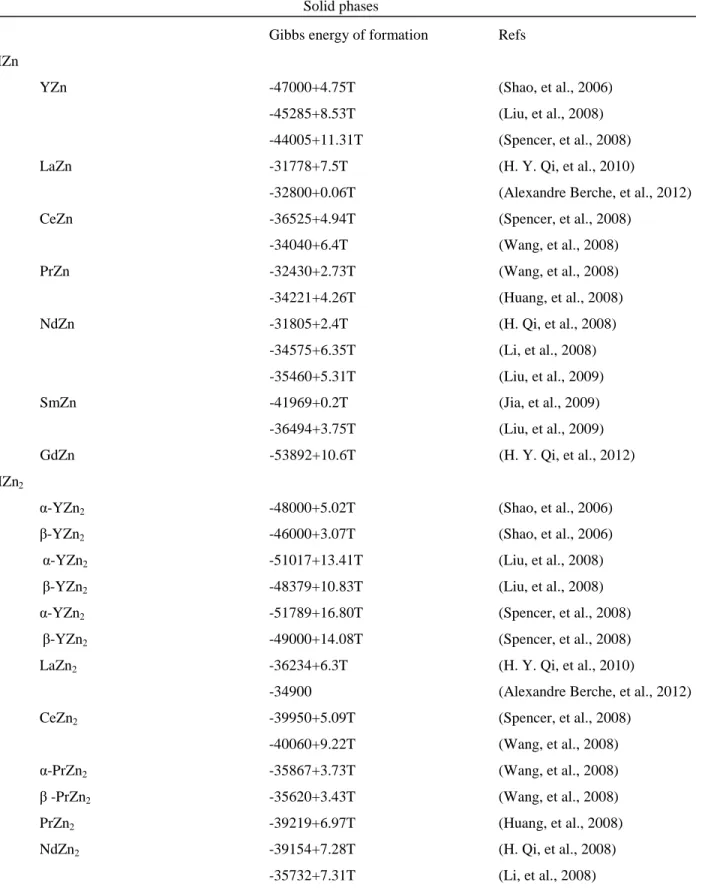
systems from the literature (J/g•atom). ... 19 Table 2.3. Thermodynamic model parameters of the solid compounds of all the optimized RE-Zn
systems from the literatures (J/g•atom). ... 23 Table 4.1 All reported stable and metastable compounds in Sc-Zn, Y-Zn and all RE-Zn systems
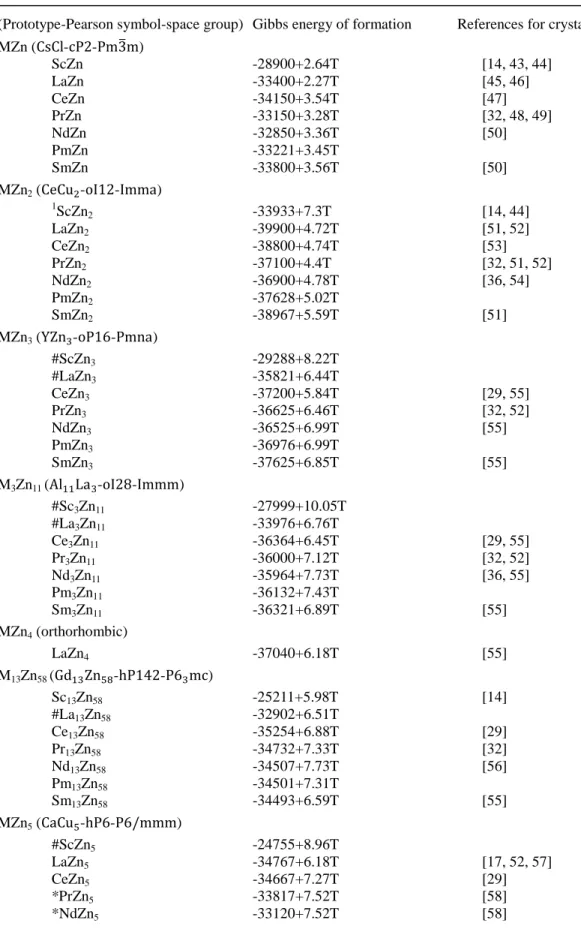
(For references see Table 1.2 or reference [12]) ... 35 Table 4.2 Optimized Gibbs energy of formation (J/g•atom) of intermetallic compounds as in
Eq(1) and references for the crystal structure. ... 55 Table 4.3 Optimized model parameters of Eq (3) for the bcc phase and optimized Modified
Quasichemical Model parameters of Eq (5) for the liquid phase in Sc-Zn, La-Zn, Ce-Zn, Pr-Zn, Nd-Pr-Zn, Pm-Zn and Sm-Zn systems (J/mol)... 57 Table 5.1 All reported stable and metastable compounds in Sc-Zn, Y-Zn and all RE-Zn systems
(For references see Table 5.2 or reference [12]) ... 77 Table 5.2 Optimized Gibbs energy of formation (J/g•atom) of intermetallic compounds as in
Eq(1) and references for the crystal structure. ... 90 Table 5.3 Optimized model parameters of Eq (3) for the bcc phase and Optimized Modified
Quasichemical Model parameters of Eq (5) for the liquid phase in Y-Zn, Eu-Zn, Gd-Zn, Tb-Zn, Dy-Tb-Zn, Ho-Tb-Zn, Er-Tb-Zn, Tm-Tb-Zn, Yb-Zn and Lu-Zn systems (J/mol). ... 93 Table 6.1Phases with ternary phase fields in the Ce-Mg-Zn system ... 104 Table 6.2. Sample compositions and transition temperatures measured in NPD experiments .... 111 Table 6.3. Thermodynamic model parameters optimized in the present work for the Ce-Mg-Zn
system ... 116 Table 6.4. Tentative calculated invariant reactions, maxima and minima and their temperatures
(oC) in the Ce-Mg-Zn system ... 122 Table 7.1. Phases with ternary phase fields in the Nd-Mg-Zn system ... 132
Table 7.2. Sample compositions and transition temperatures measured in NPD experiments .... 140 Table 7.3. Thermodynamic model parameters optimized in the present work for the Nd-Mg-Zn
system ... 145 Table 7.4. Tentative Calculated invariant reactions, maxima and minima and their temperatures
(oC) in the Nd-Mg-Zn system ... 148 Table 8.1. Phases with possible ternary phase fields in the La-Mg-Zn, Pr-Mg-Zn and Sm-Mg-Zn
systems ... 162 Table 8.2. Phases with possible ternary phase fields in RE-Mg-Zn systems as assumed in the
present project [14-16] ... 164 Table 8.3. Thermodynamic model parameters optimized or estimated in the present work for the
La-Mg-Zn, Pr-Mg-Zn and Sm-Mg-Zn systems ... 171 Table 8.4. Tentative calculated invariant reactions, maxima and minima and their temperatures
(oC) in the La-Mg-Zn system ... 177 Table 8.5. Tentative calculated invariant reactions, maxima and minima and their temperatures
(oC) in the the Pr-Mg-Zn system ... 179 Table 8.6. Tentative calculated invariant reactions, maxima and minima and their temperatures
(oC) in the the Sm-Mg-Zn system ... 182 Table 9.1 Phases with ternary phase fields in the Y-Mg-Zn, Gd-Mg-Zn, Tb-Mg-Zn, Dy-Mg-Zn,
Ho-Mg-Zn, Er-Mg-Zn, Tm-Mg-Zn and Lu-Mg-Zn systems ... 200 Table 9.2. Phases with possible ternary phase fields in RE-Mg-Zn systems as assumed in the
present project [14, 15, 16] ... 202 Table 9.3 Thermodynamic model parameters optimized or estimated in the present work for the
Y-Mg-Zn, Gd-Mg-Zn, Tb-Mg-Zn, Dy-Mg-Zn, Ho-Mg-Zn, Er-Mg-Zn, Tm-Mg-Zn and Lu-Mg-Zn systems ... 210 Table 9.4. Tentative calculated invariant reactions, maxima and minima and their temperatures
LIST OF FIGURES
Figure 1.1. Specific strength of various structural materials (Gupta & Sharon, 2011) ... 1 Figure 1.2. Specific stiffness of various structural materials (Gupta & Sharon, 2011) ... 2 Figure 1.3 Alloying behavior of Mg ... 3 Figure 1.4. A schematic diagram of the CALPHAD method (Lukas, Fries, & Sundman, 2007). ... 7 Figure 1.5. Some “geometric” models for estimating ternary thermodynamic properties from
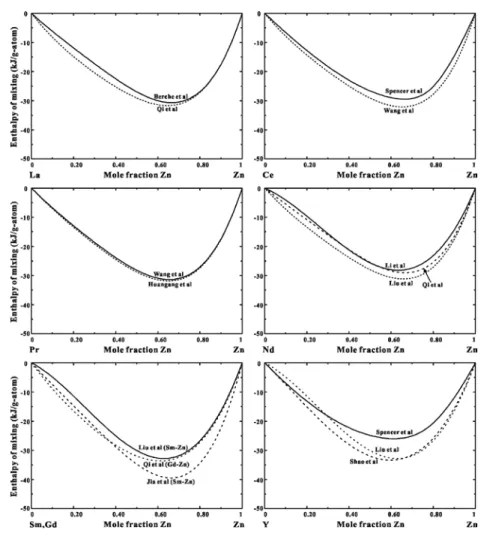
optimized binary data (A. D. Pelton, 2001). ... 14 Figure 2.1. The calculated enthalpies of formation of RE-Zn systems at 1600 oC from different
authors from the literature. ... 21 Figure 2.2. The calculated entropies of formation of RE-Zn systems at 1600 oC from different
authors from the literature. ... 22 Figure 4.1. Calculated Sc-Zn phase diagram and experimental data points [14] ... 34 Figure 4.2 Calculated La-Zn phase diagram and experimental data points [15-17, 28] ... 34 Figure 4.3 Calculated Ce-Zn phase diagram and experimental data points [29] ... 36 Figure 4.4 Calculated Pr-Zn phase diagram and experimental data points [16, 32, 33] ... 36 Figure 4.5 Calculated Nd-Zn phase diagram and experimental data points [16, 36] ... 37 Figure 4.6 Calculated Pm-Zn phase diagram ... 37 Figure 4.7 Calculated Sm-Zn phase diagram and experimental data points [16, 41] ... 38 Figure 4.8 Lattice constants of RE-Zn compounds (for references, see Table 2 and ref [12]) ... 39 Figure 4.9 Enthalpies of liquid-liquid mixing of Sc-Zn, Y-Zn and RE-Zn systems at compositions
of minimum enthalpy at 1600 oC ... 40 Figure 4.10 Emf of alloy concentration cells in the La-Zn system. Lines are calculated from the
optimized model parameters. All data are from Kovalevskii et al [23] unless otherwise indicated in the figure [20-22]. ... 41 Figure 4.11Calculated enthalpy of formation of compounds in the La-Zn system with
Figure 4.12 Heat capacity of La2Zn17 and LaZn13 reported by Morishita et al [25, 26] and as
calculated from the Neumann-Kopp equation (solid lines) ... 42 Figure 4.13 Calculated and experimental vapor pressures over liquid Ce-Zn alloys [29] ... 43 Figure 4.14 Calculated and experimental vapor pressures over two-phase Ce-Zn alloys [29] ... 44 Figure 4.15 Emf of concentration cells for the formation of CeZn11 and PrZn11 [22] ... 44
Figure 4.16 Calculated and experimental vapor pressures over liquid Pr-Zn alloys [34] ... 45 Figure 4.17 Calculated and experimental vapor pressures over two-phase Pr-Zn alloys [34] ... 46 Figure 4.18 Calculated and experimental vapor pressures over liquid Nd-Zn alloys [37] ... 47 Figure 4.19 Calculated and experimental vapor pressures over two-phase Nd-Zn alloys [37] ... 47 Figure 4.20 Calculated and experimental vapor pressures over liquid Sm-Zn alloys [41] ... 48 Figure 4.21 Calculated congruent melting points of all compounds in the Sc-Zn, Y-Zn and RE-Zn
systems. =stable compounds shown on experimental phase diagrams; =stable compounds. Melting point from interpolation or extrapolation; =metastable compounds. Melting point from interpolation or extrapolation ... 54 Figure 4.22 Calculated enthalpies of formation of compounds in the Sc-Zn, Y-Zn and RE-Zn
systems. ... 58 Figure 4.23 Calculated enthalpy of liquid-liquid mixing for Sc-Zn, La-Zn, Ce-Zn, Pr-Zn, Nd-Zn,
Pm-Zn and Sm-Zn systems at 1600 oC ... 59 Figure 4.24 Calculated entropy of liquid-liquid mixing for Sc-Zn, La-Zn, Ce-Zn, Pr-Zn, Nd-Zn,
Pm-Zn and Sm-Zn systems at 1600 oC ... 59 Figure 4.25 Calculated enthalpy of liquid-liquid mixing in the La-Zn system from different
optimizations [27, 28] ... 60 Figure 4.26 Calculated entropy of liquid-liquid mixing in the La-Zn system from different
optimizations [27, 28] ... 60 Figure 5.1(a) Calculated Y-Zn phase diagram and experimental data points [17, 18] ... 69 Figure 5.2 Calculated Eu-Zn phase diagram and experimental data points [27] ... 70
Figure 5.3 Calculated Gd-Zn phase diagram and experimental data points [27, 29] ... 70 Figure 5.4 Calculated Tb-Zn phase diagram and experimental data points [27, 32] ... 71 Figure 5.5 Calculated Dy-Zn phase diagram and experimental data points [27, 35] ... 71 Figure 5.6 Calculated Ho-Zn phase diagram and experimental data points [27, 32] ... 72 Figure 5.7 Calculated Er-Zn phase diagram and experimental data points [27, 32, 57] ... 72 Figure 5.8 Calculated Tm-Zn phase diagram and experimental data points [27] ... 73 Figure 5.9 Calculated Yb-Zn phase diagram and experimental data points [27, 41] ... 73 Figure 5.10 Calculated Lu-Zn phase diagram and experimental data points [27] ... 74 Figure 5.11 Lattice constants of RE-Zn compounds (for references, see Table 2 and ref [12]) .... 76 Figure 5.12 Calculated and experimental vapor pressures over two-phase Y-Zn alloys [17, 18] . 78 Figure 5.13 Emf of concentration cells for the formation of YZn12 and Y2Zn17 [19, 20] ... 78
Figure 5.14 Heat capacities of YZn, Y2Zn17 and YZn12 as measured [21-23] and as calculated
(solid line) from the Neumann-Kopp equation ... 79 Figure 5.15 Heat capacity of Gd2Zn17 as measured [30] and as calculated (solid line) from the
Neumann-Kopp equation ... 80 Figure 5.16 Heat capacities of TbZn and Tb2Zn17 as measured [22, 23] and as calculated (solid
line) from the Neumann-Kopp equation ... 81 Figure 5.17 Gibbs energy of formation of DyZn12 as reported [38] and as calculated from the
optimized parameters ... 82 Figure 5.18 Heat capacities of HoZn and Yb2Zn17 as measured [22, 30] and as calculated (solid
line) from the Neumann-Kopp equation ... 83 Figure 5.19 Gibbs energy of formation of ErZn12 as reported [40] and as calculated from the
optimized parameters ... 84 Figure 5.20 Calculated congruent melting points of all compounds in the Sc-Zn, Y-Zn and RE-Zn
compounds. Melting point from interpolation or extrapolation; =metastable compounds. Melting point from interpolation or extrapolation ... 88 Figure 5.21 Enthalpies of formation of compounds in the Sc-Zn, Y-Zn and RE-Zn systems ... 89 Figure 5.22 Calculated enthalpy of liquid-liquid mixing for Y-Zn, Eu-Zn, Gd-Zn, Tb-Zn, Dy-Zn,
Ho-Zn , Er-Zn, Tm-Zn, Yb-Zn and Lu-Zn systems at 1600 oC ... 94 Figure 5.23 Calculated entropy of liquid-liquid mixing for Y-Zn, Eu-Zn, Gd-Zn, Tb-Zn, Dy-Zn,
Ho-Zn , Er-Zn, Tm-Zn, Yb-Zn and Lu-Zn systems at 1600 oC ... 95 Figure 6.1 Calculated optimized isothermal section (mole fraction) of the Ce-Mg-Zn system at
350oC showing data points of Kevorkov and Pekguleryuz [15] which indicate single-phase regions. Compositions of the four samples used in the present ND experiments are also shown ... 103 Figure 6.2. Calculated optimized isopleth with constant Zn content of 24 wt.% (a) and 34 wt.%
(b) in the Ce-Mg-Zn system showing points from Drits et al [21]. ... 105 Figure 6.3. Schematic drawing of the furnace used for the ND experiments. ... 110 Figure 6.4. Selected NPD patterns for (a) Ce40Mg10Zn50, (sample #1), (b) Ce16Mg40Zn44, (sample
#2), (c) Ce4Mg58Zn38, (sample #3) and (d) Ce20Mg22Zn58, (sample #4) ... 113
Figure 6.5. Calculated optimized isopleths of the (a) Ce40Mg60-Ce40Zn60, (b) Ce16Mg84-Ce16Zn84,
(c) Ce4Mg96-Ce4Zn96 and (d) Ce20Mg80-Ce20Zn80 sections showing experimental transition
temperatures from samples #1, #2, #3 and #4, respectively ... 114 Figure 6.6. (a) Reported [20] and (b) calculated optimized isothermal section (mole fraction) of
the Ce-Mg-Zn system at 300oC showing experimental data points identified by Chiu et al [28] as lying in three-phase regions. ... 119 Figure 6.7. (a) Reported [14] and (b) calculated optimized isothermal section (mole fraction) of
the Ce-Mg-Zn system at 197oC ... 120 Figure 6.8. Calculated optimized isopleths of the (a) Ce15Mg85-Mg85Zn15 and (b) Ce65Mg35
-Mg35Zn65 sections showing data points of Chiu et al [28]. strong heating signal; strong
cooling signal; weak heating signal; weak cooling signal... 121 Figure 6.9. Tentative calculated liquidus projection for Ce-Mg-Zn system (mole fraction) ... 121
Figure 6.10. Enlargement of part of Fig. 6.9 ... 122 Figure 7.1. Calculated optimized isothermal section of the Nd-Mg-Zn system at 300oC showing
the compositions of the four samples in the present ND experiments (mole fraction). ... 130 Figure 7.2. Calculated optimized isopleths (a) from Mg-10wt.%Nd (A) to Mg-10wt.%Nd-60wt.%Zn (B), (b) from Mg-20wt.%Zn (A) to Mg-20wt.%Zn-30wt.%Nd (B) and (c) from Mg-20wt.%Nd (A) to Mg-30wt.%Zn (B) in the Nd-Mg-Zn system showing points from Drits et al [24] ... 134 Figure 7.3. Reported isothermal section of Nd-Mg-Zn system at 320oC from Xu et al [17] (mole
fraction). (Note: phase names τ1 to τ7 are those of the authors [17]) ... 136 Figure 7.4. Reported isothermal section of Nd-Mg-Zn system at 300oC from Mostafa and Medraj
[18] (mole fraction). (Note: names of the ternary phases are those used in the present study) ... 136 Figure 7.5. Selected ND patterns for (a) Nd15Mg65Zn20 (sample #1), (b) Nd16Mg37Zn47 (sample
#2), (c) for Nd6Mg41Zn53 (sample #3) and Nd20Mg20Zn60 (sample #4) ... 141
Figure 7.6. Calculated optimized isopleths of the (a) Nd15Mg85-Nd15Zn85, (b) Nd16Mg84
-Nd16Zn84, (c) Nd6Mg94-Nd6Zn94 and (d) Nd20Mg80-Nd20Zn80 sections showing experimental
transition temperatures from samples #1, #2, #3 and #4, respectively ... 142 Figure 7.7. Calculated optimized isothermal section of the Nd-Mg-Zn system at 427oC. The
Nd(Mg,Zn)12 phase is stable at this temperature according to the calculations. (mole fraction)
... 147 Figure 7.8. Tentative calculated liquidus projection for Nd-Mg-Zn system (mole fraction) ... 149 Figure 7.9. Enlargement of part of Figure 7.8 ... 149 Figure 8.1. Calculated optimized Mg-Zn phase diagram [7] ... 158 Figure 8.2. Calculated optimized Mg-La phase diagram [8] ... 158 Figure 8.3. Calculated optimized La-Zn phase diagram [12] ... 159 Figure 8.4. Calculated optimized Mg-Pr phase diagram [8] ... 159 Figure 8.5. Calculated optimized Pr-Zn phase diagram [12] ... 160
Figure 8.6. Calculated optimized Mg-Sm phase diagram [8] ... 160 Figure 8.7. Calculated optimized Sm-Zn phase diagram [12] ... 161 Figure 8.8. Calculated enthalpies of formation for compounds in the Y-Mg-Zn and RE-Mg-Zn
systems. Trends are very similar to those established in our previous work on the binary systems [12, 13] (The Eu-Mg-Zn and Yb-Mg-Zn systems are not considered in the present work thus the anomalies cannot be seen from the figure). ... 172 Figure 8.9. Calculated optimized (above) isothermal section of the La-Mg-Zn system at 300oC
and reported (below) isothermal section of the La-Mg-Zn system at 322oC [21] (mole fraction). ... 174 Figure 8.10. Calculated optimized isopleth from Mg-10wt.% La (A) to Mg-30wt.% Zn (B) in the
La-Mg-Zn system showing points from Dobatkina et al [17, 18] ... 175 Figure 8.11. Calculated optimized isopleth from Mg-30wt.% Zn (A) to Mg-15wt.% La-30wt.%
Zn (B) in the La-Mg-Zn system showing points from Dobatkina et al [17, 18] ... 175 Figure 8.12. Tentative calculated liquidus projection for La-Mg-Zn system (mole fraction) ... 176 Figure 8.13. Enlargement of part of Fig. 8.12 ... 176 Figure 8.14. Calculated optimized isothermal section of the Pr-Mg-Zn system at 300oC (mole
fraction) ... 177 Figure 8.15. Tentative calculated liquidus projection of the Pr-Mg-Zn system (mole fraction) . 178 Figure 8.16. Enlargement of part of Fig. 8.15 ... 178 Figure 8.17. Calculated optimized isothermal section of the Sm-Mg-Zn system at 300oC (mole
fraction) ... 180 Figure 8.18. Calculated optimized isopleth from Mg-30wt.% Zn (A) to Mg-30wt.% Sm-30wt.%
Zn (B) in the Sm-Mg-Zn system showing points from Drits et al [23] ... 180 Figure 8.19. Calculated optimized isopleth from Mg-35wt.% Sm (A) to Mg-35wt.% Zn (B) in the
Sm-Mg-Zn system showing points from Drits et al [23] ... 181 Figure 8.20. Tentative calculated liquidus projection for Sm-Mg-Zn system (mole fraction) .... 181 Figure 8.21. Enlargement of part of Fig. 8.20 ... 182
Figure 9.1. Calculated optimized Mg-Zn phase diagram [7] ... 190 Figure 9.2. Calculated optimized Y-Mg phase diagram [9] ... 190 Figure 9.3 Calculated optimized Y-Zn phase diagram [13] ... 191 Figure 9.4 Calculated optimized Gd-Mg phase diagram [11] ... 191 Figure 9.5 Calculated optimized Gd-Zn phase diagram [13] ... 192 Figure 9.6.Calculated optimized Tb-Mg phase diagram [11] ... 192 Figure 9.7. Calculated optimized Tb-Zn phase diagram [13] ... 193 Figure 9.8. Calculated optimized Dy-Mg phase diagram [11] ... 193 Figure 9.9. Calculated optimized Dy-Zn phase diagram [13] ... 194 Figure 9.10. Calculated optimized Ho-Mg phase diagram [11] ... 194 Figure 9.11. Calculated optimized Ho-Zn phase diagram [13] ... 195 Figure 9.12. Calculated optimized Er-Mg phase diagram [11] ... 195 Figure 9.13. Calculated optimized Er-Zn phase diagram [13] ... 196 Figure 9.14. Calculated optimized Tm-Mg phase diagram [11] ... 196 Figure 9.15. Calculated optimized Tm-Zn phase diagram [13] ... 197 Figure 9.16. Calculated optimized Lu-Mg phase diagram [11] ... 197 Figure 9.17. Calculated optimized Lu-Zn phase diagram [13] ... 198 Figure 9.18. Calculated enthalpies of formation for compounds in the Y-Mg-Zn and RE-Mg-Zn
systems. Trends are very similar to those established in our previous work on the binary systems [12, 13] (The Eu-Mg-Zn and Yb-Mg-Zn systems are not considered in the present work thus the anomalies cannot be seen from the figure). ... 212 Figure 9.19 Calculated optimized isothermal section of the Y-Mg-Zn system at 600oC. three-phase equilibria confirmed by Tsai et al [21] (mole fraction). ... 213 Figure 9.20 Calculated optimized isothermal section of the Y-Mg-Zn system at 500oC. three-phase equilibria confirmed by Tsai et al [21] (mole fraction). ... 214
Figure 9.21 Calculated optimized isothermal section of the Y-Mg-Zn system at 400oC. three-phase equilibria confirmed by Tsai et al [21] at 427oC (mole fraction). ... 214 Figure 9.22 Calculated optimized isothermal section of the Y-Mg-Zn system at 300oC (mole
fraction). ... 215 Figure 9.23 Calculated optimized isopleth between Mg and the X phase showing points from
Padezhnova et al [22]. ... 215 Figure 9.24 Calculated optimized isopleth from Mg-18wt.%Y (A) to Mg-18 wt.%Y-28wt.%Zn
(B) in the Y-Mg-Zn system showing points from Padezhnova et al [23] ... 216 Figure 9.25 Calculated optimized isopleth from Mg-29wt.%Zn (A) to Mg-18 wt.%Y-29wt.%Zn
(B) in the Y-Mg-Zn system showing points from Padezhnova et al [23] ... 216 Figure 9.26 Calculated optimized Mg50Zn50-Y10Mg30Zn60 isopleth showing points from
Langsdorf et al [33]. ... 217 Figure 9.27 Calculated optimized Mg60Zn40-Y10Mg30Zn60 isopleth showing points from
Langsdorf et al [33]. ... 217 Figure 9.28 Calculated optimized Mg80Zn20-Y10Mg80Zn10 isopleth from the present work
compared to that of Gröbner et al [53]. Data points are also from ref [52]. (Note that in ref [52] the 18R and 14H phases correspond to the X phase in the present study; the W, H and Z phases correspond to the τ3, YZn5and τ5 phases, respectively) ... 219
Figure 9.29 Calculated optimized Mg-Y10Mg80Zn10 isopleth from the present work compared to
that reported by Gröbner et al [53]. Data points are also from ref [52]. (Note that in ref [52] the 18R and 14H phases correspond to the X phase in the present study and the W phase corresponds to τ3) ... 220 Figure 9.30 Tentative calculated liquidus projection of the Y-Mg-Zn system (mole fraction) ... 221 Figure 9.31 Enlargement of part of Fig. 9.30 ... 221 Figure 9.32 Calculated isothermal section of the Gd-Mg-Zn system at 400oC (mole fraction) .. 223 Figure 9.33 Calculated isothermal section of the Gd-Mg-Zn system at 300oC (mole fraction) .. 223 Figure 9.34 The calculated isothermal section of Tb-Mg-Zn system at 300oC (mole fraction) .. 224
Figure 9.35 The calculated isothermal section of Dy-Mg-Zn system at 300oC (mole fraction) .. 225 Figure 9.36 The calculated isothermal section of Dy-Mg-Zn system at 300oC in the Mg-rich
region along with experimental data from Rokhlin et al [40] (mole fraction). Data points in a three-phase region; Data points in a two-phase region ... 225 Figure 9.37 Calculated optimized isopleths from Mg-39wt.% Dy (A) to Mg-39wt.% Zn (B) in the
Dy-Mg-Zn system showing points from Rokhlin et al [40]... 226 Figure 9.38 Calculated isothermal section of the Ho-Mg-Zn system at 300oC (mole fraction) .. 227 Figure 9.39 Calculated isothermal section of the Er-Mg-Zn system at 300oC (mole fraction) ... 227 Figure 9.40 Calculated isothermal section of the Tm-Mg-Zn system at 300oC (mole fraction) .. 228 Figure 9.41 Calculated isothermal section of the Lu-Mg-Zn system at 300oC (mole fraction) ... 228
LIST OF SYMBOLS
at.% Atomic percent
cp Molar heat capacity (J/mol-K)
0
i
g Molar Gibbs energy of component i (J/mol) 0
h
∆ Molar enthalpy of formation (J/mol)
i
n Number of moles of component i in a solution
ij
n Number of moles of i-j pairs in a solution
R The ideal gas constant T Abosolute temperature (K)
wt.% Weight percent
i
X Mole fraction of i
ii
X Pair fraction of i-i pair
ij
X Pair fraction of i-j pair
i ii
Z Coordination number of i, when all the nearest neighbors of an i are i’s
i ij
Z Coordination number of i, when all the nearest neighbors of an i are j’s
0
s
∆ Molar entropy of formation (J/mol) config
S
∆ Configurational entropy of mixing of a solution (J/K) AB
g
∆ Non-configurational Gibbs energy change for the formation of two moles of (A-B) pairs (J/mol)
LIST OF ABBREVIATIONS
BWM Bragg-Williams Model
CALPHAD CALculation of PHAse Diagram CEF Compound Energy Formalism DFT Density Functional Theory
DSC Differential Scanning Calorimentry DTA Differential Thermal Analysis
EDS Energy Dispersive X-Ray Spectrometry EMF Electromotive Force
EPMA Electron Probe Microanalysis ICP Inductively Coupled Plasma
LPSO phase Long-period Stacking Ordered phase
MQM (MQMPA) Modified Quasichemical Model in the Pair Approximation
ND Neutron Diffraction
RE Rare Earth
SEM Scanning Electron Microscopy SRO Short-Range Order
SGTE Scientific Group Thermodata Europe XRD X-Ray Diffraction
LIST OF APPENDICES
APPENDIX 1 MIEMEMA MODEL ... 262 APPENDIX 2 APPLICATION OF THE DATABASE-SCHEIL COOLING SIMULATION 266 APPENDIX 3 DIFFRACTION PATTERNS OF ALL SAMPLES... 269 APPENDIX 4 COEFFICIENT OF LINEAR EXPANSION OF TA AND MO AT HIGH TEMPERATURES ... 277 APPENDIX 5 CALCULATED LIQUIDUS PROJECTIONS AND INVARIANT
Chapter 1 INTRODUCTION
Magnesium is the eighth most abundant element (Mg, 1.87 wt.%) in the earth’s crust (Yaroshevsky, 2006), next to oxygen (O, 47 wt.%), silicon (Si, 29.5 wt.%) , aluminium (Al, 8.05 wt.%), iron (Fe, 4.65 wt.%), calcium (Ca, 2.96 wt.%), sodium (Na, 2.5 wt.%) and potassium (K, 2.5 wt.%). It is more abundant than titanium (Ti, 0.45 wt.%). These nine elements constitute ~99.5 wt.% of the earth’s crust. Thanks to their availability, Al, Fe and Mg alloys are the most widely used structural materials (Na and K cannot be used as structural materials, Ti is too expensive).
To decrease growing environmental impact, reduction of emissions becomes more important for human habitation of the planet. As a result, the use of light materials in the transportation sector is generally viewed as becoming of key importance in the future. Of all structural materials mentioned above, Mg has the lowest density (1.738 g/cm3 for pure Mg, 7.874 g/cm3 for pure Fe, 2.700 g/cm3 for pure Al, 4.507 g/cm3 for pure Ti (Winter, 1993)). Figs. 1-2 show the specific strength and stiffness of various structural materials. Among these, Mg alloys have the highest specific stiffness and the second highest specific strength, inferior only to Ti alloys. Mg alloys also have high damping properties, good casting ability etc.
Figure 1.2. Specific stiffness of various structural materials (Gupta & Sharon, 2011)
In the past, the development of magnesium alloys was driven by the potential for lightweight construction materials in military applications. Although magnesium alloys are still used to reduce weight today, the purpose has changed: people are focusing on the more economic use of fuel and lower emissions in a time of growing environmental impact.
Because of its poor mechanical properties, pure Mg must be alloyed with other elements in order to be used as a structural material. Mg alloys can be strengthened by solid solution strengthening and precipitation hardening. According to the Hume-Rothery rules, extensive solid solution cannot be formed if the atomic size of the solvent and solute differ by more than 15%. In addition, the solvent and solute should have similar electronegativities and crystal structures. Moreover, a metal of low valence is more likely to dissolve one with higher valence. The alloying behavior of Mg with respect to atomic size, relative valence and electronegativity is shown in Fig. 3. Near 12-15% size factor, alloying elements in Mg alloys can offer considerable solid solution hardening. These alloying elements are: rare earth elements (RE), Zn, Manganese (Mn), Al etc., among which RE and Zn have hcp structures.
When the Hume-Rothery rules for solid solution formation do not hold, compound formation occurs. The most important second phases in Mg alloys are: Mg17Al12, Mg2Ca, Al2Ca,
Figure 1.3 Alloying behavior of Mg
The major alloying elements in Mg are: Al, Ca, Li, Mn, RE, Si, silver (Ag), thorium (Th), yttrium (Y), Zn and Zirconium (Zr). Of all the major alloying elements, Al, Zn, Mn, Ca and RE are the most commonly used.
Al is used as an alloying element to increase the hardness and strength of Mg alloys. Al can react with Mg to form Mg17Al12 as a strengthening phase. However, Mg17Al12 has a body
centered cubic (bcc) structure, which is different from the hexagonal close packed (hcp) Mg matrix. As a result, the Mg/Mg17Al12 interface is very fragile. Mg17Al12 also has very poor
strength (Polmear, 1996), and other alloying elements are usually added to improve the mechanical properties of Mg-Al alloys.
Ca is added in magnesium alloys to improve the creep resistance and refine the microstructure. When Ca is added to the AZ series of alloys, it can react with Al to form Al2Ca,
reducing the effect of the relatively unstable Mg17Al12 phase. The addition of Ca in AZ91 alloys
can reduce the tensile strength and elongation at ambient temperature while increasing the strength at elevated temperature (Qudong et al., 2001). The amount of Ca in Mg alloys cannot exceed 0.3 wt.% or it will reduce the weldability of Mg alloys (Avedesian & Baker, 1999).
Li is the only alloying element that can be used to reduce the density of Mg alloys below that of Mg. The addition of Li also leads to an increase in the ductility but a decrease in the strength (Avedesian & Baker, 1999).
Mn is added to MgAl and MgAlZn alloys to improve their salt water corrosion resistance. e.g. when Mn and RE are added simultaneously in AZ61 alloy, the corrosion resistance can be
improved (Zhu et al., 2013). Experiments also show that Mn can enhance the creep resistance of Mg over a wide temperature range (100-225oC) (Celikin, Kaya, & Pekguleryuz, 2012).
Zr is a very common alloying element. It is used in many alloys (including, but not limited to, Mg alloys) to help refine the grain size. However, one should avoid using Zr in Mg alloys containing Al and Mn, as Zr can form stable compounds with these two alloying elements. The addition of Zr can increase the tensile strength while retaining the ductility of Mg alloys.
Si is one of the cheapest alloying elements. It decreases the castability of Mg alloys but increase the creep resistance.
Ag can be used together with RE elements to improve the high temperature strength and creep resistance of Mg alloys (Avedesian & Baker, 1999).
Th is added in Mg alloys to increase high temperature strength and creep resistance. Th is also very similar to RE elements, as they lie in the same group in the periodic table. However, the use of Th has been phased out due to its radioactive nature.
The addition of RE elements into Mg alloys can increase significantly the high temperature strength and creep resistance, either by solution strengthening or precipitation hardening. RE elements can also weaken the texture of Mg alloys and thus increase their deformability and workability. A possible reason is that the addition of RE changes the stacking fault energy in Mg alloys (Agnew, 2001). The addition of RE can also change the surface composition of the Mg alloy, modifying the driving force for corrosion and oxidation and thus increasing corrosion resistance. RE elements are costly and they are used primarily in high-tech alloys. The most commonly used RE elements are Y, La, Ce, Pr, Nd, Sm and Gd etc. Sc and Y have properties very similar to RE elements and they are generally treated as RE elements (Sc as a lighter-RE element, Y as a heavier-RE element).
Zn is one of the most widely used alloying elements in Mg alloys. The AZ series Mg alloys are the most widely used Mg alloys in which Al and Zn are the major alloying elements. The four criteria of Hume-Rothery rules are satisfied when Zn is added to Mg alloys (the size difference is between 15% and 20%; this may be rather large but the other three criteria are perfectly satisfied). Consequently, solution strengthening can be expected. As shown in Fig. 3, Zn and RE elements (Y, Gd, Tb, Dy, Ho, Er, Tm and Lu etc., which have an hcp structure) are the most effective alloying elements in Mg as far as solution strengthening is concerned. Zn is much
cheaper than RE, making it the most commonly used alloying element offering solution strengthening in Mg alloys.
The mechanical properties of Mg alloys can be significantly improved with the addition of Zn and RE. It is reported that the hot rolled sheet of Y3Mg94Zn3 exhibited yield strength of
380Mpa and an elongation of 6%.
Nowadays Mg alloys are used mainly in the automobile industry for the purpose of fuel saving via weight reduction. Many components are made of Mg alloys: instrument panel beams, cam covers, steering wheel armatures, steering column supports, seats, transfer cases, and housings and brackets (Luo, 2000). None of these components is used at elevated temperatures. Commonly used Mg alloys in these components are the AZ (Mg-Al-Zn) and AM (Mg-Al-Mn) series. The strengthening phase in these alloys is Mg17Al12, which softens above 150oC (P.
Zhang, 2005).
To further reduce the weight of vehicles, more Mg alloys should be introduced. Mg alloys to be used at elevated temperatures are in demand (in the powertrain system, engine pistons can operate up to 300oC, engine blocks up to 200oC and automatic transmission cases up to 175oC (Gupta & Sharon, 2011)). Only the Mg alloys containing Ag and RE elements can be used at temperatures exceeding 200oC (Kainer & Kaiser, 2003).
To this end, the RE-containing Mg alloys attract more and more attention. As an ongoing project at the CRCT, a thermodynamic database for Mg-RE-(Al, Zn) is being constructed using the CALPHAD method. While the Mg-RE-Al database has already been built by Liling Jin (Jin, 2012), the thermodynamic database for Mg-Zn-RE is constructed in the present project. This includes thermodynamic optimization of all Zn-RE binary systems and most Mg-Zn-RE ternary systems. The thermodynamic database for the Mg-Si-RE and Mg-Mn-RE systems was constructed by Junghwan Kim at Mcgill University.
Rare earth elements generally refer to the 15 lanthanoids: lanthanum (La), cerium (Ce), praseodymium (Pr), neodymium (Nd), promethium (Pm), samarium (Sm), europium (Eu), gadolinium (Gd), terbium (Tb), dysprosium (Dy), holmium (Ho), erbium (Er), thulium (Tm), ytterbium (Yb) and lutetium (Lu). However, according to IUPAC (Damhus, Hartshorn, & Hutton, 2005), the rare earth elements refer to 15 lanthanoids elements plus scandium (Sc) and Y. The chemical properties of Sc and Y are very similar to those of lanthanoids and it is thus very
reasonable to treat them as rare earth elements. The rare earth elements can be further divided into two groups: the lighter-rare earth elements (La, Ce, Pr, Nd, Pm, Sm and Sc) and the heavier-rare earth elements (Eu, Gd, Tb, Dy, Ho, Er, Tm, Yb, Lu and Y). Elements within the same group have more similar properties. This is evidenced when RE elements are alloyed with other elements: almost the same amount of stable compounds can be found when rare earth elements from the same group are alloyed with the same element. The amount of stable compound is usually different when rare earth elements from different groups are alloyed with the same element. The properties of Eu and Yb are somewhat different from other RE elements due to the half-filled and filled f-shells.
1.1 The CALPHAD method
The phase diagram is one of the most useful tools used in the design of new materials. In the past when computational tools were not available, phase diagrams were constructed only by experiment, which is time-consuming and costly. Hundreds of samples may be needed for the determination of a single isothermal section. Due to the development of computer technology, alloy systems (binary, ternary and multi-component) can be easily optimized with only a few key samples and various phase diagrams are readily available or can be conveniently calculated with different thermodynamic software (Factsage (Bale et al., 2002), Thermo-Calc (Andersson, Helander, Höglund, Shi, & Sundman, 2002), Pandat (Chen et al., 2002) et al) .
The CALPHAD method is shown schematically in Fig. 4. All relevant experimental data are collected and critically evaluated. These experimental data include but are not limited to the following: phase diagram, thermodynamic and crystallographic data. After critical evaluation of the data, proper thermodynamic models are chosen for each of the phases in a specific system. All this information is treated in the optimization process, in which model parameters are assigned and optimized for different phases. A reasonable fit is obtained to all experimental data. A set of self-consistent thermodynamic parameters is created which can be used to describe the system thermodynamically. Thermodynamic descriptions of high-order systems can usually be obtained by extrapolating from low-order systems when experimental data are lacking. More often than not, new parameters are added when experimental data are available for higher-order systems and parameters for lower-order systems are re-adjusted to better describe the higher-order systems.
Figure 1.4. A schematic diagram of the CALPHAD method (Lukas, Fries, & Sundman, 2007). While the general route of a thermodynamic optimization based on the CALPHAD method is schematically shown in Fig.4, the optimization of specific systems may vary. This usually depends on how much information is available for these specific systems. In the present project, as will be mentioned in the succeeding chapters, experimental data are limited and trends/similarities among all systems are utilized to make reasonable predictions of properties of the phases in different systems (i.e. enthalpies of formation, entropies of formation, melting points, etc.). The Miedema Model (Miedema, de Châtel, & de Boer, 1980) is also used in the present project to provide predicted thermodynamic data for the liquid phase in the binary systems. Information on the Miedema model used in the present project is given in Appendix 1.
![Table 4.1 All reported stable and metastable compounds in Sc-Zn, Y-Zn and all RE-Zn systems (For references see Table 1.2 or reference [12])](https://thumb-eu.123doks.com/thumbv2/123doknet/2352911.36668/72.1188.110.1061.131.602/table-reported-stable-metastable-compounds-systems-references-reference.webp)
![Figure 4.4 Calculated Pr-Zn phase diagram and experimental data points [16, 32, 33]](https://thumb-eu.123doks.com/thumbv2/123doknet/2352911.36668/73.918.181.738.547.941/figure-calculated-pr-phase-diagram-experimental-data-points.webp)
![Figure 4.5 Calculated Nd-Zn phase diagram and experimental data points [16, 36]](https://thumb-eu.123doks.com/thumbv2/123doknet/2352911.36668/74.918.182.740.102.497/figure-calculated-nd-phase-diagram-experimental-data-points.webp)
![Figure 4.15 Emf of concentration cells for the formation of CeZn 11 and PrZn 11 [22]](https://thumb-eu.123doks.com/thumbv2/123doknet/2352911.36668/81.918.183.739.586.983/figure-emf-concentration-cells-formation-cezn-przn.webp)
![Figure 4.19 Calculated and experimental vapor pressures over two-phase Nd-Zn alloys [37]](https://thumb-eu.123doks.com/thumbv2/123doknet/2352911.36668/84.918.181.745.610.1044/figure-calculated-experimental-vapor-pressures-phase-nd-alloys.webp)
![Figure 4.26 Calculated entropy of liquid-liquid mixing in the La-Zn system from different optimizations [27, 28]](https://thumb-eu.123doks.com/thumbv2/123doknet/2352911.36668/97.918.180.742.589.988/figure-calculated-entropy-liquid-liquid-mixing-different-optimizations.webp)
![[PDF] Langage de programmation Perl | Cours PDF](data:image/gif;base64,R0lGODlhAQABAIAAAP///wAAACH5BAEAAAAALAAAAAABAAEAAAICRAEAOw==)