UNIVERSITÉ DE MONTRÉAL
METABOLOMICS AND DYNAMIC METABOLIC FLUX ANALYSIS IN ABE (ACETONE-BUTANOL-ETHANOL) FERMENTATION
XINHE ZHAO
DÉPARTEMENT DE GÉNIE CHIMIQUE ÉCOLE POLYTECHNIQUE DE MONTRÉAL
THÈSE PRÉSENTÉE EN VUE DE L’OBTENTION DU DIPLÔME DE PHILOSOPHIAE DOCTOR
(GÉNIE CHIMIQUE) JUIN 2017
Cette thèse intitulée :
METABOLOMICS AND DYNAMIC METABOLIC FLUX ANALYSIS IN ABE
(ACETONE-BUTANOL-ETHANOL) FERMENTATION
présentée par : ZHAO Xinhe
en vue de l’obtention du diplôme de : Philosophiae doctor a été dûment acceptée par le jury d’examen constitué de :
M. PERRIER Michel, Ph. D., président
M. JOLICOEUR Mario, Ph. D., membre et directeur de recherche M. TAVARES Jason-Robert, Ph. D., membre
DEDICATION
during my thesis. I particularly appreciated his kind attention helping me to learn all along my thesis. I am also greatly humbled by his continuous guidance while developing and on model calibration.
I would also like to thank Jingkui Chen for his training work and all cooperation during sample analysis. I would like to thank my colleague and wife, Xiaojie Ren for her support both on work and life.
Least but not last, I would like to thank Stefan Condruz, Mayssa Kasbi, Julien Robitaille, Benoit Laflaquière and Dr. Sabine Peres for their cooperation during lab work and modeling process. Meanwhile, warm thanks to all my colleagues in the lab, especially Eric Karengera, Chi-Yuan Chang, Prajwal Kumar, Zhihui Yi, Irina Valitova and Edwige Arnold.
Finally, I must thank my mother and mother-in-law and all my family for their support to my life and study.
RÉSUMÉ
De nos jours, les hydrolysats d'hémicelluloses, des matières premières riches en glucides issues des procédés papetier et forestier, sont largement étudiés pour le développement de procédés de bioraffinerie forestière pour la production de biobutanol, un biodiésel de remplacement du pétrole. Une des avenues biotechnologiques les plus étudiées à ce jour est la fermentation ABE (acétone-butanol-éthanol) par la bactérie Clostridium acetobutylicum. Cependant, certains inhibiteurs de la fermentation ABE sont générés lors du procédé de prétraitement et d’hydrolyse, ce qui limite grandement l'utilisation de ces biomasses riches en substrats peu coûteux. D’autre part, les pratiques actuelles de culture mènent à des rendements en butanol qui ne sont pas suffisants pour assurer la mise en place d’unités industrielles de production qui soient économiquement profitables. L'objectif de ce projet de recherche visait donc à améliorer la productivité du bioprocédé de fermentation ABE, dans un contexte de bioraffinage forestier, par l’amélioration des connaissances et le développement de stratégies de culture. Un milieu synthétique contenant du xylose comme source principale de carbone a été utilisé pour simuler un hydrolysat d’hémicelluloses d’épinette noire pour un bioprocédé de fermentation avec la bactérie Clostridium acetobutylicum.
Tout d'abord, nous avons étudié l’effet d’une concentration élevée en chlorure de sodium sur le comportement du bioprocédé. En effet, une quantité élevée en hydroxyde de sodium est ajouté lors du procédé de délignification des copeaux de bois, au préalable de l’étape d’hydrolyse, cet ajout tient au fait du contrôle pH ainsi que pour son pouvoir caustique comme agent de nettoyage. Ainsi, compte tenu de l’intérêt à utiliser cette solution d’hydrolysats d’hémicellulose, il est considéré comme crucial d’évaluer l’effet de cette haute concentration en sodium sur la fermentation ABE. Une concentration seuil de sodium de 200 mM, soit ce qui est normalement mesuré en industrie, a été utilisée et comparée à une culture témoin avec la souche Clostridium acétobutylicum ATCC 824. Les résultats ont révélé que la biomasse et l'ABE étaient sérieusement inhibés par une concentration élevée en sodium, avec une diminution respectivement de 19.50 ± 0.85 % (biomasse), 35.14 ± 3.50 % (acétone), 33.37 ± 0.74 % (butanol) et 22.95 ± 1.81 % (éthanol). De manière intéressante, les productivités spécifiques cellulaires en solvants ont été maintenues comparativement à la culture témoin. Une étude approfondie du métabolisme intracellulaire a permis d’identifier que l'effet principal d’une concentration élevée en sodium se concentre principalement sur la phase d’acidogénèse, phase préalable et requise pour procéder en phase solvantogénèse lors de laquelle les solvants sont produits. Les intermédiaires métaboliques associés
hémicelluloses. Or, par un heureux hasard, les cultures implémentées initialement avec une concentration en acétate de sodium de 60 mM ont mené à la production d’une quantité élevée de riboflavine, atteignant un maximum ~ 0,2 g L-1 (0,53 mM) contre 0,057 mM dans la culture témoin, soit une augmentation d’un facteur 10x. Parallèlement à une augmentation marquée de production de riboflavine, la production de solvants et le rendement en biomasse ont même été simultanément favorisés. De façon intéressante, l'addition d'acétate a également stimulé l'accumulation intracellulaire de NADH, ce qui a pu contribuer, finalement, à affecter d’autres voies métaboliques par régulation redox. L'analyse métabolique intracellulaire a également permis de spéculer sur les flux stimulés ou inhibés en présence d’acétate et qui les métabolites accumulés lors de l’étape d’acidogénèse vers la phase de solvantogénèse pour la production de solvants.
Finalement, un modèle métabolique cinétique a été développé pour simuler ce système de production ABE coproducteur de riboflavine, et utilisé pour l'analyse de la dynamique des flux métaboliques. La cinétique de chaque flux métabolique ainsi que de la croissance de la biomasse sont décrites selon une cinétique de type Michaelis-Menten. Le mécanisme d'activation de la formation de riboflavine et de butanol par l'acétate, ainsi que les mécanismes d'inhibition de la croissance de la biomasse et l'absorption du xylose par le butanol ont été décrits. Le modèle comprend 24 réactions, 23 métabolites et 72 paramètres. La structure du modèle ainsi que la valeur de ses paramètres biocinétiques ont été déterminées en confrontant les simulations du modèle à des données expérimentales en bioréacteur de 3,5 L, en concentrant l’étude des paramètres sensibles identifiés par une étude de sensibilité. Ainsi, le modèle a montré être en mesure de simuler divers phénomènes métaboliques reliés à la transition de la phase acidogène à la phase solvantogène, soit une étape cruciale à l’induction de la production en solvants. Parallèlement, l'analyse dynamique des flux métaboliques, via les simulations du modèle, a permis de révéler que les taux de formation de riboflavine (ribA) et de guanosine triphosphate (GTP, précurseur de la riboflavine) (PurM),
étaient tous deux fortement stimulés par l'ajout d’acétate, avec une activité de 9,4 fois et 9,7 fois au moment initial, respectivement. Cette étude supporte donc notre hypothèse que l’ajout d’acétate favorise une stimulation de flux les métabolites accumulés lors de l'acidogénèse vers la production de solvants dans la phase de solvantogénèse. Enfin, une simulation différente de la concentration initiale en acétate a montré que ce modèle était robuste pour prédire l'ABE et la coproduction de riboflavine dans un milieu de culture contrôle sans ajout d’acétate.
En conclusion, cette thèse portant sur l’étude du comportement métabolique d’un bioprocédé de fermentation ABE à l’aide de Clostridium acetobutylicum ATCC 824, apporte des idées, des résultats et des outils qui contribueront à l’établissement de bioprocédés de production de biobutanol, valorisant des résidus d’hydrolysats d’hémicellulose, qui soient économiquement viables.
processes, with compounds which are inhibitors of ABE fermentation. Moreover, the productivity yields of the ABE bioprocess are still low and barely enable the economic feasibility of such a bioprocess at an industrial scale, despite the low cost of these feedstocks. Therefore, the main objective of this thesis is focused on ameliorating our fundamental knowledge of ABE fermentation in order to enable the identification of potential bioprocess improvement strategies. The aim of this research is thus to contribute to the development of biobutanol industrialization. A synthetic medium with xylose as the main carbon source was used to simulate hemicellulose hydrolysates of black spruce, used in the pulp-and-paper and forestry industries, and Clostridium acetobutylicum was the culture used to perform ABE fermentation.
In the first part, we evaluated the effect of a high sodium chloride concentration in ABE fermentation, since large amounts of sodium hydroxide are applied to wood chips during the hydrolysis process such as in delignification, pH control, and as caustic cleaning agents. These processes then artificially increase the sodium concentration of the resulting solution, and since this solution is to be used as a culture medium for ABE fermentation, it is crucial to characterize the effects of such a high sodium content. A sodium concentration of 200 mM, a level normally observed in industry, was thus assessed and compared to a control culture. The Clostridium
acetobutylicum ATCC 824 strain was studied, and a high sodium condition was shown to affect
biomass growth and ABE yield, but not the cell-specific productivity in ABE. A further metabolomics study showed that a high sodium concentration mainly influenced the acidogenic phase and biomass synthesis. The ABE fermentation process normally requires an acidogenic phase first, in order to proceed to the solventogenic phase during which solvents are produced, so during acidogenesis, high sodium conditions were shown to inhibit the intermediate metabolites concentration of the pentose phosphate pathway and glycolysis pathways of up to 80.73 1.47 % and 68.84 3.42 %, respectively. However, ATP and NADH were stimulated at high sodium,
while the NADP+-to-NADPH ratio was constant for the entire culture duration, a phenomenon which may explain the robustness of solvents’ specific productivities even under a sodium stress. In the second part, we investigated the effect of supplementing acetate on ABE fermentation, since this compound is generated in non-negligible amounts during the hemicellulose hydrolysis step. Indeed, supplementing the culture medium at 60 mM sodium acetate led to the production of a yellow sediment clearly identified as riboflavin. We thus observed that a 60 mM acetate supplementation leads to a 10-fold increase of riboflavin, reaching up to ~ 0.2 g L-1 (0.53 mM) compared to 0.057 mM in the control culture. A metabolomic study showed that acetate supplementation resulted in a higher consumption of GTP, which is the precursor of riboflavin. Moreover, solvents production and biomass yield were also promoted when adding acetate. Interestingly, acetate addition clearly stimulated the accumulation of the reduced form of nicotinamide-adenine dinucleotide (i.e. NADH), which could have affected other metabolic pathways though redox regulation mechanisms. Our metabolomic study also suggests that a high acetate condition stimulates the mobilization of various metabolic intermediates accumulated in acidogenesis towards solvents production in solventogenesis.
In the third part, a kinetic metabolic model was developed in order to better understand the effect of adding acetate by simulating the ABE-coproducing riboflavin process and performing a dynamic metabolic flux analysis. Each step in flux kinetics, as well as the biomass specific growth rate, was described using the Michaelis-Menten type approach. The activation mechanism of riboflavin and butanol formation by acetate, as well as the inhibition mechanisms of biomass growth and xylose uptake by butanol, were described. The model includes 24 reactions, 23 metabolites, and 72 parameters. Model structure as well as kinetic parameter value were determined by minimizing simulation errors of experimental data for 3.5-L bioreactor cultures at 60 mM acetate condition. Indeed, the model was shown to be capable of adequately simulating experimental data and predicting culture behavior without acetate addition, as well as the transition from acetogenesis to solventogenesis - a crucial step in the induction of solvents production. Moreover, a dynamic metabolic flux analysis suggests that the riboflavin (ribA) and guanosine triphosphate (GTP, precursor of riboflavin) formation rates (PurM) were strongly stimulated by high acetate with 9.4-fold and 9.7-9.4-fold activity early following inoculation, respectively. This in silico study further suggests that a high acetate condition stimulates fluxes which dredged accumulated metabolites in acidogenesis for solvents production.
TABLE OF CONTENTS
DEDICATION ... III ACKNOWLEDGEMENTS ... IV RÉSUMÉ ... V ABSTRACT ... VIII LIST OF TABLES ... XV LIST OF FIGURES ... XVI LIST OF SYMBOLS AND ABBREVIATIONS... XXI LIST OF APPENDICES ... XXIVCHAPTER 1 INTRODUCTION ... 1
Energy crisis and bioenergy ... 1
Biobutanol ... 2
Hemicellulose hydrolysates: feedstocks of ABE fermentation ... 3
Hemicellulose hydrolysates are xylose enriched ... 3
Various inhibitors limit the utilization of hemicellulose hydrolysates in ABE fermentation ... 5
Modeling ABE fermentation ... 8
Project objectives ... 9
Organization of the thesis ... 10
CHAPTER 2 LITERATURE REVIEW ... 12
Microbial strains and feedstocks investigated for ABE fermentation ... 12
Metabolic pathways involved in ABE fermentation ... 15
Metabolic pathway analysis ... 16
Genomic and transcriptomic analyses ... 20
Intracellular sugar phosphates and organic acids ... 28
Intracellular nucleotides ... 29
Riboflavin purification and identification ... 29
The analysis of the ABE ... 30
Acetic acid and butyric acid ... 30
Amino acids analysis ... 31
Xylose analysis ... 31
Dynamic modeling ... 32
CHAPTER 4 ARTICLE 1: A QUANTITATIVE METABOLOMICS STUDY OF HIGH SODIUM RESPONSE IN CLOSTRIDIUM ACETOBUTYLICUM ATCC 824 ACETONE-BUTANOL-ETHANOL (ABE) FERMENTATION ... 35
Abstract ... 36
Keywords ... 36
Introduction ... 37
Methods ... 39
Cell culture ... 39
Culture sampling and metabolites extraction ... 40
Analytical and calculation methods ... 41
Results and Discussion ... 41
Sodium affects biomass and ABE production metabolism ... 44
High sodium stimulates energy metabolism in acidogenesis ... 48
High sodium affects cell central carbon metabolism ... 51
The cell redox state is robustly controlled ... 58
Conclusion ... 61
Acknowledgements ... 62
Authors’ contributions ... 62
CHAPTER 5 ARTICLE 2: A DYNAMIC METABOLIC FLUX ANALYSIS OF CO-PRODUCING RIBOFLAVIN IN ABE (ACETONE-BUTANOL-ETHANOL) FERMENTATION BY CLOSTRIDIUM ACETOBUTYLICUM ATCC 824... 63
Abstract ... 64
Key words: ... 64
Introduction ... 65
Materials and methods ... 66
Cell culture ... 66
Riboflavin purification and identification ... 67
Metabolites analysis ... 68
The dynamic metabolic model ... 68
Results and Discussion ... 69
Sodium acetate induces riboflavin production in ABE fermentation ... 69
Supplementing NaAc promotes ABE fermentation ... 74
Carbon flux analysis supplementing 60 mM NaAc ... 76
Evolving from acidogenesis to solventogenesis ... 76
Central carbon metabolism slightly leaks to riboflavin synthesis ... 78
Supplementary material 1 ... 89
Model hypothesis and description ... 89
Model calibration and parameters sensitivity analysis ... 99
Supplementary material 2 ... 103
Supplementary material 3 ... 104
CHAPTER 6 GENERAL DISCUSSION ... 108
CHAPTER 7 CONCLUSION ... 113
CHAPTER 8 RECOMMENDATIONS ... 115
BIBLIOGRAPHY ... 117
LIST OF TABLES
Table 1. 1 Energy density and specific energy of butanol, ethanol and gasoline ... 2
Table 2. 1 Study of various strains in ABE fermentation ... 13
Table 2. 2 Different feedstocks and strains used along with maximum solvents and productivities achieved (Jurgens et al., 2012) ... 15
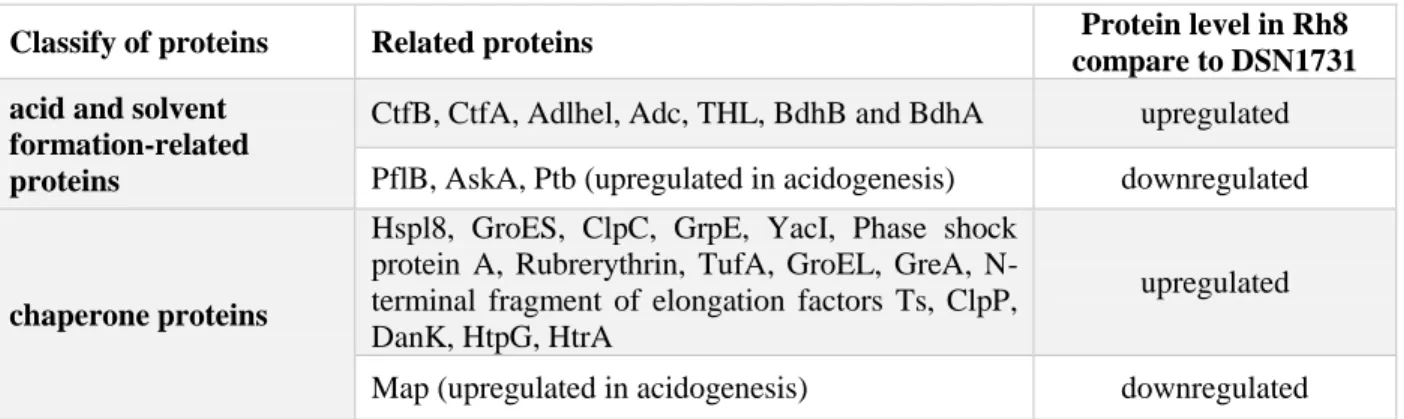
Table 2. 3 C. acetobutylicum DSM 1731 and Rh 8 strains compared for their proteins expression level (Bao et al., 2014). ... 25
Table 4. 1 Growth and productivity of C. acetobutylicum ATCC 824 batch culture on xylose with or without a 170 mM NaCl supplement. All values are maximum values taken from Figure 4.2 and Figure 4.3 or calculated using two successive points, identifying the maximum value; ± values represent standard deviation for n=3. ... 45
Table 4. 2 Energetics of C. acetobutylicum ATCC 824 batch culture on xylose with or without a 170 mM NaCl supplement. All values are maximum values taken from Figure 4.4 or calculated using two successive points, identifying the maximum value; ± values represent standard deviation for n=3... 50
Table 4. 3 C. acetobutylicum ATCC 824 content in sugar phosphates, pyruvate and redox nucleotides in batch culture on xylose with or without a 170 mM NaCl supplement. All values are maximum values taken from Figure 4.6 and Figure 4.7 or calculated using two successive points, identifying the maximum value; ± values represent standard deviation for n=3. ... 56
Table S 1. Stoichiometric of reactions in the model ... 90
Table S 2. Kinetic equations of the metabolic fluxes in the model ... 91
Table S 3. Mass balances equations of the model ... 94
Table S 4. State variables initial values ... 97
(Alriksson, 2006). ... 6 Figure 1. 5 Effect of representative lignocellulosic biomass degradation products on ABE
production in Clostridium beijerinckii 592 (Blaschek et al., 2010) ... 7 Figure 2. 1 Central metabolism of C. acetobutylicum (Lutke-Eversloh, 2014). ... 17 Figure 2. 2 Two possible mechanisms for the conversions of butyrate to butanol (Al-Shorgani et
al., 2011). ... 18 Figure 2.3 Proposed metabolic pathway for riboflavin production by Ashbya gossypii, Bacillus
subtilis, and Candida famate. (Abbreviations: G-6P, Glucose-6-phosphate; 3PG,
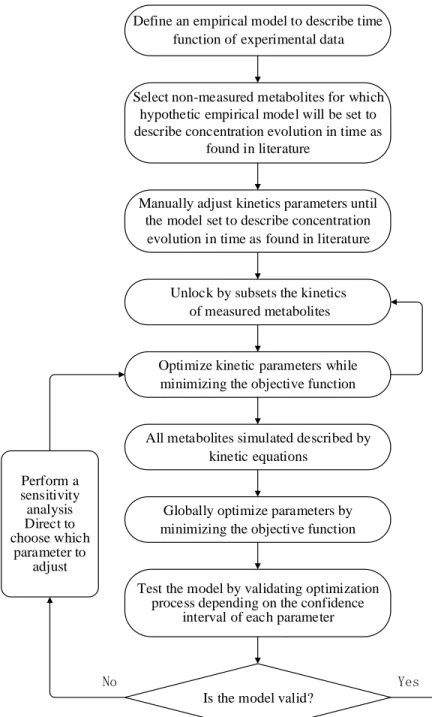
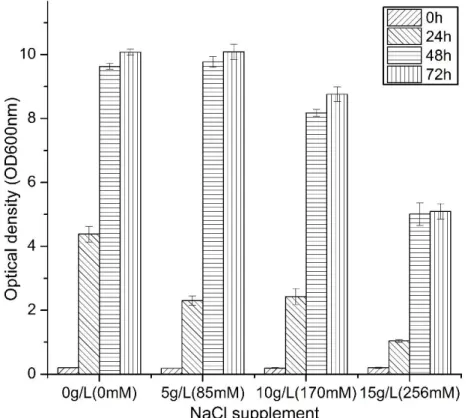
3-phosphoglycerate; PEP, Phosphoenolpyruvate; Ribu-5P, Ribulose-5-phosphate; OAA, Oxaloactate; Asp, Aspatate; Thr, Thre- onine; Gly, Glycine; Ser, Serine; GTP, Guanosine triphos-phate; GMP, Guanosine monophosphate; XMP, Xanthine monophosphate; IMP, Inosine monophosphate; DRTP, 2, diamino-6-ribosylamino-4 (3H)-pyrimidinedione 5-phosphate; ARP, 5-amino-6-ribitylamino-2, 4 (1H, 3H)-pyrimidine; DBP, L-3, 4-dihydroxy-2-butanone-4-phosphate; DMRL, 6, 7- dimethyl-8-ribityllumazine (Lim et al., 2001). ... 20 Figure 3.1 Algorithm of resolution for determining a model kinetic parameters value. ... 33 Figure 4. 1 Effect of NaCl addition to CGM medium on C. acetobutylicum ATCC 824 grown on xylose. Axis unit is optical density at 600nm. Error bars represent standard deviations from three independent replicates (n=3). ... 42 Figure 4. 2 Effect of NaCl addition on (a) C. acetobutylicum ATCC 824 biomass growth in batch
culture on xylose; (b) pH; (c) xylose concentration; (d) xylose specific consumption rate. ● 170 mM NaCl addition culture and ○ the control culture. Error bars represent standard deviations from three independent replicates (n=3). ... 43
Figure 4. 3 Effect of NaCl addition on ABE yield and specific productivity profiles on acetone (a, b), butanol (c, d), ethanol (e, f), acetic acid (g, h), butyric acid (i, j) in C. acetobutylicum ATCC 824 batch culture on xylose. ● 170 mM NaCl addition culture and ○ the control culture. Error bars represent standard deviations from three independent replicates (n=3). ... 47 Figure 4. 4 Effect of NaCl addition on C. acetobutylicum ATCC 824 energy state in batch culture
on xylose. (a) ATP; (b) ADP; (c) AMP; (d) ATP-to-(ATP+ADP+AMP) ratio. ● 170 mM NaCl addition culture and ○ the control culture. Error bars represent standard deviations from three independent replicates (n=3). ... 49 Figure 4. 5 Comparative analysis of metabolites concentration behaviour involved in C.
acetobutylicum ATCC 824 during acidogenesis with and without supplementing sodium.
Light blue shade indicates metabolites measured in this study, in which: blue-written metabolites refer to concentration decrease and red-written metabolites refer to concentration increase, all compared to control low sodium concentration, whereas black-written metabolites were not quantified being below the detection limit of the analytical method (i.e. TCA metabolites) or showing unaffected concentrations (i.e. NADP+-to-NADPH ratio) at high sodium concentration during acidogenesis. G1P: glucose 1-phosphate; G6P: glucose 6-phosphate; F6P: fructose 6-6-phosphate; X5P: xylulose 5-6-phosphate; R5P: ribose 5-6-phosphate; PYR: pyruvic acid; α-KG: α-ketoglutaric acid; SUC: succinic acid; FUM: fumaric acid; MAL: malic acid; (ISO)CIT: (iso) citric acid; Fd Ox: Ferredoxin (oxidized) ; Fd Red: Ferredoxin (reduced). ... 53 Figure 4. 6 Effect of NaCl addition on PPP and glycolysis pathway in C. acetobutylicum ATCC
824 batch culture on xylose. (a) X5P; (b) R5P; (c) F6P; (d) G6P; (e) G1P; (f) PYR. ● 170 mM NaCl addition culture and ○ the control culture. Error bars represent standard deviations from three independent replicates (n=3). ... 55 Figure 4. 7 Effect of NaCl addition on redox level and ratio on C. acetobutylicum ATCC 824 batch
orange sediment is riboflavin and white sediment is biomass. ... 70 Figure 5. 2 Metabolic pathways described in the model. The dashed line delimits the cell membrane.
... 71 Figure 5. 3 Metabolites concentrations and flux rates simulation results related to riboflavin and
acetate metabolisms for a xylose culture of C. acetobutylicum ATCC 824. Solid line refers to simulation results for the 60 mM NaAc culture and dashed line to the control culture. Solid circle is experimental data for 60 mM NaAc; open triangle is experimental data in control culture. Error bars represent standard deviations from two independent bioreactor culture replicates. (a) riboflavin; (b) acetate; (c) ribA flux rate; (d) net acetate productivity (PTA minus CoATa); (e) ribA -to- XR ratio; (f) ribA -to- the specific growth rate (µ) ratio; (g) ribA -to- PurM ratio; (h) ribA -to- BYDH ratio. ... 73 Figure 5. 4 Simulation results of biomass, solvents production and carbon consumption status for
a xylose culture of C. acetobutylicum ATCC 824. Solid line refers to simulation results for the 60 mM NaAc culture, and dashed line to the control culture. Solid circle is experimental data for 60 mM NaAc, and open triangle is experimental data in control culture. Error bars represent standard deviations from two independent bioreactor culture replicates. (a) biomass; (b) xylose; (c) butanol; (d) acetone; (e) ethanol; (f) pH. ... 75 Figure 5. 5 Dynamic metabolic flux analysis results for a xylose culture of C. acetobutylicum
ATCC 824 from model simulation. Solid line refers to simulation results for the 60 mM NaAc culture and dashed line to the control culture. (a) CoATa -to- PTA ratio; (b) CoATb -to- PTB ratio; (c) CoATa -to- CoATb ratio; (d) XR -to- (CoATa-PTA) ratio; (e) flux rate of BYDH; (f) flux rate of AYDH; (g) flux rate of AADC; (h) flux rate of CoATa. ... 77
Figure 5. 6 Simulation results of intracellular carbon metabolites for a xylose culture of C.
acetobutylicum ATCC 824. Solid line refers to simulation results for the 60 mM NaAc culture
and dashed line to the control culture. Solid circle is experimental data for 60 mM NaAc; open triangle is experimental data in control culture. Error bars represent standard deviations from two independent culture replicates. (a) X5P&Ru5P; (b) R5P; (c) F6P; (d) GTP; (e) GA3P&DHAP; (f) PYR. ... 79 Figure 5. 7 Comparison of C. acetobutylicum ATCC 824 metabolic flux distribution at 10 h and 60
h for 60 mM NaAc supplement culture (a, b) and control culture (c, d) from model simulations. Brown colour represents PPP pathway; green colour represents glycolytic pathway; red colour represents riboflavin pathway; and blue colour represents acids to solvents conversion pathway. Flux unit is in mmol gDW-1 h-1. ... 81 Figure 5. 8 Effect of NaAc on C. acetobutylicum ATCC 824 energetic state. Solid circle is
experimental data for 60 mM NaAc; open triangle is experimental data in control culture. Error bars represent standard deviations from two independent culture replicates. Error bars represent standard deviations from two independent culture replicates. (a) AMP; (b) ADP; (c) ATP; (d) GTP -to- AMP ratio; (e) GTP -to- ADP ratio; (f) GTP -to- ATP ratio. ... 82 Figure 5. 9 Effect of NaAc on C. acetobutylicum ATCC 824 redox states. Solid circle is
experimental data for 60 mM NaAc; open triangle is experimental data in control culture. Error bars represent standard deviations from two independent culture replicates. (a) NAD; (b) NADH; (c) NADP; (d) NADPH; (e) NADH -to- NAD ratio; (f) NADPH -to- NADP ratio. ... 84 Figure 5. 10 Fifteen amino acids degradation in test and control cultures in xylose by C.
acetobutylicum ATCC 824. Open square and circle symbols are two parallar test culture in 60
mM NaAc condition, triangle is control. ... 87 Figure S 1. Sensitivity analysis of model parameters for 60 mM NaAc supplemented culture. Vertical axis value represents percentage change in the objective function for parameter change from - 50 % to + 100 % around the optimized value. Parameters not shown have percentage changes less than 10 %. ... 100
Figure S 4. Riboflavin identification by comparing 60 mM sodium acetate bioreactor culture sample to pure riboflavin standard by HPLC/MS/MS analysis. Riboflavin standard analysis by (a) UV detector and (b) MS/MS, and sample analysis by (c) UV detector and (d) MS/MS. ... 103 Figure S 5. Main products, biomass, pH, and xylose consumption in two parallel batches in a 60
mM NaAc condition for the xylose culture of C. acetobutylicum ATCC 824. (a) riboflavin; (b) acetate; (c) xylose; (d) cell dry weight; (e) pH; (f) acetone; (g) butanol; (h) ethanol; (i) butyrate. ... 106 Figure S 6. Energy and redox status in two parallel batches in a 60 mM NaAc condition for a xylose
culture of C. acetobutylicum ATCC 824. (a) ATP; (b) ADP; (c) AMP; (d) GTP; (e) NAD; (f) NADH; (g) NADP; (h) NADPH. ... 106 Figure S 7. Main carbon metabolites in two parallel batches in a 60 mM NaAc condition for a
xylose culture of C. acetobutylicum ATCC 824. (a) X5P; (b) R5P; (c) PYR; (d) GA3P; (e) F6P. ... 107
LIST OF SYMBOLS AND ABBREVIATIONS
a coefficient of cell death AACoA acetoacetyl coenzyme A
AADC acetoacetate decarboxylase ACA acetoacetate
ACoA acetyl coenzyme A ADP adenosine diphosphate
𝐴𝑖 activator concentration AMP adenosine monophosphate
ATP adenosine triphosphate AYDH acetaldehyde dehydrogenase
BCoA butyryl coenzyme A
BHBD β-hydroxybutyryl-CoA dehydrogenase BYDH butyraldehyde dehydrogenase
𝐶_𝐵𝑢𝑂𝐻 butanol concentration
CoATa acetoacetyl-CoA-acetate-CoA-transferase CoATb acetoacetyl-CoA-butyrate-CoA-transferase
DNA deoxyribonucleic acid
DPO1 nucleoside-diphosphate kinase eACE extracellular acetate
eACTO extracellular acetone eBuOH extracellular butanol eBUT extracellular butyrate eCO2 extracellular carbon dioxide eEtOH extracellular ethanol
eLAC extracellular lactate ePRPO extracellular Propanol
eRIBO extracellular riboflavin eXYL extracellular xylose
F6P fructose 6-phosphate Fd Ox ferredoxin (oxidized)
𝐾𝑖𝑛ℎ𝑖𝑏𝑖𝑡𝑖𝑜𝑛 inhibition constant LDH lactate dehydrogenase
n number of substrates and co-factors involve in each reaction NAD nicotinamide adenine dinucleotide (oxidized)
NADH nicotinamide adenine dinucleotide (reduced) NADP nicotinamide adenine dinucleottide phosphate
NADPH nicotinamide adenine dinucleottide phosphate (reduced) PEP phosphoenolpyruvate
PFK phosphofructokinase
PFOR pyruvate-ferredoxin oxidoreductase PGK phosphoglycerate kinase
PK pyruvate kinase PTA phosphotransacetylase PTB phosphotransbutyrylase PurM purine metabolism
PYR pyruvate
R5P ribose 5-phosphate ribA GTP cyclohydrolase II
rpiA ribose 5-phosphate isomerase A SADH secondary alcohol dehydrogenase
𝑆𝑖 substrate of each enzyme THL thiolase
tktA transketolase
𝑉max constant of the maximum reaction rate
X biomass
X5P xylulose 5-phosphate XR xylose reductase
μ biomass specific growth rate
μmax maximum biomass specific growth rate α constant
CHAPTER 1 INTRODUCTION
Energy crisis and bioenergy
The current global warming problem has made the finding of renewable and environmentally-friendly alternative fuels a high priority. Indeed, the Kyoto Protocol, which was adopted by the UNFCCC (United Nations Framework Convention on Climate Change) in 1997 and signed by 183 countries (including Canada), aims to decrease emissions of the main anthropogenic greenhouse gases (GHGs) (www.unfccc.int). Apart from environmental pollution created by burning fossil fuels - a side effect affecting our health - energy-based conflicts also radically affect people’s lives around the world. Therefore, the energy problem is not only an important issue to national economies, but also a key for world peace and stability. Consequently, developing an alternative renewable energy source is a valuable option agreeing with the sustainable development paradigm. Bioenergy is one of the renewable energy sources with the most potential, since it is based on the transfer of free solar energy to biomass hydrocarbon-based storage through photosynthesis. Indeed, the utilization of biomass to develop an alternative economical, renewable, and environmentally-friendly energy source has been made a high priority (George W. Huber, 2006). In fact, plant (and algae) biomass is a unique sustainable resource which can be used to produce liquid transportation fuels. Although plant biomass is the largest energy storage in the world, its utilization accounts for a low level in the total world energy production (George W. Huber, 2006), and only 0.8 % of biofuels (Figure 1.1) (Popp et al., 2014). There is thus a huge potential for increasing the use of biomass as a source of bioenergy.
Biobutanol
Biobutanol, an energy efficient alternative fuel, is now considered a second-generation biofuel. Table 1.1 compares the differences between butanol, ethanol, and gasoline (Brown, 2003). In its use as a biofuel, butanol thus presents better characteristics than ethanol for many reasons. Butanol contains 25 % more energy than ethanol, and has a greater miscibility than ethanol in gasoline. The air-to-fuel ratio for butanol is close to that of gasoline, which could enable it to completely replace gasoline, so it can be directly used without any engine modifications. Butanol is less hygroscopic, has a lower vapor pressure than ethanol, and is less corrosive, which makes it easier to transport. Compared with ethanol, butanol has a higher ignition point, a supplemental trait favoring the addition of butanol into gas (Yousheng, 2009). Consequently, butanol represents a valuable biofuel of the future. In addition, ethanol fermentation processes could be retrofitted to work with butanol, since both ethanol and butanol fermentation are anaerobic processes using the same bioreactors. Therefore, the updating of biofuel production from ethanol to butanol is clearly feasible.
Table 1. 1 Energy density and specific energy of butanol, ethanol and gasoline Fuel Type Density (kg/m3) Specific energy (kJ/g) Energy content (MJ/L)
n-butanol 810 36 29.2
Ethanol 794 26.5 23.5
Gasoline 740 44 32.6
Acetone-Butanol-Ethanol (ABE) fermentation has a long history which can be traced back to 1861 when Pasteur discovered the process from anaerobic cultivation. For instance, before the 1950s,
two thirds of industrially-used butanol were produced by ABE fermentation in the USA, especially during the Second World War. However, due to the development of the petrochemical industry, the high cost of fermentative raw materials has removed it from the market.
With the development of chemical synthesis, the industry moved away from fermentation processes for economic considerations. However, because of the global warming problem, the idea of the bio-production of butanol re-emerged in recent years (Bankar et al., 2013). In 2007, the USA passed the new energy bill (H.R.6) which defined butanol as “advanced biofuel”, and moreover, the U.S. Navy has also recently cooperated with the Cobalt Technologies Company to develop biobutanol as a military and jet fuel (www.cobalttech.com). Aside from the actions of the USA, some multinational companies have also taken part in this competitive race to produce economical butanol. For instance, DuPont has joined BP, Europe's biggest oil company, to produce biobutanol and replace ethanol as a gasoline additive in the future (Hess, 2006). The current international price of biobutanol is about $4 per gallon, and the worldwide market is about 350 million gallons per year with a 3 % growth. It can be estimated that the total market value is about $2 billion per year in 2017 (Ranjan & Moholkar, 2012). Being a potential biofuel, as well as a valuable C4 feedstock for chemical synthesis, biobutanol has gained attention as its worldwide market has expanded (Bankar et al., 2013).
Hemicellulose hydrolysates: feedstocks of ABE fermentation
Hemicellulose hydrolysates are xylose enriched
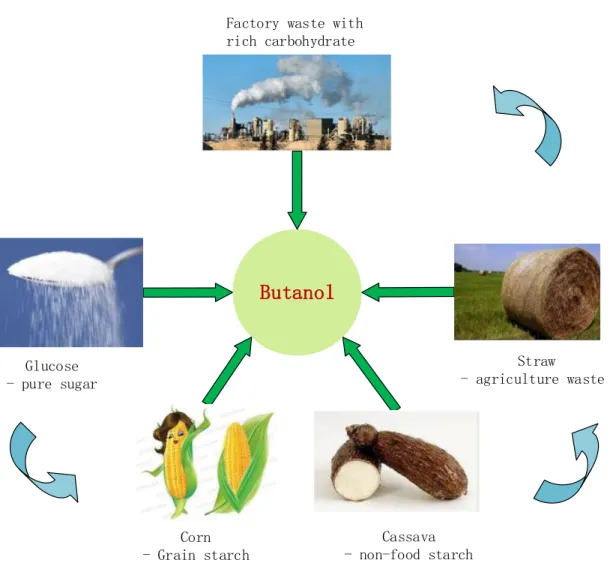
As mentioned previously, biobutanol production from sugars was commercialized at the beginning of the 20th century. In 1912, Dr. Weizmann successfully produced butanol by using starch and molasses - a cheap sugar source - and this process was widely used during the First World War. However, the cost of raw materials took up 60 % - 70 % of the entire processing cost, which seriously limited the development of the ABE fermentation industry (Liu et al., 2011). Indeed, the substrate cost had become the main bottleneck of the microbial production of butanol. With the development of fossil fuel extraction technology, ABE fermentation lost competitive potential - even corn starch still costs more than petrochemical-based processes. Clostridium species, which enable ABE fermentation, allow the use of a wide range of substrates from hexoses (glucose, fructose, etc.) and pentoses (xylose, arabinose, etc.), to starch, xylan, and other polysaccharides, to
fermentation (Zheng et al., 2009). Cassava - non-food starch Straw - agriculture waste Glucose - pure sugar Corn - Grain starch
Butanol
Factory waste with rich carbohydrate
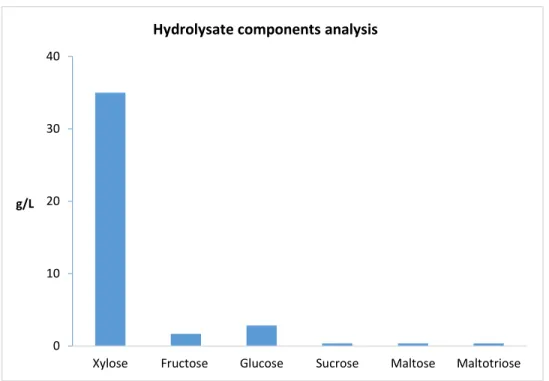
Figure 1. 3 Hydrolysate components analysis result from black liquor (Prof. Jolicoeur’s laboratory unpublished results)
Therefore, this black liquor, a waste stream from the pulp and paper industry, represents a valuable cheap source of sugar for the ABE fermentation process.
Various inhibitors limit the utilization of hemicellulose hydrolysates in
ABE fermentation
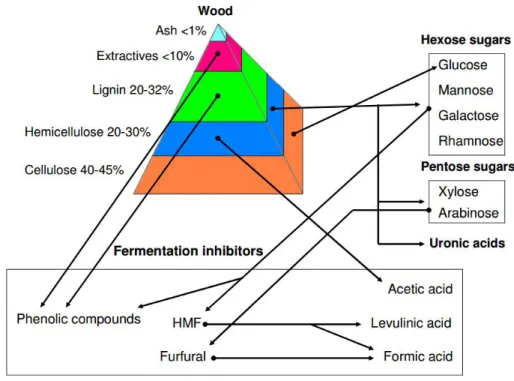
Although there are abundant amounts of cheap biomasses available as feedstocks to feed the ABE fermentation process, the breakdown of macromolecular storage sugars (e.g. cellulose, starch, lipids, etc.) is first required in order to obtain simple sugars which can be processed by microbes. For instance, the Clostridium species cannot directly use hemicellulose and lignocellulose as substrates - these first need a pretreatment consisting of enzymolysis or hydrolysis. Fermentable substrates will then become available as hexose or pentose sugars (Figure 1.4).
0 10 20 30 40
Xylose Fructose Glucose Sucrose Maltose Maltotriose g/L
Figure 1. 4 Composition of wood, and list of compounds generated from dilute-acid hydrolysis (Alriksson, 2006).
However, some compounds which are known as inhibitors of microbial development, and thus of ABE fermentation, are generated as byproducts in the pretreatment process, such as coumaric acid, ferulic acid, furfural, formic acid, and syringaldehyde (Figure 1.4). Most of them will limit ABE production at different levels, and consequently, a detoxication step is required before proceeding with fermentation.
Many researches have studied the effects of various inhibitors on ABE fermentation. Ezeji and Blaschek (2010) concluded that the main inhibitors which limit solvents generation include furfural, hydroxymethyl furfural (HMF), syringaldehyde, coumaric acid, glucuronic acid, and ferulic acid (Figure 1.5). Wang et al. (2011) also studied formic acid, another byproduct generated in the pretreatment. Since formic acid is a microscale byproduct in hydrolysate, few people have paid attention to it as an inhibitor in ABE fermentation. However, recent results have indicated that even 1 mM of formic acid can limit butanol production (Wang et al., 2011), and it has also been found that the existence of formic acid will lead to “acid crash” - a phenomenon limiting solvents generation from acids (Maddox et al., 2000).
Figure 1. 5 Effect of representative lignocellulosic biomass degradation products on ABE production in Clostridium beijerinckii 592. Lignocellulosic biomass particules of 0.5 (inclined dashed bars), 1 (white bars), 2 (light dotted bard), and 3 (dense dotted bars) mm diameters were
analyzed. (Ezeji and Blaschek, 2010)
Moreover, when using the hydrolysate of pulp and paper “black liquor” as feedstock, significant amounts of sodium hydroxide may remain with the solution since it is applied in delignification, chemical regeneration, pH control, and as a caustic cleaning agent (Murray, 1992). Among the ions with concentration increases along the various process steps enumerated above, sodium requires specific attention. Furthermore, acetate is generated during hydrolysis as a byproduct, a compound reaching up to 60 - 70 mM (Awes et al., 1998). In addition, various published works have reported that the presence of acetate in the fermentation medium could improve solvents generation effectively (Chen & Blaschek, 1999a; Chen & Blaschek, 1999b; Husemann & Papoutsakis, 1990). Indeed, in 1990, Michael. H. W. Husemann and his colleagues discovered that adding 30 mM of acetate could lead to a two-fold increase of butanol production (Husemann & Papoutsakis, 1990), and attributed this phenomenon to the acetate buffering effect and enzyme overexpression. Chih-Kuang Chen et, al., observed a modified expression of CoA transferase, acetate kinase, butyrate kinase, and phosphotransbutyrylase when adding 20 mM of sodium acetate, along with enhanced solvents production (Chen & Blaschek, 1999b). In 2009, Yang Gu et al., using cassava as a substrate to culture the Clostridium acetobutylicum EA2018 strain, found that a 30 mM acetate
accumulation of acids during the first phase, which are then consumed and transformed into solvents in the second phase. Indeed, highly regulated pathways compete for the same metabolic intermediates. Therefore, in such a complex case, a mathematical model describing cell growth and the biochemical network of reactions, from sugar substrate to solvents production, can be useful to the understanding of the phenomena involved.
Approaches such as Metabolic Flux Analysis (MFA) and Flux Balance Analysis (FBA) have been used to describe carbon flow from the substrates to the products (Stephanopoulos et al., 1998). These also allow the testing of hypotheses for the identification of branch nodes and revealing unknown fluxes, the examination of the influence of alternative pathways, and the calculation of maximum theoretical yields (Nielsen, 1998; Orth et al., 2010). In complement, the precise determination of flux rates and direction for complex systems such as reversible and cyclic reactions can be carried out by the use of isotopic tracers within labeled substrates (e.g. 13C,15N). Specifically, the FBA approach relies on objective functions looking at the optimization of specific fluxes, flux ratios, cell specific growth rate, or yields (Orth et al., 2010). Finally, the Metabolic Control Analysis (MCA) approach has been developed to evaluate the control enzymes of a metabolic network (Almaas et al., 2004; DA, 1998; Stephanopoulos et al., 1998).
However, current MFA, FBA, and MCA approaches have all been developed and applied to biosystems at a steady state. Some recent attempts have been proposed to perform a dynamic analysis adapting the FBA approach, but it is still a hybrid view with sequential steady states (Sousa et al., 2016). Indeed, past macroscopic approaches such as that initiated by Monod (Kovárová-Kovar & Egli, 1998) and which can describe kinetically a time-continuous biosystem behavior are now applied to metabolic networks (Cloutier et al., 2007; Ghorbaniaghdam et al., 2013; Leduc et al., 2006). Such dynamic models, with flux kinetics described, aim to understand the dynamic
behavior of metabolic fluxes, metabolites concentrations, and enzyme activity along with time. Dynamic models can not only be used to understand and explain key dynamic behaviors, but also to perform dynamic metabolic flux analysis, which is especially useful in various works from biomedical applications (Robitaille et al., 2015) to bioprocess optimization (Cloutier et al., 2008). Buehler and Mesbah demonstrated a dynamic metabolic model simulating continuous fermentation culture, which tried to offer insight into cell behavior for optimizing the ABE fermentation process (Buehler & Mesbah, 2016), while Shinto et al. simulated batch culture metabolism in both glucose and xylose conditions with extracellular experimental data (Shinto et al., 2008; Shinto et al., 2007). However, these models have only simulated substrates, biomass, and main products rather than any intracellular metabolites, which lacks experimental validation.
Project objectives
This work aims to characterize the performance of ABE fermentation with hemicellulose hydrolysates from pulp and paper mills using black spruce. A synthetic medium proposed in literature was complemented with xylose as the main carbon source to simulate hemicellulose hydrolysates under defined conditions. Clostridium acetobutylicum, the model species for ABE production, was used as the living biocatalyst. We have studied how the major by-products encountered industrially, from the use of sodium hydroxide in the pretreatment processes of hemicelluloses, affects solvents production and particularly butanol. This research project included the following sub-objectives.
The first sub-objective consisted of evaluating the effect of the high sodium content expected from the hemicellulose pre-treatment and hydrolysis process in solvents production. To precisely characterize how a high sodium content affects bacterial cell behavior, a metabolomic study was performed in order to identify the reaction pathways involved in ABE production inhibition. This was achieved by investigating central carbon metabolism and pathways related to solvents synthesis, including energetic and redox metabolism. This work revealed that high sodium inhibition does not directly affect ABE metabolism, but the intermediates related to biomass synthesis, which further affects solvents production yield.
A second objective then consisted of characterizing the effect of supplementing the culture medium with acetate, a by-product obtained during the hemicellulose hydrolysis process. While performing
to identify the key fluxes related to the enhancement of riboflavin as well as ABE metabolisms. Thus, this work provided a way of enhancing the bioprocess’ economic feasibility by co-producing riboflavin. The dynamic metabolic model could be further developed and serve as an in silico platform to seek the maximizing of the riboflavin-ABE fermentation yields, as well as to bring insight on potential genetic manipulations meant to improve the bioprocess yield.
Overall, this thesis has significantly contributed to the enhancement of the understanding of the ABE bioprocess using hemicellulose hydrolysates, as well as demonstrating ways to improve the economic potential of the bioprocess.
Organization of the thesis
This thesis includes eight chapters:
● In chapter one, we introduce the current situation of the expected energy crisis and the global warming problem, emphasizing the importance of developing renewable and sustainable bioenergy sources. Identified as a second-generation renewable and sustainable biofuel, butanol - which can be obtained from the bacterial fermentation of various cheap biomasses - is described. Then, the development of feedstocks for biobutanol production from ABE (including acetone-butanol-ethanol solvents) fermentation and their specific utilization are presented. A new feedstock of interest in Canada, hemicellulose hydrolysates obtained from the pulp and paper industry and studied in this thesis as a potential feedstock in ABE fermentation, is presented along with the thesis’ research problems and objectives.
● Chapter two presents a literature review on the ABE bioprocess, fermentation strains, cellular metabolisms, as well as co-products such as riboflavin. Then, literatures on proteomic,
genomic, and transcriptomic works on ABE fermentation are reviewed to draw the state-of-the-art understanding of the ABE bioprocess at the cell level. Finally, mathematical modelling approaches already used to describe ABE fermentation and others are identified as being useful to finely describe and study the metabolic link between the carbon source (i.e. xylose) and culture condition to ABE and co-product (e.g. riboflavin) production and productivity. ● Chapter three presents all the materials and methods used in this work, including metabolomic
analysis methods (intracellular and extracellular metabolites extraction and analysis), as well as the modelling methodology.
● Chapter four presents a quantitative metabolomics study of the high sodium response in ABE fermentation - work published in the Scientific Reports journal. High sodium condition has been shown to affect biomass growth with a lower activity of the central carbon metabolism, and this work suggests that performing fermentation maximizing biomass inoculum concentration may be an efficient strategy to reach expected butanol production counteracting a high sodium effect.
● Chapter five presents the development of a dynamic model describing ABE fermentation as well as riboflavin synthesis. Model simulation results suggest the validity of the dynamic model for this biosystem for the further exploration of enzyme reaction dynamics - this work is currently under submission in the Biotechnology and Bioengineering journal.
● Chapter six presents the general discussion in which this thesis’ results are analyzed in the context of the butanol market and its economic feasibility, especially from the use of hemicellulose hydrolysates. Then, the thesis’ originality and major contributions to the industrial development of ABE fermentation are presented. Finally, riboflavin production and market development are also discussed.
● Chapter seven presents the general conclusion of this thesis, and Chapter eight proposes recommendations for further work thought to improve the efficiency and economic feasibility of the ABE fermentation industrial process.
Among many, Clostridium acetobutylicum ATCC 824 and Clostridium beijerinckii NCIMB 8052 are considered to be classical species with high solvents production capability. Clostridium
acetobutylicum ATCC 824, a typical strain with completed genome sequencing, is also called the
“Weizmann Organism”. Clostridium species are strict anaerobic gram-positive bacteria (Mermelstein & Welker, 1994). During their vegetative growth, they are rod-shaped with both ends obtuse or acute, and have peritrichous flagella at one end (Mitchell, 1997). Compared to yeasts, which are used for ethanol production, Clostridium can metabolize various types of raw materials, giving a higher industrial potential.
Strain selection is a timeless step. Selected for their characteristics, such as metabolizing specific or a variety of raw materials, the appropriateness of a strain will rely on specific objectives. C.
beijerinckii BA101 and C. beijerinckii P 260 have been studied for many years and have been
demonstrated to be outstanding strains for industrialization, and C. beijerinckii BA 101 was derived before 1997 from C. beijerinckii NCIMB 8052. Based on a P2 medium containing 6 % glucose, the butanol yield can reach up to 19 g L-1, which represents an increase of 100 % compared with its parental line NCIMB 8052. C. beijerinckii BA 101 also performed efficiently in continuous culture fermentation, with a butanol yield of up to 1.74 g L-1 h-1 at a dilution rate of 0.2 h-1, while that of NCIMB 8052 was only 1.17 g L-1 h-1 (Formanek, 1997). C. beijerinckii P260, which was derived earlier in the 1950s and patented by the Commercial Solvents Corporation, reached up to 21.9 g L-1 of total solvent concentration (Ranad Shaheen, 2000).
Table 2. 1 Study of various strains in ABE fermentation
Strain Butanol
yield (g L-1) T (˚C) Reference
C. acetobutylicum ATCC 824 11-17 37
(Bankar et al., 2012; Li et al., 2010; Sun & Liu, 2012; Van der Wal et al., 2013; Yen & Wang, 2013)
C. beijerinckii NCIMB 8052 8-12.3 35-37 (Guo et al., 2011; Van der Wal et al., 2013; Zhang et al., 2012)
C. saccharoperbutylacetonicum N1-4
(ATCC 13564) 10-20.1 30
(Al-Shorgani et al., 2012; Thang et al., 2010; Zheng et al., 2013)
C. beijerinckii BA101 13-19 37 (Ezeji et al., 2007; N Qureshi, 2001) C. beijerinckii P260 14 35 (Qureshi et al., 2007)
C. beijerinckii ATCC 10132 20 37 (Isar & Rangaswamy, 2012) C. beijerinckii DSM 6423 11.2 37 (Survase et al., 2013) C. beijerinckii mutant RT66 9.3 35 (Guo et al., 2013) C. beijerinckii ATCC 55025
(derived from ATCC 4259) 8.8 37 (Liu et al., 2010) C. acetobutylicum DSM 792 9.5-11 37 (Survase et al., 2012) C. acetobutylicum B3
(CGMCC 5234) 15.4 37 (Liu et al., 2013b) C. acetobutylicum JB200
(derived from ATCC 55025) 19 37 (Xue et al., 2013) C. acetobutylicum mutant NT642
(D64) 15.4 37 (Liu et al., 2012) C. acetobutylicum BKM19
(derived from PJC4BK) 17.6 37 (Jang YS, 2013) C. acetobutylicum EA 2018
(CCTCC M94061) 13 37 (Gu et al., 2009)
C. tyrobutylicum ATCC 25755 16-20.5 37 (Yu et al., 2012; Yu et al., 2011) C. saccharobutylicum DSM 13864 13.4 35 (Ni et al., 2012; Ni et al., 2013) C. pasteurianum CH4 13.3 37 (Kao et al., 2013)
C. pasteurianum MBEL_GLY2 (derived from C. pasteurianum ATCC 6103)
10.8 37 (Malaviya et al., 2012)
Apart from Clostridium, species such as E. coli were genetically engineered for butanol production. Atsumi et al. cloned a set of genes (thl, hbd, crt, bc, etfAB and ashE2) into E. coli for butanol-specific production, with 139 mg/L of butanol produced under anaerobic conditions (Atsumi et al., 2008). Inui et al. cloned butanol-producing genes (thiL, hbd, crt, bcd-etfB-etfA, and adhe) from C.
fermentable, lead to higher yields in butanol. For instance, Clostridium acetobutylicum ATCC 824 led to 15 g L-1 and then to 16.9 g L-1 butanol with glucose (Bankar et al. 2012; Yen & Wang, 2013), while corn stover led to 10.1 g L-1 (He & Chen, 2013), 12 g L-1 on cassava (Li et al., 2012), 12 g L-1 on marine microalgae (Huesemann & Kuo, 2012), and 7 g L-1 on sugar maple wood (Sun & Liu, 2012). However, the economical evaluation must consider both the yield in butanol as well as the cost of the feedstocks per gram of butanol obtained. Jurgens et al. summarized the raw materials that have been assessed and their application in ABE fermentation (Table 2.2) (Jurgens et al., 2012).
Table 2. 2 Different feedstocks and strains used along with maximum solvents and productivities achieved (Jurgens et al., 2012)
Feedstock Hydrolysis method Strain used
Yield a (g/g)/ Productivity b (g/L/h) Total ABE (g/L) Reference
Wheat straw H2SO4, enzyme C. beijerinckii P260 0.60/0.42 25 (Qureshi et al., 2007)
Wheat straw H2SO4, enzyme C. beijerinckii P260 0.41/0.31 21.42 (Qureshi et al., 2008b) Corn fiber H2SO4 C. beijerinckii BA101 0.39/0.10 9.3
(Qureshi et al., 2008a) Palm oil mill
effluent, sago starch Enzyme C. saccharoperbutylace- tonicum N1-4 0.40/0.10 14.38 (Hipolito et al., 2008) Dried distillers’ grains and soluble (DDGS)
Ammonium fiber
expansion, enzyme C. beijerinckii BA101 0.34/0.14 10.4
(Ezeji & Blaschek, 2008) Rice bran and
defatted rice bran HCl, enzyme
C. beijerinckii NCIMB
8052 0.31/0.26 16.42 (Lee, 2009) Barley straw H2SO4, enzyme C. beijerinckii P260 0.43/0.39 26.64 (Qureshi et al.,
2010a) Corn stover H2SO4, enzyme C. beijerinckii P260 0.44/0.31 26.27
(Qureshi et al., 2010b) Switchgrass H2SO4, enzyme C. beijerinckii P260 0.39/0.17 14.61
(Qureshi et al., 2010b) Wheat bran H2SO4 C. beijerinckii ATCC 55025 0.32/0.16 11.8 (Liu et al., 2010) SO2–ethanol–water
(SEW) spent liquor SO2-ethanol-water
C. acetobutylicum DSM
792 0.20/0.09 8.79
(Survase et al., 2011)
Sugar maple wood
Hot water
extraction, sulfuric acid
C. acetobutylicum ATCC
824 0.22/0.15 11
(Sun & Liu, 2012) Rice straw H2SO4, enzyme C. acetobutylicum
MTCC 481 1.04
c/0.017 3 (Sun & Liu, 2012) Cassava baggase Enzyme C. acetobutylicum JB200 0.39/0.62 33.87 (Sun & Liu,
2012) Maize stalk juice – C. beijerinckii NCIMB
8052 0.27
c/0.30 11.5
(Wang & Blaschek, 2011)
a Gram of solvents per gram of substrate. b Sum of solvents production.
c Only butanol yield and productivity.
Metabolic pathways involved in ABE fermentation
Acquiring knowledge about the cell network of reactions, from the uptake of substrates to the excretion of end-products of interest, brings a unique view about the carbon flow and can thus allow identifying strategies of bioprocess management to maximize its productivity. Dealing with
ABE synthesis pathways have been well-described in literature (Figure 2.1), with the particularity of a biphasic fermentation process and a transition from acidogenesis to solventogenesis. At first, glucose is metabolized through the glycolysis pathway (or Embden-Meyerof-Parnas Pathway: EMP), then converted to pyruvate, while pentoses such as xylose are metabolized through the Pentose Phosphate Pathway (PPP) to result in 6-phosphate fructose and 3-phosphate glyceraldehyde, which then enter the EMP pathway. Pyruvate is then catalyzed to acetyl-CoA by the iron oxidation protein-pyruvate oxidoreductase. Then, phosphate acyltransferase (Pta) and acetate kinase (Ack) catalyze the following steps of acetyl-CoA to synthesize acetic acid. In a parallel pathway, Acetyl-CoA is catalyzed by a series of enzymes - Thl (thiolase), Hbd (3-hydroxybutyryl-CoA dehydrogenase), Crt (crotonase), Bcd (butyryl-CoA dehydrogenase), Ptb (phosphotransbutyrylase), and Buk (butyrate kinase) - to generate butyrate (Jones & Woods, 1986; Lee et al., 2008; Lutke-Eversloh, 2014; Lutke-Eversloh & Bahl, 2011). During acidogenesis, acetic and butyric acids are accumulated concurrently to the cells’ exponential growth. In acidogenesis, NADH is accumulated to provide the reducing power required for generating solvents in the subsequent solventogenic phase (Mann & Lutke-Eversloh, 2013). Cells then access solventogenesis with solvents accumulation while growth reduces and reaches a stationary phase. In solventogenesis, previously secreted acetic and butyric acids are re-uptaken to feed pathways of acetone and butanol production. Acetoacetyl-CoA transferase and acetate/butyrate-CoA transferase are the key enzymes in charge of generating acetyl-CoA and butyryl-CoA, which are then converted to acetone and butanol. Meanwhile, ethanol is synthesized from acetyl-CoA, which is catalyzed by aldehyde/alcohol dehydrogenase and accompanied by two moles of NAD(P)H consumption.
Figure 2. 1 Central metabolism of C. acetobutylicum (Lutke-Eversloh, 2014).
The transformation from acid to solvent is a special character of ABE fermentation. Therefore, abundant literatures focused on the metabolic mechanisms of the Clostridium species involved during the acidogenic-solventogenic phase transition. The conversion from acids accumulation to solvents generation causes a pH change in the culture medium. Acid (acitic and butyric acids) over-production is accompanied, under uncontrolled pH culture condition, to the “acid crash” phenomenon followed by the inhibition of the solventogenesis phase. During the pH phase transition, two ways of conversion from butyrate to butanol were revealed by Al-Shorgani et al (Figure 2.2). Both pathways go through the CoA transferase pathway and require two molecules of NADH, which are recycled from glucose and other sugars’ catabolic pathways, and also played as co-factors of the following reactions involving BADH (butyraldehyde dehydrogenase) and BDH (butanol dehydrogenase) enzymes. Similarly to the other biofuel production bioprocesses, glucose has been widely studied in ABE fermentation (Al-Shorgani et al., 2011). Najeeb et al. studied the bioconversion of butyric acid to butanol by C. asccharoperbutylacetonicum N1-4, and showed that 10 g L-1 butyric acid leads to 13 g L-1 butanol in the presence of 20 g L-1 of glucose, but only 0.7 g L-1 butanol was produced without glucose (Al-Shorgani et al., 2011). While using C. beijerinckii TISTR 1461, 12 g L-1 of butanol were obtained from 15 g L-1 of glucose and 10 g L-1 of butyric acid (Loyarkat et al., 2013).
Figure 2. 2 Two possible mechanisms for the conversions of butyrate to butanol (Al-Shorgani et al., 2011).
In 2011, Amador-Noguez et al. conducted a metabolomics study of the acidogenic-solventogenic transition in C. acetobutylicum, using isotope tracers and quantitative flux modelling, with 114 metabolites tracked along with an acidogenic-solventogenic transition. These authors reported that amino acids, glycolytic, pyruvate, acetyl-CoA, NAD(P)H, and nucleotide triphosphates metabolisms decreased when cells evolved from acidogensis to solventogenesis (Amador-Noguez et al., 2011).
Riboflavin is a secondary metabolite which plays a significant role in cell metabolism as a vitamin (B2) and is widely found in plants and microorganisms, but not in higher animals. Indeed, a two-milligram dose of vitamin B2 per day is necessary in the human diet (Cai & Bennett, 2011). Currently, the global market of riboflavin is estimated at 3,000 tons per year, with an industrial production by chemical, biochemical synthesis, and fermentation methods (Lim et al., 2001). Since the 1940s, various microorganisms have been found to produce riboflavin (Arzberger, 1943). Bacteria such as clostridia, yeasts species such as Candida flareri, Candida guilliermondii,
Candida famata, and Mycobacerium pheli, as well as fungi species such as Aspergillus terreus, Eremotheciumashbyii, and Ashbyagossypii, have been used to produce riboflavin (Lim et al.,
2001). Bacteria and yeast express low levels of riboflavin, and various methods were assessed to improve their production yield. For instance, the C. acetobutylicum ATCC 824 strain reached 70 mg L-1 of riboflavin after work in genetic engineering (Cai & Bennett, 2011), C. acetobutylicum reached 100 mg L-1 of riboflavin under bipyrimidine induction (Legg & Beesch, 1945), and Candida flareri produced 600 mg L-1 of riboflavin in an optimized medium. Of interest, fungi species (Ashbyagossypii) are currently often used in the industrial production of riboflavin,
expressing a high level of riboflavin at ~ 5 g L-1 compared to yeasts and bacteria (Lim et al., 2001). However, due to an increasing global market for riboflavin, there is room for alternative methods of riboflavin production. As previously mentioned, riboflavin is a by-product of ABE fermentation by C. acetobutylicum (Burgess et al., 2009), but after decades of improvement attempts as mentioned above, its yield of riboflavin is still quite low. However, as reported, when the riboflavin yield reaches 1 g L-1, it will become competitive to the current market (Cai and Bennett, 2011), so promoting riboflavin yield in the ABE fermentation system is significant. With respect to C.
acetobutylicum, the typical strain for ABE fermentation, its commercial application in the
biobutanol industry is unparalleled. Riboflavin as a by-product which adds to biobutanol production may confer a higher economic competitiveness. Therefore, obtaining substantial riboflavin as a by-product of ABE in C. acetobutylicum is a new concept to the riboflavin industry, as well as the biobutanol industry.
Lim, et al. (2001), summarized three metabolic pathways of riboflavin in Ashbya gossypii, Bacillus
subtilis, and Candida famate, which represented fungi, bacteria, and yeast, respectively (Lim et al.,
2001). Depending on the proposed pathway, C. acetobutylicum synthesizes riboflavin and should pass key joint ribulose-5-phosphate (Ru5P), which is generated from the PPP pathway. It then goes to purine metabolism for GTP synthesis through different ways (Figure 2.3). Therefore, GTP is the key joint of riboflavin synthesis, which is catalyzed to 2, 5-diamino-6-ribosylamino-4 (3H)-pyrimidinedione 5-phosphate (DRTP), 5-amino-6-ribitylamino-2,4 (1H, 3H)-pyrimidine (ARP), 6,7-dimethyl-8-ribityllumazine (DMRL), and finally to riboflavin. The riboflavin is the major precursor of flavin mononucleotide (FMN) and flavin adenine dinucleotide (FAD), and although it can be regenerated by FMN and FAD, this was considered negligible compared to the denovo synthesis from GTP. FMN and FAD are mainly used as the prosthetic group for many flavoproteins and play a fundamental role in electron transfer. Instead of free FMN or FAD, they are connected to the flavoproteins by a solid non-covalent bond. Therefore, depending on a proposed negligible interconversion from FMN and FAD, riboflavin synthesis was defined mainly through the PPP and purine metabolic pathways, which is reasonable and in agreement with the reported literature (Lim et al., 2001, Cai & Bennett, 2011).
Figure 2.3 Proposed metabolic pathway for riboflavin production by Ashbya gossypii, Bacillus
subtilis, and Candida famate. (Abbreviations: G-6P, Glucose-6-phosphate; 3PG,
3-phosphoglycerate; PEP, Phosphoenolpyruvate; Ribu-5P, Ribulose-5-phosphate; OAA, Oxaloactate; Asp, Aspatate; Thr, Thre- onine; Gly, Glycine; Ser, Serine; GTP, Guanosine triphos-phate; GMP, Guanosine monophosphate; XMP, Xanthine monophosphate; IMP, Inosine
monophosphate; DRTP, 2, 5-diamino-6-ribosylamino-4 (3H)-pyrimidinedione 5-phosphate; ARP, 5-amino-6-ribitylamino-2, 4 (1H, 3H)-pyrimidine; DBP, L-3,
4-dihydroxy-2-butanone-4-phosphate; DMRL, 6, 7- dimethyl-8-ribityllumazine (Lim et al., 2001).
Genomic and transcriptomic analyses
As a typical strain used in ABE fermentation, the C. acetobutylicum ATCC 824 whole genome was sequenced in 2001 and includes 3.9 Mb chromosomes and 3740 open reading frames (ORFs) (Hartmanis & Gatenbeck, 1984; Nolling et al., 2001). Abundant functional genes related to butanol productivity, cell tolerance, and other positive effects were investigated based on genomic knowledge. Inactivation and overexpression of the spo0A gene in C. acetobutylicum ATCC 824
revealed that it is a crucial regulating gene for solvents formation and cell sporulation. Spo0A is the transcriptional regulator of the solventogenic operon aad-ctfA-ctfB and adc, and multiple sporulation factor genes involving the sigF operon, spoIIGA, sigE, and sigG (Gheshlaghi et al.,
2009; Harris et al., 2002). A similar study also revealed a positive mutant strain of C. acetobutylicum EA2018 (hyper-butanol production) showing a higher level of the transcriptional
factor of spo0A, compared to the wild strain ATCC 824 (Hu et al., 2011).
The recently available genome sequence information for C. beijerinckii NCIMB 8052 has allowed for the examination of the gene expression profile during the shift from acidogenesis to solventogenesis with time (Shi & Blaschek, 2008b). Their study revealed that the expression of the acetate formation genes encoding for phosphotransacetylase (pta) and acetate kinase (ack), as well as the butyrate formation gene encoding for butyrate kinase (buk), all increased up to two-fold during the acidogenic phase and declined with the onset of solvent formation. Specifically, in C.
beijerinckii 8052, the onset of solventogenesis was concurrent to the initiation of the sporulation
process. C. beijerinckii NCIMB 8052 was also compared to its positive mutant BA101 at the transcriptional level by real-time quantitative reverse transcription-PCR (Q-RT-PCR). The comparison was based on acid formation genes, butyryl-CoA formation genes, solventogenic genes, early sporulation genes, putative sig E-regulated genes, putative sigG-regulated genes, the phosphotransferase system (PTS), glycolytic genes, and chemotaxis genes. Compared to C.
beijerinckii 8052, C. beijerinckii BA101 showed an increased expression of butyryl-CoA and
butanol formation genes during the solventogenic phase. It has also been suggested that the C.
beijerinckii BA101 gene expression of sporulation and PTS (e.g. manIIAB and manIIC were 5- to
10-fold lower) is less efficient than for the 8052 strain, while the genes of the primary metabolism and chemotaxis/motility (e.g. bdc was 3-fold higher) are overexpressed compared to the 8052 strain (Shi & Blaschek, 2008b).
The positive mutant strain C. acetobutylicum EA 2018 (not producing spores, and with a greater solvent production capability) also exhibited abundant overexpressed genes compared to the wild strain C. acetobutylicum ATCC 824. Aside from the spo0A and adhEII overexpression benefits to solvents formation, most of the genes related to acid formation have shown lower expression levels in the EA2018 strain. Looking at substrate utilization genes, EA2018 shows enhanced pentose uptake capacity - for instance, xylB, which is involved in xylose and xylan metabolism, was