Relative saccharification and initial degradation rates of
different waste paper materials by cellulase from
Trichoderma viride
K.M.P. Mokatse, H.S. Mhlanga and J.P.H. van Wyk*
1Department of Pharmacology and Therapeutics, Sefako Makgatho Health Sciences University, South Africa *Corresponding author email: [email protected]
Original submitted in on 4th July 2016. Published online at www.m.elewa.org on 30th September 2016
http://dx.doi.org/10.4314/jab.v105i1.14
ABSTRACT
Objectives: Solid waste accumulation, renewable and sustainable energy development are topical issues concerning many populations around the globe. Used paper is defined as part of organic solid waste, which besides recycling is eventually dumped, incinerated or landfilled. A structural analysis revealed that cellulose, a major component of waste paper, is a biopolymer composed of glucose units and when treated with cellulase enzymes, cellulose can be degraded into glucose a fermentable sugar. The aim of this investigation was to determine the relative saccharification of various waste paper materials when treated with cellulase from Trichoderma viride as well as the initial rate at which each material was degraded. It was also at aim to determine the amount of sugar produced when each paper material was maximally degraded and the time taken for maximum cellulase catalysed hydrolyses.
Methodology and Results: Various waste paper materials such as office paper, foolscap paper, filter paper, Woolworths paper (a local retailer) and cardboard were saccharified with T. viride cellulase during different incubation periods producing different amounts of sugar concentrations. The different initial saccharification rates of the paper materials were calculated by determining the amount of sugar produced during the initial period of incubation and it was concluded that different maximum sugar concentrations were obtained during saccharification of these used paper materials. Filter paper took the longest time of 100 minutes to obtain maximum saccharification. The shortest period of 40 minutes to reach maximum saccharification was obtained during the degradation of newspaper. The fastest rate of degradation was obtained from newspaper at 0.028 mg.min-1 and
the lowest rate was calculated for filter paper at 0.0045 mg.min-1. Cardboard produced the highest concentration of
sugar at 8.0 mg.ml-1 while filter paper produced the lowest at 1.4 mg.ml-1.
Conclusions and applications of findings: Different waste paper materials exhibit different susceptibilities for degradation by T.viride cellulase into glucose a fermentable sugar and as a result, different maximum amounts of sugars were obtained during bioconversion of the papers. The time needed for maximum degradation differs for the different paper products, which indicates that each paper material should be exposed to an unique bioconversion procedure ensuring a maximum sugar yield. Waste paper exhibits the ability to be bioconverted into fermentable sugars thus could be applied as a renewable resource for bioproduct development.
Keywords: Cellulase, Trichoderma viride, Waste paper, Saccharification, Bioenergy
Journal of Applied Biosciences 105:10183 –10190
INTRODUCTION
The negative effect of increasing solid waste production and the related pollution of the environment would become more topical as the global population is increased. Clean water, air and non-polluted soil are prerequisite conditions ensuring a quality life. With the world, population growing it is almost certain that the amount of solid waste produced will also increase that could have a negative effect on the environment if not properly managed. To further hamper especially air pollution, is the combustion of fossil fuels as the sole energy source (Borjesson and Mattiason, 2008) in many countries around the globe. The effect of greenhouse gases released during combustion of fossil fuels is already experienced with climate change in different countries (Atilgan and Azapagic, 2015) and the search for alternative and renewable energy resources will have to be intensified in order to limit the effect of global warming (Mercan and Karakaya, 2015). Besides the development of various clean energies such as wind, solar and geothermal the utilization of bioenergy could also be beneficial especially by substituting oil with it (Li et al., 2015). Liquid bioenergy can be obtained during the fermentation of glucose (a natural energy rich compound) into bioethanol (Thangavelu et al., 2016). Organic waste, a major component of solid waste, consists of materials such as waste paper, food waste, garden trimmings and agricultural waste of which cellulose, a biopolymer composed of glucose units, acts as a structural component. Although cellulose is strongly associated with other structural components such as lignin and hemicellulose, it is possible to recover this biopolymer (cellulose) from organic waste
materials. The various glucose units of cellulose can also be obtained by destroying the chemical bonds between different glucose molecules in the cellulose structure (Wang et al., 2015). This saccharification of cellulose especially when part of organic waste can be performed by means of chemical hydrolysis (Zhang et al., 2012) as well as enzymatic catalysis by a multi-component enzyme system (Bommarius et al., 2008) known as cellulase which is mostly of fungal (Saheed et al., 2016) and bacterial (Keshk, 2014) origin. Waste paper a major component of organic waste is composed of different types of paper materials such as newspaper, foolscap paper, cardboard and office paper (Jimenez-Flores et al., 2010). Due to the different structural compositions of various waste paper materials, these waste paper materials exhibit different susceptibility for a specific cellulase system (Mokatse and Van wyk, 2016). Different susceptibilities of paper materials towards a cellulase system is the result of two structural features present in waste cellulose known as amorphous and crystalline components (Ruel et al., 2012). During this investigation, the relative cellulase susceptibility of T. viride, a fungus and biofungicide used against pathogens, for five different waste paper materials was investigated. The initial rates of saccharification when these waste paper materials were treated with the cellulase from T. viride were also calculated. The time taken to reach maximum saccharification of each paper material by the cellulase enzyme was also determined as well as the maximum amount of sugar produced during degradation of the various waste cellulose materials.
METHODS AND MATERIALS
Used paper materials: Waste paper materials were prepared as circular discs with diameter of 6.0 mm each. Ten pieces of each paper were transferred to a test tube with the total mass of each type of paper investigated, indicated as follows: Foolscap paper (0.0162 g), Woolworths paper (0.0213 g), Cardboard (0.1034 g), Filter paper (0.0256 g), Newspaper (0.0150 g). Each type of paper was investigated six fold for its ability to be saccharified by the cellulase enzyme.
Cellulase enzyme and incubation procedure: Crude T. viride cellulase enzyme (0.20 g) was dissolved in 100 ml of Tris buffer (0,5mol.dm-3, pH 5.0) and dialysed against
distilled water for a period of 24 hours to remove sugars from the crude enzyme extract. The dialysed enzyme (100 µl) was transferred to a test tube filled with Tris buffer (600 µl) and a paper material and the reaction mixture was incubated at 40 oC for incubation periods of 10 min, 20 min, 40 min, 60 min, 80 min, 120 min, 140 min and 160 min. The enzyme activity was terminated by inserting the test tubes in a glass beaker filled with ice cubes for a period of 10 minutes. The cooled samples were used to determine the amount of sugars present in the supernatant because of the degradation of waste paper by the cellulase enzyme.
Sugar analysis: After cellulase catalysed bioconversion of the various waste paper materials with T. viride cellulase the cooled reaction mixture were mixed with the DNS reagent according to the method described by Miller (Miller, 1959). The resulting mixture was heated in a boiling water bath for a period of 10 min, with the resulting colour intensity determined on a spectrophotometer (Shimadzu
UV-1800) at 520 nm. A sugar calibration curve was constructed using glucose standards ranging from 0.5 mg.ml-1 to 8.0 mg.ml-1. This calibration curve was used to determine the concentration of the various sugar solutions obtained during the cellulase catalysed degradation of the different waste paper materials.
RESULTS AND DISCUSSION
Waste paper is a major section of solid waste and is classified as organic solid waste (Rivera et al., 2016). Used paper can also be recycled for the re-production of paper, but this process can only be repeated a number of times before the quality of paper materials are of such a low grade, which cannot guarantee the same quality paper as obtained from virgin cellulose (Sahin, 2013). Most waste paper even after recycled a number of times becomes part of solid waste, which is either incinerated, landfilled or dumped. All these waste management procedures results directly or indirectly in environmental pollution. The chemical structure of waste paper allows it to be developed as a resource of bioenergy when its cellulose sections are hydrolysed into glucose a fermentable sugar. This conversion process can be achieved during acid catalysed hydrolysis of cellulose using HCl or H2SO4 (Dussan et al.,
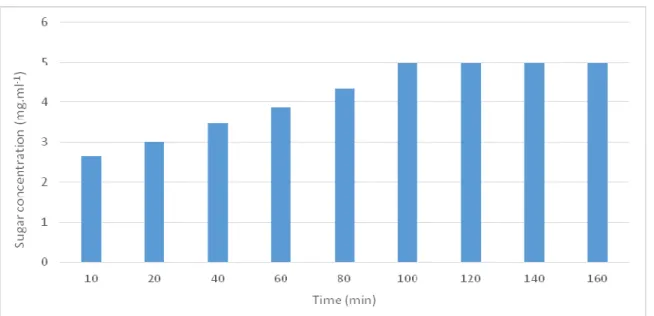
2014). This process of sugar production from cellulose is however not environmental benign but could also be performed with a more environmental friendly procedure by using cellulase enzymes from organisms such as T. viride (Mustchkener et al., 2015). To illustrate susceptibilities of various waste paper materials for the T. viride cellulase enzyme the initial rate of waste paper degradation was calculated. Cardboard showed maximal degradation of 8 mg.ml-1 sugar concentration after 60 min of incubation with the initial rate of sugar formation equal to 0.07 mg.min-1. During this period of increased saccharification the amount of sugar increased by 40% during the second interval (10-20 min), 28% during the third interval and 14% during the last interval (40-60 min) while maximum sugar production was obtained after 60 min of incubation (Figure1).
Figure 1: The saccharification profile of cardboard when degraded by T. viride cellulase. Filter paper showed an initial increase in sugar formation
during the first 10 minutes to a concentration of 1.0 mg.ml-1 that was maintained for the next 50 minutes (Figure 2). An increase of sugar production was experienced between 60 min and 100 min at a rate of 0.0045 mg.min-1 with the maximum sugar concentration of 1.4 mg.ml-1 reached after 100 min. During the period 60 min to 80 min a sugar concentration increase of 16% was produced with an
increase of 22% obtained during the period 80 min to 100 min. No increase in sugar production was produced during the period of 10 min to 60 min that could be the result of the crystalline nature of filter paper (Singh and Akimenko, 1993). During the first 60 min short chain cellulose could have been produced which have been converted into sugars during the period 60 to 100 min.
Figure 2: The saccharification profile of filter paper when degraded by T. viride cellulase. During the saccharification of foolscap paper (Figure 3),
maximum sugar concentration was reached after 80 min at a concentration of 2.3 mg.ml-1 with no more sugar produced during the rest of the incubation period of 120 min. The initial rate of sugar production was 0.018 mg.ml-1 with an increase of 18% during the period 10 min to 20 min, 22% from 20 min to 40 min, 8% increase between 40 to 60 min and 35% of sugar increase to reach maximum sugar
concentration of 2.35 mg.ml-1. Newspaper (Figure 4) was maximally degraded after 40 min producing a maximum sugar concentration of 2.5 mg.ml-1 at a initial degradation rate 0.028 mg.min-1. During the second period the sugar concentration increased by 102% to a concentration of 2.1 mg.ml-1 which was further increased by 17% during the third period of incubation which eventually resulted in the maximum sugar concentration of 2.5 mg.ml-1.
Figure 4. The saccharification profile of newspaper when degraded by T. viride cellulase. Woolworths paper (Figure 5) showed the longest period of
saccharification of 100 min when the maximum sugar concentration of 5.0 mg.ml-1 was reached at an initial rate of 0.026 mg.min-1. The sugar production increased by 15% during the second period, 12% during the third period, 11% during the fourth period and 10% before reaching the maximum sugar concentration. The highest rate of sugar formation was calculated for newspaper followed by
Woolworths paper with the lowest rate of saccharification obtained with filter paper (Table 1). The rate of sugar formation as well as the time taken to reach maximum sugar formation during degradation of waste paper materials is influenced by the relative amount of crystalline and amorphous sections present in a specific paper material (Beck-Candanedo et al., 2005).
Table 1: Initial saccharification rates of different waste paper materials when degraded with T. viride cellulase as well as time to produce maximum sugar concentration.
Paper substrate Rate of change in sugar concentration (mg.min-1)
Period for change in concentration (min) Cardboard 0.07 30 Filter paper 0.0045 90 Foolscap 0.018 70 Newspaper 0.028 30 Woolworths 0.026 70
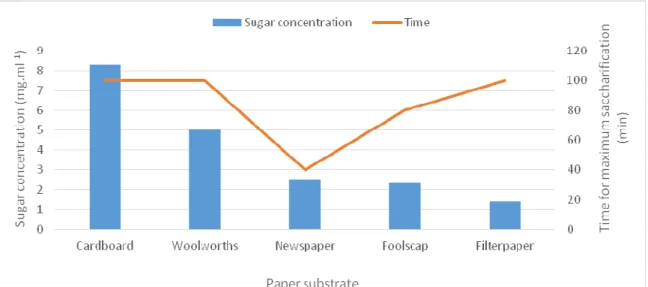
Materials with higher amorphous sections will be degraded faster than paper materials with a higher crystalline section. From the rates of degradation (Table 1), it can be concluded that newspaper has the highest initial rate of saccharification followed by Woolworths paper with filter paper known as a crystalline cellulose material, exhibiting the lowest amount of sugar formation. Figure 6 indicates the maximum amount of sugar produced by T. viride
cellulase when degrading the different waste paper materials. Cardboard produced the highest sugar concentration at 8.0 mg.ml-1 followed by Woolworths paper with the lowest amount produced from filter paper. The high crystalline nature of filter paper is illustrated by the observation that this paper material resulted in the lowest amount of sugar produced as well as taken the longest period to produce the maximum sugar concentration.
Figure 6. The relative saccharification of different waste paper materials by T. viride cellulase and time for maximum sugar production.
Currently used paper, which is part of organic solid waste, is treated as typical waste of no value and as a result, it is exposed to solid waste management procedures (Kirama and Mayo, 2016). The chemical nature of waste paper suggests that these waste materials could be developed as
a resource of bioenergy by converting their cellulose components into fermentable sugars (Jiang et al., 2016). The bioconversion of waste cellulose does not only limit the huge amounts of solid waste but also addresses the issue of clean and green energy.
CONCLUSIONS
Millions of tons of waste paper are produced annually that are exposed to waste management procedures such as incineration, dumping or land filling. Currently the potential of organic waste to be utilised as a potential resource of clean energy (bioenergy) is not fully realized. From the investigation, it has been concluded that waste paper can
be converted into sugars with different types of paper exhibiting different susceptibilities towards the cellulase enzyme system from T. viride. The rates at which the paper materials are hydrolysed also differ from each other as well as the maximum amount of sugar produced from each paper material during cellulase catalysed bioconversion.
Waste paper is a potential alternative and renewable energy resource which could be developed not only to address the issue of clean energy but by developing it as a
energy resource it will limit the amount of solid waste as thus ensure a clean and healthy environment.
REFERENCES
Atilgan B. and Azapagic N, 2015. Lifecycle environmental impacts of electricity from fossil fuels in Turkey. Journal of Cleaner Production 105: 555-564. Beck-Candanedo S., Roman M, Gray D.G., 2005. Effect of
reaction conditions on the properties and behaviour of wood cellulose nanocrystal suspensions. Bio macromolecules 6: 1048-1054. Bommarius AG, Katona A, Cheben SE, Patel AS,
Ragauskas AJ, Knudson KR, Pu Y, 2008. Cellulase kinetics as a function of cellulase pre-treatment. Metabolic Engineering 10: 370-381. Borjesson P. and Mattiason B, 2008. Biogas as a resource
– efficient vehicle fuel. Trends Biotechnology 26: 7-13.
Dussan KJ, Silva DDV, Moraes EJC, Arruda PV, Felipe MA, 2014. Dilute – acid hydrolysis of cellulose to glucose from sugarcane bagasse. Chemical Engineering Transactions 38: 433-438.
Jiang L, Zhang A, Zhao Z, He F, Li H, Wu N, 2016. The comparison of obtaining fermentable sugars from cellulose enzymatic hydrolysis and fast pyrolysis. BioresourceTechnology 200: 8-13.
Jimenez-Flores R, Fake G, Carroll JH, Howard JA, 2010. A novel method for evaluating the release of fermentable sugars from cellulosic biomass. Enzyme Microbial Technology 47: 206-211. Li K, Bian H, Liu C, Zhang D, Yang Y, 2015. Comparison of
geothermal with solar and wind power generation systems. Renewable and Sustainable Energy Reviews 42: 1464-1474.
Karima A. and Mayo AW, 2016. Challenges and prospects of private sector participaton in solid waste management in Dar es Salaam, Tanzania. Habitat International 53:195-1054.
Keshk S, 2014. Bacterial cellulose production and its industrial applications. Bioprocessing and Biotechniques 4: 1-10.
Mercan M. and Karakaya E, 2015. Energy consumption economic growth and carbon emission: Dynamic panel cointegration analysis for selected OECD countries. Procedia Economic and Finance 23: 587-592.
Miller GL, 1959. Use of dinitrosalicylic acid reagent for the determination of reducing sugars. Analytical Chemistry Journal 31: 426-428.
Mokatse KMP. and Van wyk JP., 2016. Cellulase catalyzed bioconversion of different waste paper materials into fermentable sugars. International Journal of Biosciences 8: 66-76.
Mustchkechner M., Illmer P, Wagner A.O., 2015. Biological pre-treatment: Enhancing biogas production using the highly cellulolytic fungus T. viride. Waste Management 43: 98-107.
Rivera JA, Lopez VP, Cassado RR, Hervas JS, 2016. Thermal degradation of paper industry wastes from a recovered paper mill using TGA: Characterisation and gasification test. Waste Management 47: 225-235.
Ruel K, Nishinyama Y, Joseleau J, 2012. Crystalline and amorphous cellulose in the secondary walls of Arabidopsis. Plant Science 193-194: 48-61. Saheed OK, Jamal P, Karin MIA, Alana Z, Muyibi SA,
2016. Utilization of fruit peels as carbon source for white rot fungi biomass production under submerged state conversion. Journal of King Saud University Science 28: 143-151.
Sahin, HT, 2013. A study on paper recycling effects on cellulose properties. Turkish Journal of Forestry 14 (1): 73-80.
Singh RN. and Akimenko VK, 1993. Isolation of cellobiohydrolase of Clostridium thermocellum capable of degrading natural crystalline substrates. Biochemical and Biophysical Research Communication 192:1123-1130. Thagavelu SK, Ahmed AS, Ani FN, 2016. Review on
bioethanol as alternantive fuel for spark ignition engines. Renewable and Sustainable Energy Reviews 56: 820-835.
Wang Y, Lian J, Wan J, Ma Y, Zhang Y, 2015. A supramolecular structure insight for conversion property of cellulose in hot compressed water: Polymorphs and hydrogen bonds changes. Carbohydrate Polymers 133: 94-103.
Zhang Z, Liu B, Zhao Z, 2012. Efficient acid-catalayzed hydrolysis of cellulose in organic electrolyte solutions. Polymer Degradation and Stability 97: 573-577.