HAL Id: hal-01253875
https://hal.archives-ouvertes.fr/hal-01253875
Submitted on 13 Nov 2019
HAL is a multi-disciplinary open access
archive for the deposit and dissemination of
sci-entific research documents, whether they are
pub-lished or not. The documents may come from
teaching and research institutions in France or
abroad, or from public or private research centers.
L’archive ouverte pluridisciplinaire HAL, est
destinée au dépôt et à la diffusion de documents
scientifiques de niveau recherche, publiés ou non,
émanant des établissements d’enseignement et de
recherche français ou étrangers, des laboratoires
publics ou privés.
Morphological tools for spatial and multiscale analysis of
passive microwave remote sensing data
Sébastien Lefèvre, Erchan Aptoula
To cite this version:
Sébastien Lefèvre, Erchan Aptoula. Morphological tools for spatial and multiscale analysis of passive
microwave remote sensing data. Specialist Meeting on Microwave Radiometry and Remote Sensing of
the Environment (MicroRad), 2016, Espoo, Finland. �hal-01253875�
MORPHOLOGICAL TOOLS FOR SPATIAL AND MULTISCALE ANALYSIS OF PASSIVE
MICROWAVE REMOTE SENSING DATA
S. Lef`evre
∗Universit´e Bretagne Sud
UMR 6074 IRISA
Vannes, France
E. Aptoula
†Gebze Technical University
Institute of Information Technologies
Kocaeli, Turkey
ABSTRACT
Earth Observation through microwave radiometry is partic-ularly useful for various applications, e.g., soil moisture, ocean salinity, or sea ice cover. However, most of the image processing/data analysis techniques aiming to provide auto-matic measurement from remote sensing data do not rely on any spatial information, similarly to the early years of opti-cal/hyperspectral remote sensing. After more than a decade of research, it has been observed that spatial information can very significantly improve the accuracy of land use/land cover maps. In this context, the goal of this paper is to propose a few insights on how spatial information can benefit to (passive) microwave remote sensing. To do so, we focus here on math-ematical morphology and provide some illustrative examples where morphological operators can improve the processing and analysis of microwave radiometric information. Such tools had great influence on multispectral/hyperspectral re-mote sensing in the past, and are expected to have a similar impact in the microwave field in the future, with the launch of upcoming missions with improved spatial resolution, e.g. SMOS-NEXT.
Index Terms— Mathematical Morphology, Multiscale representation, Feature extraction, Spatial information, Re-mote sensing
1. INTRODUCTION
Earth Observation benefits from a wide range of satellite sen-sors. Among the available imaging modalities, microwave ra-diometry is particularly useful for various applications, e.g., soil moisture, ocean salinity, or sea ice cover. Such applica-tions have gathered numerous works aiming to provide au-tomatic measurements from analysis of remote sensing data. However, most of these image processing/data analysis tech-niques do not rely on any spatial information, similarly to the early years of optical/hyperspectral remote sensing. After
∗Thanks to French National Research Agency (ANR) – Project Grant
ANR-13-JS02-0005-01 (Asterix project) for funding.
†Thanks to Scientific and Technological Research Council of Turkey
(TUBITAK) – Career Grant 112E210 for funding.
more than a decade of research, it has been observed that spa-tial information can very significantly improve the accuracy of land use/land cover maps. The object-based image analysis (OBIA) paradigm, computation of multiscale features, spatial regularization of classification maps are among the various techniques that have shown great success for remote sens-ing of the environment. Surprissens-ingly, such advances have not impacted the field of passive microwave remote sensing yet. Meanwhile, the launch of new missions, e.g., ESA SMOS (2009), NASA/JAXA GMP (2014), or NASA SMAP (2015), brings new data that call for the development of new efficient and accurate image processing algorithms.
In this context, the goal of this paper is to propose a few insights on how spatial information can benefit to (passive) microwave remote sensing. To do so, we focus on Mathemati-cal Morphology (MM), a nonlinear image analysis framework equipped with rigorous mathematical foundations and effi-cient tools for exploiting spatial information. Remote Sensing has been a successful application field of MM [1], with devel-opments such as local descriptors for land cover classification, global descriptors for (patch) image retrieval, object detection based on shape/geometric properties, or (multiscale) image segmentation. We inspired from these works and provide here three different examples where morphological operators can improve the processing and analysis of microwave radiomet-ric information: (i) image simplification with quasi-flat zones filtering, (ii) peak detection with top-hat by reconstruction, and (iii) multiscale description for temperature classification. All experiments are conducted on a standard SMOS dataset.
The paper is organized as follows. In Sec. 2, we provide the general reader some introduction to mathematical mor-phology. We then describe the three illustrative applications in Sec. 3, before discussing open challenges in Sec. 4 and providing concluding remarks in Sec. 5.
2. MORPHOLOGICAL TOOLS
Mathematical Morphology has been introduced in the 1960s by Serra and Matheron in the context of material sciences. Since then, it has become a popular toolbox in image
pro-cessing [2], with sucessful applications in many contexts in-cluding remote sensing [1]. While initially defined on binary images using the set theory, it has been later extended to the general case of greyscale images using the lattice theory.
2.1. Structuring Operators
Mathematical Morphology nowadays provides a wide range of tools. For the sake of illustration, we recall here only the most basic ones, which aim to probe an image f with a local template b (also called structuring element).
The two elementary operations are called erosion ε and di-lation δ. They respectively shrink and enlarge objects present in the image (or compute a local minimum or maximum):
εb(f )(p) = V q∈b f (p + q), p ∈ E (1) δb(f )(p) = W q∈˘b f (p + q), p ∈ E (2)
where ˘b = −b is the symmetric template of b. These oper-ators can be further combined to build morphological filters such as opening and closing that respectively acts in remov-ing all foreground and background components of the image in which the template does not fit:
γb(f ) = δ˘b(εb(f )) (3)
ϕb(f ) = ε˘b(δb(f )) (4)
Let us note that many other operators can be derived from these basic ones [2]. The advantages of MM is the rigorous mathematical framework, with morphological operators be-ing translation-invariant, increasbe-ing, and for openbe-ing/closbe-ing being also anti-extensive/extensive and idempotent. Further-more, efficient algorithms and implementations of these op-erators have been introduced in the literature, and many mor-phological image analysis toolboxes are available.
2.2. Connected and Hierarchical Approaches
The major drawback of previous morphological operators is the need for a structuring element, whose shape and size have a great impact on the final result. Connected operators were thus introduced to solve this issue. Furthermore, these filters have also a tremendous advantage, since they do not change nor add image contours but only filter out some objects by merging elementary regions called flat zones. To illustrate, instead of filtering out the elements that do not contain a 5 × 5 square, it is possible to remove those that do not contain at least 25 pixels. For more details on connected approaches, the reader is refer to the tutorial [3].
Connected operators can be built following two distinct approaches. The first one consists in filtering the image by applying a structural operator, before reconstructing image contours using a geodesic reconstruction process. It leads to
the so-called filters by reconstruction. The second strategy requires to first build a hierarchical representations of the im-age, known as a (morphological) tree. Various tree models are available: min- and max-tree, tree of shapes, binary partition tree, α-tree, etc. Selected nodes and branches are then filtered out using a tree pruning process. The resulting image can fi-nally be reconstructed from the simplified tree. This strategy is particularly appealing since processing a tree structure is much more efficient than a raster analysis requiring to scan all pixels.
3. APPLICATIONS
Let us recall that our objective is to assess the interest of MM in microwave remote sensing. To do so, we will il-lustrate the potential of morphological operators on a stan-dard dataset, namely the Murrumbidgee River catchment [4]. Our experiments were conducted using the level 1C product (MIR SCLF1C), from the observation acquired on 29/03/2016 (20:18:27 – 21:11:45). In this preliminary work, we are using only the brightness temperature information. For the sake of simplicity, we have use digital images defined on a standard square grid, using the Earth fixed grid point system. We have not tackled complex data and thus we only rely on H & V polarization channels. Let us note that we use here polarization computed at the surface level frame and not at the antenna frame.
3.1. Image Simplification with Quasi-Flat Zones Filtering
The first application aims to simplify the content of a SMOS image, with an edge-preserving image simplification tech-nique. Contrary to common linear filtering techniques such as Gaussian smoothing, connected morphological filtering al-lows removing image details while keeping the original loca-tion of image contours. To do so, we model the image through quasi-flat zones (QFZ), that offer a robust extension of flat zones (FZ) or connected components (CC). A FZ is made of all neighboring pixels that share exactly the same image value. In many cases, the pixels belonging to the same object have very similar (but not strictly equal) values, thus render-ing the concept of FZ useless when dealrender-ing with integer- or real-valued images. By extension, a QFZ allows some varia-tion of the image values.
Two main definitions of QFZ have been introduced in the literature [5]. The α-CC gathers pixels such as, for any cou-ple of pixels in the QFZ, there exists a path linking these two pixels with a local difference not higher than α between two neighboring pixels along the path. This model only relies on local differences that are compared with a local range thresh-old. Its main drawback is its sensitivity to blurred edges, that lead to the chaining effect. To explain, let us consider a shading from 0 to 100, with a local difference of 1 between two neighboring pixels. All the pixels will then belong to the
same, unique, α-CC if α = 1. Setting α = 0 produces FZ or standard CC, and here every single pixel will lead to a distinct component.
An extension of the α-CC has been introduced by Soille in [5]. Instead of using only a local range threshold, it is pos-sible to also take into account the global range of a QFZ. It leads to the concept of (α, ω)-CC, where the maximal differ-ence between any pair of pixels belonging to the same QFZ has to be lower than a threshold ω. In practice, it has been shown that both local (α) and global (ω) thresholds can be conveniently assigned the same value. A higher α = ω value means that higher differences between pixels of the same QFZ are allowed. In other words, the QFZ are made of a more het-erogeneous content, and there are less QFZ in the image. The filtering effect is thus stronger.
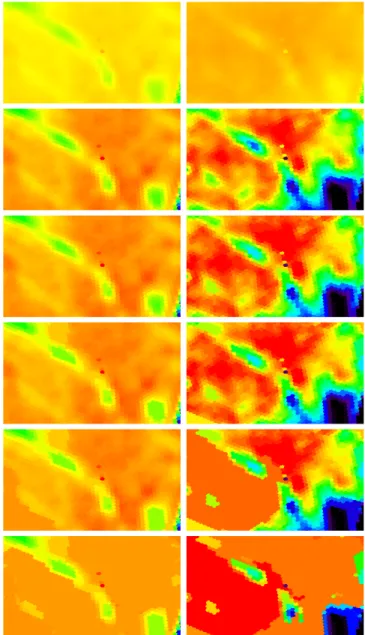
We show the behavior of this filtering on SMOS data in Fig. 1, where visual illustrations are given. We consider both H and V polarizations, on the left and right column respec-tively. The first line shows original images, with their contrast being stretched for the sake of clarity in second line (for the V polarization, contrast stretch is applied in the [5% − 95%] range). Then successive filtering results are reported, with increasing α = ω values, from 3 to 30 (assuming here a byte representation of pixel values, i.e. pixels taking values in [0, 255]). We can visually observe the filtering effect, with less and less remaining objects, but always keeping the ac-tual borders of image components. Let us note that the fil-tering was always applied on the initial images, and contrast-stretched versions are provided here only to ease understand-ing.
Beyond visual assessment, we also provide a quantitative evaluation in Tab. 1. While the initial H and V images con-tain 57876 pixels, modeling the image through its connected components allows reducing the number of elements to 1930 flat zones (i.e., with α = ω = 0). These flat zones actu-ally correspond to individual cells discretized on the square grid. Furthermore, when considering QFZ instead of FZ, the number of elements decreases significantly. It is interesting to notice that for low values of α, ω, the image complexity (measured in terms of number of elements) is reduced by a factor of 3, while the visual appearance of images is kept.
The proposed morphological filtering offers two main ad-vantages. On the one hand, it consists in an efficient way to perform spatial regularization, without requiring to define a fixed neighborhood conversely to most of the other regular-ization techniques (e.g. Markov Random Fields). Indeed, the neighborhood of a pixel actually depends on the image con-tent, and is extended up to the (α, ω) range. On the other hand, such a simplification into flat or quasi-flat zones allows a strong reduction of the number of image elements. This kind of data compression is appealing since it leads to faster subsequent processing (e.g. data assimilation of the bright-ness temperature values).
Fig. 1. Image simplification on the H (left) and V (right) po-larization data: (from top to bottom) original images and their contrast-stretched versions, filtered images using increasing α, ω values: 3, 9, 18, and 30.
Table 1. Quantitative assessment of image simplification. Polarization Unfiltered QFZ, with α = ω set to
Pixels FZ 3 9 18 30 H 57876 1930 677 590 534 156 V 57876 1930 602 562 365 96
3.2. Peak Detection with Top-Hat by Reconstruction
The second application of morphological tools deals with peak detection. While opening (resp. closing) aims to fil-ter the image through removal of its small foreground (resp. background) image elements, it is also possible to focus on these removed elements. The resulting operators are called residue operators, and basically compare a filtered image with its original version. Morphological top-hat is the most com-mon residue operator, and is defined as the difference between the original image and the result of an opening (white top-hat) or a closing (black top-hat, also called bottom-hat). While the white top-hat returns small objects (i.e. that fit within a structuring element) brighter than their surroundings, the black top-hat returns objects darker than their surroundings. Furthermore, to avoid the artifacts brought by the shape of the structuring element, these residue operators may be favorably replaced by their connected version. To do so, opening and closing are respectively replaced by opening and closing by reconstruction (thus keeping image contours).
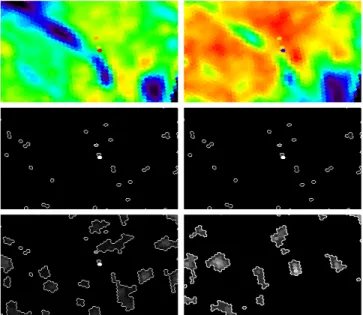
We apply top-hat by reconstruction on both H and V polarization data, and report results in Fig. 2 (left and right columns, respectively). We consider two different sizes for the structuring element. In the first case (middle row), we extract objects made of a single element (hexagonal cell) brighter than their surrounding. The corresponding structur-ing element has been empirically defined as a 7 × 7 square. The top-hat operator provides two kinds of information, i.e. the location of residual objects (non-zero elements) as well
Fig. 2. Peak detection using top-hat on the H (left) and V (right) polarization data. Top: original images (contrast stretched). Middle: top-hat of size 1 unit (7 × 7 pixels). Bot-tom: top-hat of size 6 units (21 × 21 pixels). Borders of all non-zero elements have been highlighted.
as their strength (measured as the difference between the original and filtered images). In Fig. 2, contours of non-zero elements are overlayed to allow identification of weak residues that would otherwise appear as very dark pixels. The resulting image contains all local image maxima. In the second case (bottom row), we considering a filtering size of 7 elements (i.e. one hexagonal cell and its 6 neighbors). The structuring element has thus been empirically set to a square of 21 × 21 pixels. The operator is then able to extract local maxima of larger extent. Let us note that such elements would have been very hard to extract using a thresholding technique. Besides, the only parameter required by the operator is the size of the filter. Robustness to changes of illumination and contrast is also an attractive property.
The proposed application is useful to extract small com-pact hot spots disconnected from hot areas. Such regions may correspond to radio frequency interferences (RFI), whose de-tection is an important problem in microwave remote sensing. Besides, the same principle can be applied with cold spots us-ing the bottom hat.
3.3. Multiscale Description and Temperature Classifica-tion
The last experiment reported in this paper illustrates how MM can be used to improve pixel-based classification. In opti-cal remote sensing, differential morphologiopti-cal profiles (DMP) [6] have been assessed as powerful multiscale descriptors in the context of (urban) land cover classification. Such profiles are built from a scale-space analysis. In other words, the in-put image is iteratively processed with morphological filters (most often with opening and closing operators) of increasing size. Each pixel is then described by its morphological pro-file, that is made of the values taken in the different filtered images. The differential morphological profile is nothing but the first derivative of this profile, storing the differences be-tween two successive filtered images instead of the filtered images themselves. Connected operators (opening and clos-ing by reconstruction) are used to avoid the artificial intro-duction of edges due to the shape of the structuring element. After a decade of intensive use, DMP have been successfully replaced by DAP, or differential attribute profiles [7]. Basi-cally, the overall scheme is kept but the opening/closing by reconstruction are replaced by attribute opening/closing (e.g. with a size attribute). DAP features allow for both a higher flexibility (a wide range of attributes can be used) and a lower computational cost, since they can be efficiently computed from a tree-based representation.
We describe here each pixel by its DAP, thus allowing a modeling of its brightness temperature (or rather its evo-lution) at multiple scales. Each scale corresponds to an at-tribute filtering, that is achieved through max-tree pruning. We use the standard area attribute, measured in number of pixels. Since we do not have any ground truth or reference
data (provided as a reference map with predefined classes), we consider here an unsupervised classification setup. We use the popular K-means clustering technique, and split the feature space (i.e. original H and V values, or their multiscale counterparts) into three classes. Fig. 3 provides classification maps that are produced from the original H and V images (re-called in (a) and (b)) by the K-means algorithm, when using the initial brightness temperature data from H (c), V (d), or both H and V (g). DAP are computed from these two po-larization images, and clustering is applied on DAP features either computed from H only (e), V only (f), or from both H and V (h).
Without any ground truth available, it is difficult to assess the accuracy of any of these classification maps. But the dif-ferent maps provided in Fig. 3 show that clustering based on DAP information clearly differs from the baseline using orig-inal temperature brightness values at the standard scale. We can visually observe that DAP allows taking spatial
informa-(a) (b)
(c) (d)
(e) (f)
(g) (h)
Fig. 3. Image clustering using DAP from brightness temper-ature measurements. From top to bottom: original (contrast-stretched) H (a) and V (b) polarization data, clustering using only brightness temperature values from H (c) and V (d), us-ing DAP from H (e) and V (f), and usus-ing brightness tempera-ture (g) or DAP (h) from both H and V.
tion into account. Nevertheless, some supervised classifica-tion settings should be considered for quantitative assessment. To summarize, this experiment shows that MM makes possible the characterization of both spatial and spectral in-formation. DAP description offers a higher discriminating power but at the cost of longer feature vectors (i.e. the num-ber of scales). Let us observe that we have here only relied on the area attribute due to its popularity, but nothing prevents us using other attributes.
4. DISCUSSION
The different experiments described in the previous section illustrate how morphological approaches could contribute to the analysis of microwave remote sensing data. From these first attempts, we have identified several challenges to be ad-dressed for a complete application of morphological opera-tors.
The SMOS instrument provides multi-angular informa-tion, where brightness temperature are observed from multi-ple incidence angles. In this paper, we have reported prelim-inary experiments using the so-called browse product where a unique observation is built from the multi-angular observa-tions. Undoubtedly, processing the full multi-angular infor-mation is expected to provide better results. However, this requires defining morphological tools able to cope with such multi-angular data. Such a requirement calls for new devel-opments in the field of MM.
Furthermore, the SMOS instrument is monitored in full polarization mode. It means that X, XY, Y, XY polarizations are recorded alternatively. We have used here only X and Y polarizations, and more precisely their mapped values H and V at the surface level frame. A deeper analysis of the data would mean to process XY polarizations too, that come in a complex numeric representation. Defining morphological operators on complex-valued data has led to only a few stud-ies, and needs to be further explored in the context of passive microwave remote sensing data.
Another challenge is related to the spatial grid considered for the analysis. In SMOS products, data are sampled along a non-regular grid, using the Icosahedral Snyder Equal Area projection (ISEA4H9). Such a grid differs from the stan-dard square grid commonly used in digital image process-ing. In order to exploit as best as possible the specificity of SMOS products, new connectivity measures have to be used for hexagonal cells to be able to identify the neighbors of each image element. Since MM relies on a spatial analysis of im-age content, such a definition has a very strong influence on the final result.
While brightness temperature values from a L1C prod-uct were considered here, let us observe that morphological tools can be applied to other microwave-related data, e.g. Soil Moisture or Ocean Salinity maps. In this context, the goal could be to achieve a spatial post-processing of the SM or OS
maps, or even a tree-based analysis of these values in order to produce a multiscale characterization of land cover.
Finally, let us recall that extension of morphological op-erators to multivariate data is far from being trivial (while necessary if several observations or values are provided for each pixel). Two main strategies [8] are available: while the marginal strategy simply consists in a componentwise pro-cessing where each channel is treated independently from the others (as a greyscale image), the vectorial strategy is more theoretically sound. In this context, each pixel is assigned a vector, and these vectors are further compared through a vec-tor ordering method. These extensions are also valid for some tree-based representations (inclusion trees) while some others (partitioning trees) generally require distance functions, that are usually easier to define in a multidimensional space.
5. CONCLUSION
Conversely to other satellite imaging modalities, microwave remote sensing is far from taking full advantage of recent ad-vances in (spatial) image analysis. We have tackled this issue and describe how a very popular image analysis framework, namely Mathematical Morphology, could be used on SMOS data. Three different applications were provided to underline the possible use of morphological operators, for image/object simplification, detection, and description respectively.
The preliminary experiments have shown the potential of Mathematical Morphology (and more generally of digital im-age processing) for SMOS L1C data. Other imim-age modalities are now to be considered, as well as the design of complete solutions for realistic applications in collaboration with mi-crowave specialists.
6. ACKNOWLEDGMENT
Franc¸ois Cabot (CESBIO/CNES) for fruitful discussions on SMOS mission and microwave remote sensing.
7. REFERENCES
[1] P. Soille and M. Pesaresi, “Advances in mathematical morphology applied to geoscience and remote sensing,” IEEE Transactions on Geoscience and Remote Sensing, vol. 40, no. 9, pp. 2042–2055, January 2002.
[2] P. Soille, Morphological Image Analysis : Principles and Applications, Springer-Verlag, Berlin, 2nd edition, 2003.
[3] P. Salembier and M. H. F. Wilkinson, “Connected opera-tors,” IEEE Signal Processing Magazine, vol. 26, no. 6, pp. 136–157, 2009.
[4] S. Peischl, J.P. Walker, C. R¨udiger, N. Ye, Y.H. Kerr, E. Kim, R. Bandara, and M. Allahmoradi, “The AACES field experiments: SMOS calibration and valida-tion across the murrumbidgee river catchment,” Hydrol-ogy and Earth System Sciences, vol. 16, pp. 1697–1708, 2012.
[5] P. Soille, “Constrained connectivity for hierarchical im-age partitioning and simplification,” IEEE Transactions on Pattern Analysis and Machine Intelligence, vol. 30, no. 7, pp. 1132–1145, July 2008.
[6] M. Pesaresi and J. Benediktsson, “A new approach for the morphological segmentation of high resolution satellite imagery,” IEEE Transactions on Geoscience and Remote Sensing, vol. 39, no. 2, pp. 309–320, February 2001.
[7] M. Dalla Mura, J. A. Benediktsson, B. Waske, and L. Bruzzone, “Morphological attribute profiles for the analysis of very high resolution images,” IEEE Transac-tions on Geoscience and Remote Sensing, vol. 48, no. 10, pp. 3747–3762, 2010.
[8] E. Aptoula and S. Lef`evre, “A comparative study on multivariate mathematical morphology,” Pattern Recog-nition, vol. 40, no. 11, pp. 2914–2929, November 2007.