HAL Id: tel-02130780
https://hal.univ-lorraine.fr/tel-02130780
Submitted on 16 May 2019HAL is a multi-disciplinary open access archive for the deposit and dissemination of sci-entific research documents, whether they are pub-lished or not. The documents may come from teaching and research institutions in France or abroad, or from public or private research centers.
L’archive ouverte pluridisciplinaire HAL, est destinée au dépôt et à la diffusion de documents scientifiques de niveau recherche, publiés ou non, émanant des établissements d’enseignement et de recherche français ou étrangers, des laboratoires publics ou privés.
Rock mass mechanical behavior in deep mines: in situ
monitoring and numerical modelling for improving
seismic hazard assessment
Francesca de Santis
To cite this version:
Francesca de Santis. Rock mass mechanical behavior in deep mines: in situ monitoring and numerical modelling for improving seismic hazard assessment. Earth Sciences. Université de Lorraine, 2019. English. �NNT : 2019LORR0020�. �tel-02130780�
AVERTISSEMENT
Ce document est le fruit d'un long travail approuvé par le jury de
soutenance et mis à disposition de l'ensemble de la
communauté universitaire élargie.
Il est soumis à la propriété intellectuelle de l'auteur. Ceci
implique une obligation de citation et de référencement lors de
l’utilisation de ce document.
D'autre part, toute contrefaçon, plagiat, reproduction illicite
encourt une poursuite pénale.
Contact : ddoc-theses-contact@univ-lorraine.fr
LIENS
Code de la Propriété Intellectuelle. articles L 122. 4
Code de la Propriété Intellectuelle. articles L 335.2- L 335.10
http://www.cfcopies.com/V2/leg/leg_droi.php
Laboratoire GeoRessources, Ecole des Mines de Nancy, Campus ARTEM 92 Rue Sergent Blandan, 54042 Nancy
Université de Lorraine
Ecole Nationale Supérieure des Mines de Nancy
Laboratoire GeoRessources
École doctorale SIReNa
Thèse
Présentée pour l’obtention du titre de
Docteur de l’Université de Lorraine
En Géosciences
Par
Francesca DE SANTIS
Rock mass mechanical behavior in deep mines:
in situ monitoring and numerical modelling for improving
seismic hazard assessment
Soutenue publiquement le 5 février 2019
Devant le jury composé de :
Beata ORLECKA-SIKORA (Ass. Pr.) Institute of Geophysics, Polish Academy of Sciences Rapporteur
Martin GRENON (Pr.) Université Laval, Québec, Canada Rapporteur
Evelyne FOERSTER (PhD) Commissariat à l'énergie atomique et aux énergies alternatives, France
Examinatrice
Katshidikaya TSHIBANGU (Pr.) Université de Mons, Belgique Examinateur
Yann GUNZBURGER (Mcf.) GeoRessources, Université de Lorraine, France Directeur de thèse Pascal BERNARD (Pr.) Institut de Physique du Globe de Paris, France Co-directeur de thèse Isabelle CONTRUCCI (PhD) Institut National de l’Environnement Industriel et
des Risques, France
Encadrante
Savka DINEVA (PhD) Luleå University of Technology, Suède Invitée
i
Acknowledgments
At the end of this very enriching experience, I would like to express my special appreciation and thanks to the people who have contributed to this work.
Je tiens à remercier fortement mon directeur de thèse Yann Gunzburger, mon co-directeur Pascal Bernard et mes encadrants Isabelle Contrucci et Vincent Renaud. C’est grâce à votre soutien, vos conseils et votre disponibilité que j’ai pu mener cette thèse à son terme. Merci Yann pour ton intéressement, ta disponibilité, tes idées et pour m’avoir toujours poussé à faire de mon mieux. Merci beaucoup aussi pour m’avoir rappelé à plusieurs reprises qu’une thèse n’est jamais terminée ! Ça m’a permis de ne pas me perdre et de garder à l’esprit mon objective. Pascal, tu m’as montré la magie de la sismologie et tout ce qu’on peut apprendre et découvrir en analysant un signal microsismique. Je t’en remercie beaucoup ! Isabelle, merci de m’avoir accueilli à l’Ineris au tout début de mon arrivé, lorsque je ne parlais pas encore en français et que j’avais très peu de connaissances sur la sismicité induite. Tu as été toujours disponible et pleine de conseilles à me donner tout au long de ce projet de thèse. Nous avons aussi partagé l’expérience bizarre et marrante de se perdre dans la forêt suédoise sous la neige. Vincent, tu m’as fait découvrir le monde de la modélisation numérique. C’est uniquement grâce à ton investissement, ton intérêt et tes enseignements que j’ai pu énormément apprendre sur la modélisation en très peu de temps. Merci d’avoir été patient et disponible à chaque fois que je t’ai appelé pour te dire : FLAC à planté !
Special thanks go to Shahram Mozaffari for having been my mentor and my guide underground the mine. My gratitude goes also to Anders Nyström for all the interesting discussions and the support he gave me. Johan Olsson, Lena Lilja and Michaela Åberg Seliö helped me tremendously in interpreting and understanding the complex geology of Garpenberg mine. Thank you for this and also for the very nice time spent in their office in Garpenberg. A special thank is also for Savka Dineva who was present at numerous PhD meetings with very interesting advices.
I also would like to thank Beata Orlecka-Sikora, Martin Grenon, Evelyne Foerster and Katshidikaya Tshibangu for having participated to the thesis jury and for their interest and their brilliant suggestions on this work.
Je tiens à remercier aussi particulièrement Jannes Kinscher et Armand Lizeur pour toutes nos discussions et pour l’aide précieux qu’ils m’ont donnés tout au long de ce parcours. Mes remerciements vont également à Alice Tonnellier, Roxane Muller, Nicolas Spitzensteder et Regis Toussaint. Chacun de vous a énormément contribué à la réalisation de cette thèse. C’été un grand plaisir de travailler avec vous ! Un grand merci aussi pour Emmanuelle Klein et Pascal Bigarré pour m’avoir soutenue énormément et pour leur confiance en mes capacités. Je remercie également toute l’équipe de l’Ineris et de GeoRessources et très particulièrement tous les doctorants avec qui j’ai partagé le statut de thésard avec toutes les joies et les difficultés qui y sont associées.
Un ringraziamento speciale anche alla mia famiglia e ai miei cari amici in Italia. Siete il mio punto fisso nella mia vita qua e là in Europa.
Last but not the least, I would like to express all my gratitude to the miners who work every day deep inside the earth.
ii
Résumé élargi
Afin d'améliorer notre compréhension des phénomènes mécaniques qui induisent la sismicité dans les mines profondes, cette thèse propose d'étudier la réponse des massifs rocheux à l'exploitation minière à travers une approche multi-paramètres. Pour ce faire, les données géophysiques et géotechniques enregistrées in situ ont été comparées et interprétées à l’aide d’un modèle géomécanique 3D, en considérant les caractéristiques de la méthode d’exploitation et de la géologie locale. La méthodologie proposée a été appliquée au gisement de Lappberget dans la mine de Garpenberg (Suède), où le minerai polymétallique est extrait par la méthode « Sublevel stoping » jusqu’à des profondeurs de 1300 m. Cette méthode d’exploitation consiste à extraire le gisement à l’aide de tirs (explosifs) effectués entre deux niveaux consécutifs de la mine, en créant des cavités de 25 m de hauteur, dites « Stopes ».
L'étude s’est déroulée sur une période de deux ans, entre février 2015 et décembre 2016, au cours de laquelle la sismicité induite par l'exploitation minière a été surveillée par un réseau sismique, tandis que les variations de contrainte et de déplacement ont été mesurées par deux cellules de mesure de contrainte et un extensomètre, tous installés près des zones excavées. Au cours de la période d'étude, 52 stopes ont été extraits, dont le Stope 13 qui a été complètement exploité sur toute la hauteur de la zone étudiée. Cela a constitué une occasion unique de suivre la réponse du massif rocheux au fur et à mesure de la progression des excavations.
Les données sismiques enregistrées au cours de la période d'étude ont été analysées en tenant compte de leurs caractéristiques spatio-temporelles par rapport à la production minière. Ensuite, la réponse du massif rocheux a été interprétée en fonction des paramètres sismiques à la source ainsi que d'autres caractéristiques des événements microsismiques. Puis les données sismiques ont été comparées et interprétées avec les mesures géotechniques. Par la suite, un modèle numérique 3D statique, élastoplastique, de grandes dimensions (cube de 1,5 km d’arête), à maillage dense a été construit. Celui-ci intègre la géométrie précise des 4 unités lithologiques observées et le calage avec les mesures de contrainte a permis de retrouver l'état de contrainte vierge. Le modèle simule l’excavation des 52 stopes exploités dans le gisement de Lappberget pendant la période étudiée, ce qui permet d'analyser la réponse du massif rocheux en termes de contraintes et de déformations induites dans toute la zone d'intérêt, ainsi que d'autres paramètres mécaniques. Enfin, les résultats du modèle ont été comparés à l'analyse des données sismiques afin de mieux déterminer tous les mécanismes en jeu.
Le premier résultat a été obtenu par l'étude du catalogue microsismique : on montre que les tirs de production jouent un rôle primordial dans la génération de la sismicité induite, même si l’activité microsismique est plus dépendante de la séquence minière, que du volume exploité. En particulier, le Stope 13, qui a été complètement excavé pendant la période étudiée, a fortement influencé le taux de sismicité. On observe une première période (jusqu'en mai 2016) caractérisée par une faible réponse du massif rocheux à l'exploitation minière, suivie d'une augmentation globale de l'activité sismique pendant une deuxième période de forte réponse à l'exploitation. L’analyse spatiale des événements a mis en évidence deux zones principales d'activité sismique : le cluster central, autour du Stope 13 et près de la zone de production, et le cluster de droite dans la partie Est de la mine, en coïncidence avec une région caractérisée par la présence de certaines zones géologiques faibles (talc-schistes). Le cluster central est sismiquement actif au long de toute la période étudiée, tandis que le
iii cluster de droite ne devient une source intense de sismicité que dans la seconde moitié de 2016, pendant la période de forte réponse du massif rocheux à l'exploitation minière. En général, la sismicité induite dans le gisement de Lappberget présente des magnitudes plutôt faibles si on la compare à d'autres mines à des profondeurs similaires (p. ex. Fritschen, 2010 ; Kgarume et al., 2010 ; Kubacki et al., 2014 ; Vallejos et McKinnon, 2011). En effet, la magnitude du moment (MW) pour l'ensemble des données analysées varie entre -2 ÷ 0,8. Les événements caractérisés par MW ≥ 0 ne représentent qu'une petite partie de l'ensemble des données et se rencontrent principalement dans le cluster central.
La sismicité semble résulter principalement de la réaction directe du massif rocheux aux changements de contraintes induits par les tirs de production, où des augmentations soudaines du taux sismique sont observées immédiatement après les explosions. Cinq des six séquences sismiques analysées sont liées à la production dans le Stope 13. Ceci est valable à la fois pour le cluster central et le cluster droit, de sorte que les événements du cluster droit sont spatialement éloignés des zones excavées, mais temporellement en coïncidence avec les explosions. La sismicité déclenchée dans le cluster droit a été interprétée en tenant compte de divers facteurs concomitants tels que :
(i) des conditions de surcontrainte de la zone du cluster central dans les dernières phases d'exploitation du Stope 13 ;
(ii) la dissipation d’une grande quantité d’énergie coïncidant avec les deux derniers tirs de production dans le Stope 13, et
(iii) la distribution hétérogène du champ de contrainte dans la zone du cluster droit en raison des hétérogénéités lithologiques locales.
En effet, à mesure que l'excavation progresse dans le cluster central, les roches voisines subissent une augmentation de l’état de contrainte et le taux de sismicité augmente rapidement. Lorsque de nouveaux tirs sont réalisés, les contraintes élevées à l'intérieur du volume de roche dynamitée doivent être redistribuées dans le massif rocheux environnant, ce qui influence le champ de contrainte locale dans la zone du cluster droit. Ici, en raison d'une lithologie peu homogène, le champ de contrainte local est réparti de manière hétérogène, avec de fortes contraintes dans les roches rigides entourées de lentilles de faible raideur. En raison de cette configuration particulière, même de faibles changements de contrainte induits par des explosions lointaines (dans le Stope 13) peuvent déclencher une sismicité dans le cluster droit.
En plus du dynamitage, les hétérogénéités géologiques jouent un rôle primordial dans la redistribution du champ de contrainte et, par conséquent, dans la nucléation et la propagation des fractures au sein du cluster droit. Il a été postulé que les fractures dans le cluster droit sont très probablement nucléées à l'intérieur de roches dures et que leur développement est stoppé, en raison de la présence de lentilles faibles au contact direct avec les roches rigides. Par conséquent, les événements du cluster droit présentent des magnitudes et des rayons à la source plus faibles par rapport à la population du cluster central. De plus, en raison de l'hétérogénéité du champ de contrainte locale, les événements du cluster droit sont en moyenne plus énergétiques et se caractérisent par des contraintes apparentes et des chutes de contraintes plus élevées par rapport à la sismicité du cluster central.
En plus du dynamitage et de l’influence de la géologie locale, un deuxième mécanisme, caractérisé par une réponse plus lente et persistante après les tirs, semble être à l'origine de la sismicité à la fois
iv dans le cluster central et dans celui de droite. Cette dernière composante de la sismicité a été considérée comme responsable des réactivations différées du taux de sismicité observé dans la plupart des séquences sismiques analysées, ainsi que de la seule séquence sismique non liée aux tirs de production sur les six séquences observées pendant la période d’étude. Ce second type de sismicité a été associé à des phénomènes de fluage induits par le dynamitage. En effet, de nombreuses observations portent à exclure un mécanisme type « cascade d’événement », lorsque les événements plus forts dans une séquence sismique déclenchent une nouvelle activité sismique par transfert de contraintes. Premièrement, le taux de sismicité n'est pas lié à la taille des événements, de sorte que les réactivations retardées observées dans de nombreuses séquences sismiques analysées ne sont pas induites par des événements microsismiques plus importants. De plus, les réactivations ne se produisent pas nécessairement au même endroit que l'activité sismique précédente, ce qui indique l’occurrence d’un mécanisme agissant à plus grande échelle. Enfin, les réactivations différées de la sismicité sont principalement observées après des périodes d'activité sismique régulière ou après des périodes où aucun événement ne s'est produit. Toutes ces observations impliquent qu'il ne s'agit pas d'une simple cascade d'événements microsismiques qui déclenche des événements supplémentaires, c’est pourquoi un modèle basé sur le fluage a été proposé. Plus précisément, la thèse montre que l'exploitation minière induit des déformations asismiques à travers des phénomènes de fluage dans les roches de faibles caractéristiques mécaniques, qui chargent lentement les aspérités sismiques environnantes jusqu'à leur rupture en provoquant la sismicité.
Ce dernier modèle proposé est en partie confirmé par les mesures de déformation effectuées près du Stope 13 pendant la période étudiée. En effet, leur analyse met en évidence, d'une part, que la plupart des stopes ont été excavés sans induire de phénomènes sismiques, mais plutôt des déformations asismiques. D'autre part, les déformations mesurées montrent des évolutions temporelles, ce qui implique l’occurrence de phénomènes de fluage. Par ailleurs, on observe une bonne proportionnalité entre le taux de sismicité et l'évolution des déformations mesurées dans le temps. Cela implique que l'activité sismique décroit proportionnellement au taux de décroissance des déformations asismiques induites. Cette dernière observation est conforme aux modèles proposés dans la littérature (Bourouis et Bernard, 2007 ; Naoi et al., 2015) où les aspérités sismiques sont chargées et forcées à la rupture à cause du fluage agissant autour de celles-ci.
Dans la deuxième partie de cette thèse, un modèle géomécanique élastoplastique 3D a été réalisé à partir d'une reconstruction précise de la géologie, du calage de l'état de contrainte vierge et du phasage d’excavation minier. Le modèle numérique simule 70 étapes d'excavation. L'objectif du modèle numérique développé dans cette thèse consistait, d'une part, à caractériser plus en profondeur la réponse du massif rocheux à l'exploitation minière dans toute la zone d’étude et, d'autre part, à analyser les corrélations entre les résultats du modèle et la sismicité induite.
En premier lieu, le modèle numérique proposé met en évidence l'influence des zones géologiques faibles sur la distribution des contraintes, des déformations et de la plasticité. En effet, ces zones, caractérisées par des propriétés mécaniques significativement plus faibles par rapport au gisement, ne sont pas en mesure de supporter un chargement important. Par conséquent, les contraintes sont transférées aux roches rigides environnantes, ce qui a pour effet d'élargir l'extension des zones de fortes contraintes, en particulier aux limites des zones faibles. En conséquence, le champ de
v contrainte est hétérogène autour des excavations et de grandes déformations sont observées à l'intérieur des lentilles de talc-schiste.
De plus, la modélisation numérique souligne la forte influence du phasage minier sur la (re)distribution des contraintes. En particulier, il a été démontré qu'en raison du phasage couplé ascendant et descendant choisi pour le Stope 13, le dernier bloc central de ce stope a subi de fortes contraintes qui se sont intensifiées avec la progression des excavations. Cette observation est tout à fait en accord avec les mesures géotechniques effectuées, ainsi qu’avec la sismicité observée, qui s'est intensifiée en coïncidence avec les dernières étapes d'exploitation du Stope 13.
Même si la plupart des résultats de la modélisation numérique semblent être en accord avec les observations sur le terrain, il y a certains aspects de la sismicité induite que le modèle ne peut expliquer entièrement. Premièrement, il est difficile de corréler les résultats du modèle avec la sismicité du cluster de droite. Cela est évident lorsqu'on cherche des corrélations entre l'extension spatiale des zones soumises à de fortes contraintes et les zones plastiques dans le modèle avec les localisations des événements microsismiques. Le cluster de droite se caractérise par des volumes plastiques plutôt faibles et les zones où la plasticité est observée dans le modèle ne coïncident pas avec les zones sismiques actives. De même, les contraintes induites et les changements de contraintes ne semblent pas assez forts pour justifier des niveaux aussi élevés de sismicité induite dans la zone du cluster droit, qui reste très éloignée des excavations (à environne 80 m de distance). D'autre part, en analysant les résultats du modèle numérique à plus petite échelle, c'est-à-dire dans des sphères centrées sur les hypocentres des événements microsismiques, on observe une influence de la production du Stope 13 sur les changements de contraintes dans la zone du cluster droit. Cela démontre que le modèle peut expliquer les changements de contraintes induits dans le cluster droit par des tirs de production effectués à distance, bien que les variations de contraintes soient d'intensité similaire d'une étape à l'autre, de sorte qu'aucune distinction claire ne peut être faite entre les changements de contraintes qui entraînent une sismicité et ceux qui n'ont donné lieu à aucun événement sismique.
Les principales raisons de l'écart observé entre les résultats du modèle et la sismicité du cluster droit doivent être recherchées dans les mécanismes qui peuvent entraîner une sismicité à distance, mais qui ne sont pas inclus dans le modèle. D'après l'analyse des données sismiques, on suppose que la sismicité du cluster droit est fortement influencée par des hétérogénéités géologiques, ce qui donne lieu à des régions où les contraintes sont " accumulées " et où la sismicité induite par des tirs distants est de préférence nucléée. Les hétérogénéités géologiques dans la région du cluster droit ont été attribuées aux grands volumes de matériaux faibles qui sont plus abondants dans cette région de la mine que dans la région centrale et sur le côté Ouest. Cependant, dans le modèle numérique, la seule présence de matériaux faibles ne semble pas suffisante pour induire des contraintes plus élevées et, par conséquent, une activité sismique importante dans le cluster droit. Cela donne à penser qu'un phénomène n’est pas pris en compte dans le modèle. Une première cause peut être liée aux propriétés mécaniques choisies pour les zones de faiblesse, qui n'ont pas été caractérisées par des essais en laboratoire. De plus, le gisement a été considéré comme un matériau homogène caractérisé par les mêmes propriétés dans l'ensemble du modèle. Toutefois, le minerai du secteur se distingue par la présence de sulfures massifs interstratifiés dans du calcaire. Au contraire, à mesure que nous nous déplaçons vers l'Ouest, la géologie devient plus homogène, où la minéralisation se produit dans des réseaux de veines imbriquées dans une unité de micaquartzite. L'hétérogénéité des
vi minerais devrait probablement être prise en compte dans le modèle pour pouvoir reproduire des contextes géologiques plus réalistes et, par conséquent, des conditions plus propices à la sismicité à distance.
Comme expliqué précédemment, la sismicité du cluster droit semble également être influencée par des mécanismes de fluage. Par conséquent, des améliorations au modèle numérique pourraient probablement être obtenues en considérant un modèle de comportement qui prend en compte le fluage des zones faibles, ce qui induirait probablement des transferts de contraintes sur de plus grandes distances. Cependant, des recherches plus approfondies devraient être faites au préalable pour déterminer le modèle de comportement le plus approprié à appliquer et pour choisir une ou plusieurs lithologies auxquelles il serait attribué.
De meilleurs résultats ont été obtenus en comparant les résultats du modèle numérique avec la sismicité du cluster central. C’est particulièrement vrai pour l'analyse des changements de contrainte, de déformation et de plasticité dans le temps, dont la moyenne est calculée dans le modèle à l'intérieur de sphères centrées sur les hypocentres des événements sismiques. Cette analyse met en évidence l'occurrence d'une période où les contraintes calculées au sein du cluster central ne fluctuent que légèrement autour de leur valeur la plus élevée, alors que les déformations et la plasticité continuent à augmenter. On observe une chute de contrainte significative coïncidant avec les deux derniers tirs d'exploitation dans le Stope 13, ce qui a également entraîné le déclenchement des séquences sismiques les plus significatives, dans le cluster central et dans celui de droite. Cette dernière période a été interprétée comme la réponse fragile du massif rocheux au sein du cluster central. La tendance observée pour les contraintes du modèle au cours de cette dernière période est cohérente avec l'idée que la sismicité à distance au sein du cluster droit est déclenchée lorsque le cluster central n'est plus en mesure de supporter des charges supplémentaires.
Enfin, une bonne proportionnalité a été trouvée entre la tendance temporelle du moment sismique cumulatif des événements du cluster central et la variation temporelle de certaines sorties du modèle (notamment l'énergie plastique, le volume plastique et la déformation déviatorique), cumulées dans les sphères. Toutefois, la proportionnalité ne peut être atteinte que lorsque la sismicité est principalement due à des changements de contraintes directement induits par le dynamitage. Dès que d'autres mécanismes non pris en compte dans le modèle (comme le fluage) interviennent dans le déclenchement de la sismicité, les paramètres sismiques et les paramètres du modèle n'ont plus la même tendance temporelle. Malgré cette limitation inhérente aux hypothèses retenues pour la modélisation numérique, ce résultat semble prometteur pour d'éventuelles corrélations quantitatives entre le modèle et les variables sismiques et souligne l'importance de considérer dans le modèle tous les mécanismes qui contribuent à déclencher la sismicité. D'autre part, à ce stade, les corrélations temporelles entre variables sismiques (mesure) et mécaniques (modèle) pourrait servir d'indicateur pour des mécanismes supplémentaires entraînant la sismicité (en plus de ceux s’ajoutant à l’effet immédiat de changement de contrainte induit par le dynamitage).
Les résultats de cette thèse démontrent qu'une approche combinée qui associe les données sismiques et géotechniques à la modélisation numérique peut améliorer considérablement la compréhension de la réponse des massifs rocheux à l'exploitation minière. La combinaison de ces méthodologies dans une approche intégrée peut réduire considérablement leurs limites explicites
vii qui sont évidentes lorsque ces instruments sont considérés séparément. Cela est particulièrement vrai si on veut analyser non seulement le comportement sismique, mais aussi les processus asismiques induits par les excavations souterraines.
viii
List of contents
Chapter 1 – Introduction ... 1
1.1 Mining-induced seismicity mechanisms ... 2
1.2 Monitoring of mining-induced seismicity and hazard assessment ... 5
1.3 Motivation, strategy and structure of this thesis ... 7
Chapter 2 – Study area: Garpenberg mine and Lappberget orebody ... 10
2.1 An introduction to Garpenberg mine ... 10
2.2 Geological setting and initial stress state ... 12
2.2.1 Lappberget orebody and weakness zones ... 14
2.2.2 Initial stress state and elastic rock mass properties ... 15
2.3 Mining method and sequencing ... 20
2.4 Geophysical and geotechnical monitoring in Lappberget ... 23
2.4.1 Extensometer data ... 24
2.4.2 Strain measurements ... 25
2.4.3 Microseismic data... 28
2.5 Seismic activity and observed damage... 29
Chapter 3 – Seismic data processing ... 33
3.1 Routines of seismic data acquisition and processing ... 33
3.1.1 Type of recorded seismic signals ... 36
3.1.2 Challenges and common errors in daily data processing ... 38
3.2 Picking consistency evaluation - The Wadati analysis ... 39
3.3 Evaluation of microseismic network performances ... 42
3.3.1 EMAP algorithm methodology ... 43
3.3.2 EMAP application to Lappberget microseismic network ... 44
3.4 Considerations about the extension of the analyzed area ... 51
3.5 Seismic source parameters estimation ... 53
3.5.1 Considerations on source parameters uncertainties ... 57
Chapter 4 – Rock mass response to mining ... 59
4.1 Spatiotemporal behavior of microseismic activity and mine blasts ... 59
4.1.1 Seismic sequences and clusters... 64
4.2 Analysis of seismic source parameters ... 71
4.2.1 Temporal variation in b-value ... 77
4.3 What drives seismicity? ... 78
4.4 Analysis of geotechnical observations ... 82
4.5 Summary and discussion ... 91
ix
5.1 Numerical modelling techniques... 96
5.2 Model choice and strategy ... 99
5.3 Description of the model ... 100
5.3.1 Model geometry and boundaries ... 100
5.3.2 Model meshing ... 103
5.3.3 Initial and boundary conditions ... 104
5.3.4 Modelled elements and mechanical effect of paste fill ... 106
5.3.5 Constitutive laws and mechanical properties ... 108
5.3.6 Simulated mining sequence ... 112
5.4 Comparison with in situ geotechnical measurements ... 115
5.5 Model results and interpretations ... 117
5.5.1 Analysis of stress distribution ... 118
5.5.2 Analysis of strain distribution ... 124
5.5.3 Analysis of plastic zones and influence of weak geological materials ... 126
5.5.4 Temporal evolution of model parameters ... 128
5.6 Discussion and conclusion ... 129
Chapter 6 – Combined analysis of seismicity and numerical modelling ... 133
6.1 Relating induced seismicity with geomechanical modelling ... 133
6.2 Strategy of comparison in our work ... 136
6.3 Qualitative comparison at large-scale ... 137
6.3.1 Plastic zone and seismic activity ... 137
6.3.2 Instability criteria and seismic activity ... 139
6.4 Quantitative comparison at small-scale ... 144
6.4.1 Model and seismic parameters at punctual locations ... 145
6.4.2 Model and seismic parameters at spheres location ... 149
6.5 Summary and conclusion ... 156
Chapter 7 – Summary, conclusions and perspectives ... 159
7.1 Microseismic and geotechnical data analysis and interpretation ... 160
7.2 Numerical modelling and mining-induced seismicity ... 162
7.3 General perspectives ... 164
Bibliography ………..166
Annex A: Supplementary figures and tables ………..175
Annex B: Galleries and stopes geometry reconstruction ………..182
Annex C: Weakness zones geometry reconstruction ………185
x
List of figures
Fig. 1.1 - Mechanisms of anthropogenic seismicity and industrial activities. ... 1
Fig. 1.2 - Models of fractures mechanisms in mines and the associated P-wave radiation field.. ... 3
Fig. 1.3 - Radiated seismic energy and volume of extracted rock mass ... 7
Fig. 2.1 - Geographical location of Garpenberg mine and its orebodies.. ... 11
Fig. 2.2 - Garpenberg mine production ... 12
Fig. 2.3 - Geological map of Garpenberg area and geological cross section of Lappberget orebody…. 13 Fig. 2.4 - Orebody, weak and very weak geological zones in block 1250 ... 14
Fig. 2.5 - Location of stress measurements and representation of the overcoring method ………16
Fig. 2.6 - Stereographic representation of stress state retrieved by Ineris ... 18
Fig. 2.7 - Stereographic representation of stress state retrieved by SINTEF ... 18
Fig. 2.8 - Plan view of one mine level in block 1250 ... 20
Fig. 2.9 - Excavation geometry in block 1250 ... 21
Fig. 2.10 - Mining sequence in Lappberget block 1250 ... 22
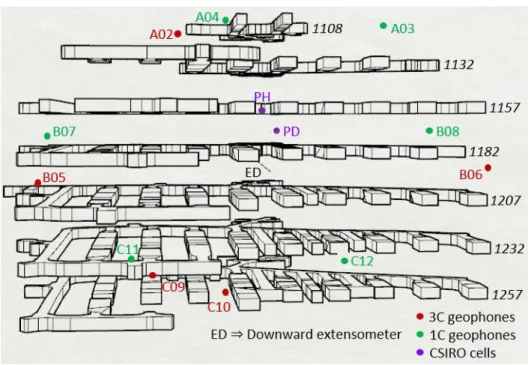
Fig. 2.11 - Geophysical and geotechnical monitoring network ... 23
Fig. 2.12 - Extensometer data ... 24
Fig. 2.13 - Permanent strain measurements ... 26
Fig. 2.14 - Spatiotemporal trend of microseismic activity ... 29
Fig. 2.15 - Boliden database on microseismic activity ... 30
Fig. 2.16 - Observed damage in Lappberget orebody ... 31
Fig. 2.17 - Rock falls due to weak zones ... 31
Fig. 2.18 - Recent failures in 1250 block of Lappberget ... 32
Fig. 3.1 - Lappberget microseismic network ... 34
Fig. 3.2 - Seismograms and spectrograms of some MSE ... 37
Fig. 3.3 - Seismograms and spectrograms of mine blasts, boulder blasts and noise related to mining operations. ... 37
Fig. 3.4 - Modified Wadati diagrams for Lappberget microseismic dataset ... 40
Fig. 3.5 - Example of erroneous picking on a signal related to working activities ... 41
Fig. 3.6 - Root mean square error between theoretical and calculated origin times ... 41
Fig. 3.7 - Schematic illustration of location simulation procedure ... 44
Fig. 3.8 - PGV of S-waves for some located MSE ... 45
Fig. 3.9 - Local magnitudes distribution of Lappberget microseismic events ... 47
Fig. 3.10 - Horizontal profile of minimum detected and located magnitude ... 47
Fig. 3.11 - Vertical profile of minimum detected and located magnitude ... 48
Fig. 3.12 - Distribution of predicted location errors ... 50
Fig. 3.13 - Events located within the Ineris monitored area ... 52
Fig. 3.14 - Events located outside and within the Ineris monitored area ... 53
Fig. 3.15 - Examples of corner frequency and moment magnitude estimation... 54
Fig. 3.16 - Example of seismic data processing before computing spectral ratio ... 56
Fig. 3.17 - Spectral ratio for Q-factor determination ... 56
Fig. 4.1 - Number of microseismic events and mine blasts per hour ... 60
Fig. 4.2 - Temporal distribution of microseismic activity and mine blasts ... 61
xi
Fig. 4.4 - Seismic energy and extracted rock mass volume ... 62
Fig. 4.5 - Space distribution of MSE ... 63
Fig. 4.6 - Comparison between microseismic events number and extracted stope volumes ... 64
Fig. 4.7 - Magnitude-time history chart ... 65
Fig. 4.8 – Space and time distribution of seismic sequences ... 67
Fig. 4.9 - Space and time distribution of Sequence 4 ... 68
Fig. 4.10 - Space distribution of Sequence 5 and Sequence 6 ... 69
Fig. 4.11 - Temporal distribution of Sequence 5 and Sequence 6 ... 71
Fig. 4.12 - Frequency-magnitude relationship for the events within CC and RC ... 72
Fig. 4.13 - Cumulative distribution of source radius for the events within the two clusters. ... 73
Fig. 4.14 - Cumulative distribution of seismic energy and S-wave to P-wave energy ratio ... 74
Fig. 4.15 - Histogram of apparent stress and stress drop ... 76
Fig. 4.16 - Energy-moment and moment-corner frequency relationships ... 76
Fig. 4.17 - Temporal b-value variation... 78
Fig. 4.18 - Probability density function of normalized interevent times ... 79
Fig. 4.19 - Histogram of interevent times τ and interevent time over time... 80
Fig. 4.20 - Seismicity rate and p-value estimation ... 82
Fig. 4.21 - Comparison between excavation advancement in Stope 13, strain measured by PD and PH cells, extensometer data and seismic activity ... 83
Fig. 4.22 - Strain measurements at PH cell during Shift 1 and Shift 2 ... 85
Fig. 4.23 - Strain measurements at PD and PH cells during Shift 3. ... 86
Fig. 4.24 - Strain measurements at PH cell during Shift 4 and Shift 5 ... 87
Fig. 4.25 - Strain measurements at PD and PH cells during Shift 6 ... 87
Fig. 4.26 - Strain measurements at PD and PH cells during Shift 9 ... 88
Fig. 4.27 - Strain measurements at PD and PH cells during Shift 10. ... 89
Fig. 4.28 - Comparison between strain measurements and cumulative number of MSE ... 90
Fig. 4.29 - Comparison between geotechnical measurements and cumulative number of MSE during Sequence 6 ... 91
Fig. 5.1 - Numerical model geometry ... 101
Fig. 5.2 - Galleries and stopes reconstruction in block 1250 ... 102
Fig. 5.3 - Weakness zones reconstruction in block 1250 ... 102
Fig. 5.4 - Final volumetric mesh of the whole numerical model ... 103
Fig. 5.5 - Upper levels, block 1250 and orebody below -1260 m ... 104
Fig. 5.6 - Geometry and mesh of the elementary model for paste fill influence evaluation ... 107
Fig. 5.7 - Hoek and Brown failure criterion for Lappberget modelled materials ... 111
Fig. 5.8 - Illustration of post-failure behaviors for different rock mass qualities ... 111
Fig. 5.9 - Step-by-step galleries and stopes excavation in the numerical modelling ... 113
Fig. 5.10 - Comparison between Plastic Model #2 and #3 ... 114
Fig. 5.11 - Comparison between model and CSIRO cells data ... 115
Fig. 5.12 - Comparison between model and extensometer data ... 117
Fig. 5.13 - Mining sequence at model step 0.13 and 52 ... 118
Fig. 5.14 - Contour plot of XX-stress ... 119
Fig. 5.15 - Principal stress tensor orientation at Step 52 ... 119
Fig. 5.16 - Contours of deviatoric stress along a vertical section ... 120
xii
Fig. 5.18 - Difference in computed deviatoric stress between subsequent excavation steps ... 123
Fig. 5.19 - Contours of deviatoric strains along a vertical section... 124
Fig. 5.20 - Contours of deviatoric strains along horizontal planes ... 125
Fig. 5.21 - Distribution of predicted plastic zones along a vertical section ... 126
Fig. 5.22 - Effect of weak zones on plasticity, stress and strain distribution. ... 127
Fig. 5.23 - Variation in plastic zone extension during time ... 128
Fig. 5.24 - Temporal evolution of model parameters ... 129
Fig. 5.25 - Comparison between elastic and elastoplastic models... 131
Fig. 6.1 - Comparison between plastic zones and microseismic events ... 138
Fig. 6.2 - Predicted “unstable regions” based on BSR criterion ... 141
Fig. 6.3 - Predicted “unstable regions” based on maximum shear stress variation criterion ... 143
Fig. 6.4 - Predicted “unstable regions” based on tensile criterion ... 144
Fig. 6.5 - Point sources locations and spheres ... 145
Fig. 6.6 - Schematization of temporal criterion chosen to associate each MSE to a singular modelled excavation step... 146
Fig. 6.7 - PCA results for the first selected group of parameters ... 147
Fig. 6.8 - Contour maps of mean deviatoric stress and mean apparent stress ... 148
Fig. 6.9 - Mean deviatoric strain and plastic volume within spheres ... 150
Fig. 6.10 - Mean deviatoric stress within spheres and temporal evolution of seismic activity ... 151
Fig. 6.11 - Five regions of the strain-softening response for a moderately jointed rock mass ... 152
Fig. 6.12 - Average deviatoric strains versus average deviatoric stresses ... 153
Fig. 6.13 - Temporal variation of seismic moment and some model parameters ... 155
xiii
List of tables
Tab. 2.1 - Rock mass properties ... 17
Tab. 2.2 - Magnitudes of measured principal stresses ... 17
Tab. 2.3 - Computed initial stress state ... 20
Tab. 2.4 - Characteristics of production blasts and extensometer shifts ... 25
Tab. 2.5 - Characteristics of stress-strain shifts and of related PB ... 27
Tab. 3.1 - Mean values of background noise and PGV of P and S-waves ... 45
Tab. 3.2 - Calibration blast specifications ... 51
Tab. 4.1 - Details of production blasts and microseismic sequences ... 65
Tab. 4.2 - Characteristics of major strain shifts detected by CSIRO cells, displacement shifts measured by downward extensometer (ED) and seismic sequences observed between 2015 and 2016 ... 84
Tab. 4.3 - Summary of major differences observed between CC and RC seismicity ... 92
Tab. 5.1 - Numerical modelling techniques and constitutive models ... 97
Tab. 5.2 - Back-computed virgin state of stress ... 105
Tab. 5.3 - Elastic properties and density of paste fill and orebody ... 106
Tab. 5.4 - Summary of modelled mining sequence ... 107
Tab. 5.5 - Summary of model results ... 108
Tab. 5.6 - Variability in material properties as retrieved from Boliden analysis ... 109
Tab. 5.7 - Retained mechanical parameters for numerical modelling ... 109
Tab. 5.8 - Chosen values of mi and GSI for modelled materials ... 110
Tab. 5.9 - Additional parameters needed for the constitutive law applied to Lappberget ore ... 112
Tab. 5.10 - Differences between performed plastic models ... 114
Tab. 5.11 - Selected model steps and mined-out stopes ... 118
Tab. 6.1 - Selected model steps and mined-out stopes for qualitative comparison ... 137
Tab. 6.2 - Model and seismic parameters considered for comparison ... 146
Tab. 6.3 - Selected groups of model and seismic parameters and variables transformations ... 147
Tab. 6.4 - Seismic sequences and model steps ... 149
Tab. 7.1 - Non-exhaustive list of major advantages and disadvantages of geophysical monitoring, geotechnical measurements and numerical modelling ... 164
xiv
Glossary
Abbreviations
Abbreviation Description
1C 1 component seismic probe
3C 3 components seismic probe
AU Acquisition unit
BB Boulder blast
CC Central cluster
CCM Central cluster in numerical model space
COV Coefficient of variation
DB Development blast
ED Downward Extensometer
EDZ Excavation damaged zone
EMAP Numerical approach for Evaluating Microseismic Array Performances
fft Fast Fourier transform
IMS Institute of Mine Seismology
Ineris French National Institute for Industrial Environment and Risks
IPGP Institute de Physique du Globe
J1,2,3,4,5,6,7,8,9,10,11,12 Gauges of CSIRO cells
MSA Microseismic activity
MSE Microseismic events
N Seismic noise
PB Production blast
PCA Principal component analysis
PD Permanent descending strain cell
pdf Probability density function
PH Permanent horizontal strain cell
R Receiver
RC Right cluster
RCM Right cluster in numerical model space
S1,2,3,4,5,6 Seismic sequences numbered from 1 to 6
SNR Signal-to-noise ratio
UTC Coordinated universal time
xv
Symbols
Symbol Unit Description Symbol Unit Description
A Amplitude s(f) - Receiver amplification site
effect
A0 Amplitude at the source t0 s Origin time
BSR - Brittle shear ratio tP s P-wave time arrival
CFS MPa Coulomb failure stress tS s S-wave time arrival
ΔCFS MPa Coulomb failure stress changes u(f) - Displacement spectra
E J Radiated seismic source energy 𝑢𝑀𝑤 - Moment magnitude spectra
EY Pa Young’s modulus UCS MPa Uniaxial compressive strength
ES/EP - S-wave to P-wave energy ratio VP m/s P-wave velocity
ERR MJ/m2 Energy release rate V
S m/s S-wave velocity
ESS MPa Excess shear stress VP/VS - P-wave velocity to S-wave
velocity ratio
fc Hz Corner frequency Δσ MPa Stress drop
GSI - Geological strength index ε mm/m Strain
I - Instrumental response εq mm/m Von Mises equivalent strain or
deviatoric strain J1,2,3 - Stress tensor invariants ε1 MPa Major principal strain
M0 N·m Seismic moment ε2 MPa Intermediate principal strain
MC - Magnitude of completeness ε3 MPa Minor principal strain
ML - Local magnitude µ N/m2 Shear modulus
Mmin - Minimum detectable magnitude ν - Poisson’s coefficient
MW - Moment magnitude ρ kg/m3 Density
n - Geometrical spreading 𝜎̅ - Stress tensor
p MPa Mean stress σa MPa Apparent stress
PGV m/s Peak ground velocity σc MPa Compressive strength
Q - Quality factor σ1 MPa Major principal stress
q MPa Von Mises equivalent stress or
deviatoric stress σ2 MPa Intermediate principal stress
r m Distance σ3 MPa Minor principal stress
r0 m Source radius τ s Interevent time
xvi
Nomenclature
Name Description
Backfill or paste fill Material pumped into stope voids for being reclosed after exploitation Boulder blasts Blasts performed on isolated blocks of rock to reduce their size
Development blasts Blasts performed in horizontal drill holes to excavate galleries
Drift General term for referring to mine galleries
Footwall Area of bedrock in contact with the orebody at gallery entrance Footwall drift Gallery within the footwall which gives access to the stopes
Hanging wall Area of bedrock in contact with the orebody at the end of galleries Host rock and bedrock The rock surrounding the ore deposit
Ore or orebody Rock containing precious minerals which need to be extracted Production blasts Blasts performed in vertical drill holes to extract the ore
Shotcrete Slurry of concrete sprayed onto walls and roofs of mine galleries
Stope Name given to mined-out areas for orebody extraction
Name given to each column of a mine block Stope back Part of the gallery at the back of an open stope
1
Chapter 1
Introduction
Underground human activities (e.g. mining, petroleum production, fluid injection) produce alterations of the hydro-mechanic rock mass conditions, which can generate rupture phenomena and lead to seismicity when the rock mass strength is exceeded. This man-made seismic activity, generally referred to as anthropogenic seismicity, can cause damage to underground facilities as well as to surrounding urbanized areas, leading to serious socio-economic impacts. In this framework and due to the increasing need for strategic row materials, anthropogenic seismicity is nowadays an important topic which concern both the scientific and the nonscientific communities. Understand the causes which lead to human-related seismicity is thus a fundamental purpose with the aim of mitigating and prevent the associated risks.
Generally, changes in the stress state or in the pore pressure of rock masses surrounding industrial operations are the major mechanisms which can bring to anthropogenic seismicity. According to McGarr et al. (2002), a partial separation of the dominant mechanism can be done considering the type of industrial activity (Fig. 1.1). Therefore, fluid injection operations (e.g. hydrocarbons extraction, geothermal energy production) are mainly associated with seismicity driven by pore pressure increase, while changes in normal and/or shear stress are the mechanisms mostly involved with operations resulting in mass or volume changes (e.g. open pits, underground mines, dams). Finally, a combination of these mechanisms can also be possible, for example in the case of dams and reservoirs, as well as for hydrocarbons extraction. However, this classification is a clear simplification of real mechanisms that are often more complex, such that anthropogenic seismicity remains difficult to forecast and control (Grigoli et al., 2017).
Fig. 1.1 - Mechanisms of anthropogenic seismicity and industrial activities (modified after McGarr et al., 2002). The three corners of the triangle indicate changes in pore pressure (Δp), shear stress (Δτ) and normal stress
(Δσn).
A review of world-wide case studies on anthropogenic seismicity can be found in McGarr et al. (2002), while for a focus on European cases the reader is referred to Grigoli et al. (2017). A recent
Introduction
2 report, published by Ineris (the French National Institute for Industrial Environment and Risks), provides a rich documentation of seismic events caused by disparate underground operations, together with a review of the measures employed to prevent and mitigate associated risks (Contrucci and Klein, 2018). It is worth mentioning that a large and interactive database of human induced earthquakes has been recently published online. Details about this project, together with an extensive review of some of the case studies can be found in Wilson et al. (2017) and Foulger et al. (2018), respectively.
Anthropogenic seismicity related to underground mining excavations, also referred to as mining-induced seismicity, is probably one of the most documented types of seismicity caused by human activities. It is also the most dangerous in terms of injuries and fatalities that directly concern underground mine workers. The first earthquake associated with underground mining activities occurred in South Africa in the last decade of the 19th century. About ten years later, this earthquake was recognized to be caused by mining operations in the Witwatersrand gold mine (McGarr et al., 2002). Since then, and thanks to the installation of underground seismic networks for monitoring mining-induced seismicity, earthquakes related to mining excavations have been observed worldwide. Due to significant depths of exploitation, which can reach up to 4 km, and high extraction rates, mining-induced seismicity is still largely experienced in South Africa, where characteristics of this man-made seismicity have been largely studied by researches (e.g. Boettcher et al., 2015; Durrheim et al., 2006; Durrheim, 2010; Julià et al., 2009; Naoi et al., 2011). Even if fatalities have been reduced, the number is still high with several tens of deaths per year (Foulger et al., 2018). Other countries that experience significant rates of mining-induced seismicity, even with the occurrence of large events, are: Australia (e.g. Hudyma et al., 2008a, 2008b; Hudyma and Potvin, 2004), Canada (e.g. Hudyma, 2009; Milne and Berry, 1976; Potvin and Hudyma, 2001; Urbancic and Trifu, 2000), China (e.g. Li et al., 2007 and the references therein) and USA (e.g. Kubacki et al., 2014; Wang and Ge, 2008). While in Europe, seismicity related to underground mines is mostly experienced in Poland (e.g. Lasocki, 2005; Leśniak and Isakow, 2009; Lizurek et al., 2015; Orlecka-Sikora et al., 2012; Stec, 2007), Germany (e.g. Bischoff et al., 2010; Fritschen, 2010) and Sweden (e.g. Dineva and Boskovic, 2017; Holmgren, 2015; Larsson, 2004; Nuannin et al., 2005; Olivier et al., 2015).
Thanks to decades of researches, many improvements have been achieved in the understanding of mining-induced seismicity and significant efforts have been made to mitigate the associated risks. However, this problem is far from being solved and still represents a major concern for underground stability and mine worker safety. In this framework, this thesis contributes to a deeper understanding of the rock mass response to mining, that is how the rock mass behaves to stress changes induced by excavations. In the following section, major characteristics of mining-induced seismicity are reviewed. Then, motivations, strategies and structure of this thesis are presented.
1.1
Mining-induced seismicity mechanisms
When rock mass volumes are extracted due to underground mine excavations the virgin state of stress is disturbed. This results in the reorganization of the local stress field which can lead to seismic and aseismic strains in surrounding rocks. The seismic component of the rock mass response is linked with rupture phenomena which emits seismic signals transmitted through the rock as elastic waves (Wang and Ge, 2008). Mining-induced seismicity is, thus, the result of fractures propagation inside
Chapter 1 Introduction
3 the rock mass. This seismicity, referred to as microseismic activity, is characterized by small moment magnitudes, generally lower than 0, which do not result in visible damage. However, long-term microseismic activity creates fracture networks within rock masses and thus have an influence on their stability (Wuestefeld et al., 2011). When larger energies are involved in the rupture process, rock failures can occur and these are generally referred to as rockfalls or rockbursts (Cook, 1976). Rockfalls are relatively nonviolent falls of rock under the influence of gravity, whereas rockbursts are associated with a sudden release of strain energy resulting in a violent ejection of rocks (Ortlepp and Stacey, 1994). Rockbursts are the major cause of fatalities in mines (Gibowicz and Kijko, 1994) and their occurrence become progressively more important as the average depth and the extent of mining operations increase (Cook, 1976; Hudyma et al., 2008a; Hudyma and Potvin, 2010). The general term rockburst is commonly employed for describing damaging events with significant different mechanisms. For a classification of rockbursts types the reader is referred to Ortlepp (1997).
Hasegawa et al. (1989) propose six conceptual models of expected source mechanisms in mines (Fig. 1.2). These mechanisms originally described for phenomena observed in Canadian mines have been adopted by many authors in other mining contexts (e.g. Teyssoneyre et al., 2002, Hudyma, 2008, Sileny and Milev, 2008). Unlike natural earthquakes, mine earthquakes may have source mechanisms that are not double-coupled or non-double-coupled (Hasegawa et al., 1989, Sileny and Milev, 2008). The first three mechanisms presented by Hasegawa et al. (1989) belong to this category (Fig. 1.2a, b, and c). These concern the collapse of the roof of the cavity (rockfall) as well as rockburts, pillar burst and tensile fractures. The other three proposed mechanisms correspond to double-couple mechanisms (Fig. 1.2d, e and f). These are due to stress readjustment either on pre-existing faults or with the creation of new fractures at the excavation face.
Fig. 1.2 - Models of fractures mechanisms in mines and the associated P-wave radiation field. In red compression, in blue dilation (Hasegawa et al., 1989, Sileny and Milev, 2008).
Introduction
4 The first mechanism (Fig. 1.2a), namely the block fall of the cavity roof, takes place in two phases. The first is the detachment of rock from the roof, and the second is the fall of this rock on the ground. This phenomenon can be modeled by a simple force directed downwards. Rockburst can be modelled by the same mechanism even if these latter failures release a much greater energy. The pillar burst (Fig. 1.2b) is due to converging vertical forces acting on the pillars. This phenomenon is modeled by a vertical dipole, the associated radiation field is that of an implosion. The third type of failure process (Fig. 1.2c) is related to tensile failures which can occur in the middle of wide rooms or excavations. The forces involved in this mechanism are horizontal and of opposite directions, modelled by a horizontal dipole. Besides non-double-coupled mechanisms, the most common type of fracturing is normal faulting at the mine face (Fig. 1.2d), generally due to stress concentration caused by blasting. Thrust faults (Fig. 1.2e) can occur when the major principal stress is horizontal and mining activities have decreased the vertical stress enough to initiate slip in the intact bedrock or along pre-existing faults. Finally, nearly horizontal reverse faults can also occur over a cavity (Fig. 1.2f). These failures correspond to horizontal layers sliding on each other in response to the cavity roof subsidence. Both normal and inverse faults present a radiation field corresponding to a double-coupled mechanism.
Mining-induced seismicity is usually classified in two distinct categories (e.g. Gibowicz and Kijko, 1994; Hudyma, 2009; Richardson and Jordan, 2002; Stec, 2007): the first, referred as induced seismicity, is the seismicity directly connected with stress changes caused by mining operations, whereas the second, called triggered seismicity, is associated with movements along major geological structures, such as faults and discontinuities. In the first case, the entire rupture process, including its size, and not only its nucleation, is driven by mining-induced stresses. Therefore, these events would not have been occurred without any mining (Dahm et al., 2013). Induced seismicity presents lower magnitudes (M < 1), with events occurring shortly after mine blasts (Richardson and Jordan, 2002). Source mechanisms of induced events can be different from shear, showing explosive type sources (Stec, 2007). On the contrary, in triggered seismicity tectonic stress plays a primary role, and mining activities only contribute for a small fraction of the stress change (Grigoli et al., 2017). Triggered events occur along geological discontinuities prone to failure, such that even small stress perturbation caused by mining can be sufficient for triggering seismicity (Dahm et al., 2013; Stec, 2007). This means that mining nucleates the failure, i.e. have the potential to accelerate a repute which would have occurred naturally, while the rupture process is totally controlled by tectonic stresses (Dahm et al., 2013). These events are normally more energetic, they can occur at some distance from mine workings and can be characterized by an erratic time distribution (Gibowicz and Kijko, 1994), as driven by stress changes at larger temporal and spatial scales.
Apart from the influence of tectonic stress and mining-induced stress, the interaction between subsequent seismic events through static stress transfer has been as well recognized as a mechanism influencing mining seismicity. This was firstly observed in natural seismology (Stein, 1999) and interpreted as a self-triggering between consecutive events, where stress changes induced by larger events strongly affect location and timing of subsequent seismic activity. Marsan et al. (1999) studied spatiotemporal characteristics of seismicity recorded in the Creighton Mine (Canada), observing stress diffusion mechanisms between events and their influence on stronger events occurrence. Within the same mine, Ma et al. (2016) conducted a passive seismic tomography to investigate changes in the stress field before and after the occurrence of major events. They observed significant
Chapter 1 Introduction
5 changes in seismic velocity associated with large magnitude events, indicating increasing stress levels around the locations of major events before and after their occurrence. However, it was not demonstrated whether large magnitude events are the cause of increasing stresses or if these are still an effect of mine production. Orlecka-Sikora et al. (2012) studied two large seismic events (local magnitude higher than 3), occurred in the Rudna copper mine (Poland), to investigate whether their static stress changes could influence subsequent seismicity. Authors found that stress variations induced by major events, evaluated in terms of Coulomb stress change, strongly influenced rate and location of subsequent seismicity in the following two months. In addition, they also pointed out the primary role played by regions characterized by negative Coulomb stress changes. In these areas, the inhibiting effect of stress variation induced by major events appears to prevail over new stress changes imposed by mining front advancement. Authors concluded that stress variation due to larger events should be integrated in routine mine seismic hazard assessment.
More recently, Naoi et al. (2015) discovered small (-5.1 ≤ Mw ≤ -3.6) repeating earthquakes occurring along a fault in a deep South African gold mine. These events are characterized by same location and very similar waveforms, such that, based on cross-correlation analysis, they can be separated into distinct groups according to similarities in their waveforms. Such repeating earthquakes, or simply repeaters, are observed in many tectonic regions (e.g. Nadeau and Johnson, 1998) and are interpreted as the repeating rupture of the same asperity loaded by aseismic creep around it (e.g. Linde et al., 1996; Perfettini and Avouac, 2004). Bourouis and Bernard (2007) observed similar repeaters during water injection in a geothermal field in France. The authors demonstrated that creep is a consequence of pore pressure increase due to water injection within the aseismic part of the fault; then, repeaters are triggered on locked seismic asperities brought to rupture by aseismic slip around them. Similarly, Naoi et al. (2015) interpreted repeaters recorded in the South African mine as ruptures on same asperities repeatedly loaded by surrounding long-term creep. Unfortunately, the authors do not provide information about possible interaction between mining activity and creep phenomenon.
1.2
Monitoring of mining-induced seismicity and hazard assessment
Before major events occur, it is important to analyze the behavior of the induced microseismic activity in an effort of preventing seismic hazardous areas. In this framework, a worldwide recognized tool for studying mining-induced seismicity is the microseismic monitoring technique (e.g. Ge, 2005; Hudyma and Potvin, 2010; Srinivasan et al., 1997), which is nowadays a routine technology for seismic hazard assessment in underground mines. This tool allows quantifying and tracking spatiotemporal and energetic characteristics of the induced seismicity, where microseismic events are fully described by their source location, origin time and at least two other independent source parameters (Mendecki et al., 1999), such as magnitude and radiated energy. One of the advantages of this technology is that mining-induced seismicity presents similar characteristic as natural earthquakes, such that data processing techniques, as well as interpretation approaches, can be directly adopted from natural seismology.Thanks to this favorable characteristic and with the aim of preventing seismic risk, some authors propose to define re-entry protocols after blasting or major seismic events, based on common seismological parameters (Malek and Leslie, 2006; Tierney and Morkel, 2017; Vallejos and Estay,
Introduction
6 2018; Vallejos and McKinnon, 2011, 2010). Re-entry protocols in mines are fundamental to ensure no personnel exposure to seismic hazardous areas, defining restrictions in some regions for a sufficient period of time. In these studies, guidelines for re-entry protocols are, thus, determined defining statistical properties of mining-induced aftershock sequences, based on scaling relations developed in the field of natural seismology, such as the modified Omori law (Utsu et al., 1995), the Gutenberg-Richter law (Gutenberg and Gutenberg-Richter, 1944) and the Bath law (Bath, 1965).
Microseismic events analysis is also used in the attempt of assessing rockbursts hazard and for identifying possible precursors. Many authors observe decrease in b-value of the Gutenberg-Richter law prior to the occurrence of major failures (Kubacki et al., 2014; Liu et al., 2013; Nuannin et al., 2005; Pechmann et al., 2008). Similarly, rise in apparent stress (Wyss and Brune, 1968) can be used for identifying regions of the mine with increasing stress levels (Brown and Hudyma, 2017; Hudyma, 2009), where high magnitude events can occur. Alcott et al. (1998) proposed a rockburst hazard assessment criteria based on seismic source parameters, which was applied to back-analyze seven failures in a Canadian mine. Based on seismic energy, seismic moment and apparent stress criteria, the authors were able to delineate regions of increasing hazard, as well as determine precursory and decay trends. Liu et al. (2013) studied temporal variations of some seismic source parameters for a deep copper mine in China, identifying changes in their behavior before large-scale fractures occurred. The authors interpreted signatures in temporal variations of b-value, apparent volume (Mendecki et al., 1999) and energy index (Van Aswegen and Butler, 1993) as precursory indicators for increasing hazard, which allow identifying warning periods before major events.
All these studies demonstrate the considerable efforts made for rockburst hazard assessment and mitigation, nevertheless prediction, especially at short-term, is far from being achieved. One major aspect which differentiate mining-induced events form natural earthquakes is their inherent dependence on a complex interaction between natural and anthropogenic factors (e.g. Hudyma, 2009; Milev and Spottiswoode, 2002), such as: geological structures and rock mechanical properties, virgin state of stress and mining-induced stress environment, but also mining method, excavated volumes and void geometries. This makes the analysis and the comprehension of induced seismicity more complex, not only because seismic response will be unique at each mine, but also because it requires multiparameter approaches.
Various techniques have been suggested for characterizing the influence of geology and mining practice on the induced seismicity and thus to understand its behavior. Hudyma and Potvin (2010) proposed two sample graphical techniques, the magnitude-time history analysis and the diurnal chart, to understand relations between seismicity and mine production. Milev and Spottiswoode (2002) evaluated seismic activity using the ratio between the cumulative seismic moment and the volume of convergence of mined-out areas, founding that local geology and rock types have an influence on this ratio. Other approaches are based on the correlation between radiated energy or seismic moment with the volume of extracted rock mass (Glowacka and Kijko, 1989; Kijko, 1986; McGarr, 1976). All these techniques aim essentially at determining whether seismicity is a direct response of stress changes induced by blasting or if other factors contribute to increase seismicity rate and define its spatial extent. One example of such seismic hazard assessment is provided by Fritschen (2010), who compared induced seismicity from distinct coal mining districts in Germany. Contrary to the general trend, some coalfields showed different behaviors in the correlation between released seismic energy and volume of extracted coal, as well as in their Gutenberg-Richter distribution. As shown in Fig. 1.3, the correlation between extracted coal and radiated seismic energy
Chapter 1 Introduction
7 is clearly evident for the Ruhr area (Fig. 1.3a), which implies that seismicity is mostly driven by coal production. On the other hand, no correlation can be found for Dilsburg Ost field (Fig. 1.3b). The authors concluded that seismicity of this latter area is not solely driven by coal extraction and that tectonic loads (i.e. triggered seismicity) may have contributed to further increase seismic energy. They, thus, proposed to avoid mining in these highly stressed regions, to prevent the occurrence of large seismic events.
Fig. 1.3 - Radiated seismic energy and volume of extracted rock mass (modified after Fritschen, 2010). Volumes and energies are computed on a monthly basis.
According to Gibowicz (2009), a partial separation between induced and triggered seismicity can be obtained selecting threshold values of magnitude. Indeed, many authors (e.g. Finnie, 1999; Gibowicz & Kijko, 1994; Richardson & Jordan, 2002) have found a bi-modal distribution in the Gutenberg-Richter relation for seismic activity related to mining, which is interpreted as a superposition of induced and triggered events. The former is responsible for the low energy component of the distribution (high b-values), while the latter characterize the high energy component (low b-values). Recognize these two types of mining seismicity within a dataset can be a valuable tool for drawing consistent statistical seismic hazard analyses and for identifying hazardous geological structures (Gibowicz, 2009). On the other hand, it is widely recognized in the literature that seismic activity in mines is mostly induced. That is, most of the seismic activity recorded by underground monitoring networks is directly related with mining. As a result, its spatiotemporal characteristics can be extremely variable, as mining activities are variable in space and time. In this context, hazard related to seismicity directly induced by mining is generally the major concern (Orlecka-Sikora et al., 2012). Understanding relations between mining operations and seismicity is, thus, crucial to develop valuable seismic management strategies.
A deeper discussion on the analyses and the interpretations of mining-induced seismic events will be provided in Chapter 4 of this thesis, together with applications to a real microseismic dataset.
1.3
Motivation, strategy and structure of this thesis
As evinced from the previous section, mining-induced seismicity is a complex phenomenon that depends on many different factors. Its analysis and comprehension are fundamental to characterize and understand the seismic rock mass response to mining. However, to be able to fully describe rock mass behaviors, aseismic processes should as well be taken into account. Indeed, depending on the