Mémoire de recherche, Majeure Finance
Tutor: Ulrich Hege, Professeur associé, HEC Paris
The role of vulture investors in the governance
and reorganization of distressed firms
An empirical analysis of 53 companies filing for Chapter 11
between 1999 and 2004
By
Stian Rafoss Obrestad, H05556
HEC Paris, MSc in Management
A
BSTRACTThis study examines the role of vulture investors in the governance and reorganization of a sample of 53 firms that default on their public debt between 1999 and 2004. The post-restructuring performance and the valuation effects are greater when vultures are involved in the reorganization process. Passive vulture investors tend to outperform vultures which join the board, become the CEO or Chairman, and I therefore find no evidence of superior management abilities among vultures. However, my analysis suggests that vulture investors add value by disciplining managers of distressed firms.
A
CKNOWLEDGEMENTSI would like to thank Ulrich HEGE, Associate Professor of Finance at HEC Paris, for his support and advice in the realization of this research paper.
T
ABLE OF
C
ONTENTS
Abstract ... 2
1. Introduction ... 4
2. Data and vulture involvement ... 10
2.1 Sample selection ... 10
2.2 Vulture involvement ... 11
3. Post-restructuring performance ... 16
3.1 Deviation in assets ... 16
3.2 profitability and return on assets ... 20
3.3 Value creation ... 24
4. Multivariate analysis... 29
5. Summary and Conclusion ... 34
5.1 Summary ... 34 5.2 Conclusion ... 35 6. Appendices ... 37 6.1 Sample overview ... 37 6.2 Newspaper references ... 40 7. References ... 43
1. I
NTRODUCTIONThe market for distressed investments has experienced a rapid growth over the course of the last couple of decades. Not only has the number of distressed funds soared as investors continuously try to find new ways to generate profits, also the secondary market for distressed assets and commercial papers has developed significantly. Today virtually all kinds of distressed claims are traded, from bank loans to legal damages and rejected lease contracts. The marked for distressed and defaulted debt totaled approximately US$ 800 billion1 in 2007, and it is likely to experience a strong growth for the full years of 2008 and 2009. Fueled by an all time high level of bankruptcies2 the Financial Distressed Funds are investing more than ever, and are expected to hold distressed assets with a market value of more than US$ 400 billion3 by the end of this year.
Studies show that the costs and implications of bankruptcy influence several aspects of a company‟s governance. Ross (1977) showed that managerial financial distress costs is a critical assumption underlying capital structure models. The true value of the company is not observable for the market, but observed by the managers. Manager‟s compensation usually is linked to firm value through stock options and other equity related grants, and it therefore gives the managers an incentive to signal favorable information about the company‟s economic prospects. Increased leverage is widely used by the manager to signal that they are running a healthy firm, as huge managerial bankruptcy costs makes it too costly for managers of underperforming firms to imitate the signal. Only managers of healthy firms have incentives to undertake significant debt levels, and increased leverage as a signal of a healthy firm is thus credible to the market. The implication of this theory is that the values of firms will rise with leverage, since increasing leverage increases the market's perception of firm value. Gilson (1990) further elaborates on the theoretical importance of managerial financial distress costs and find that managers experience large personal costs when their firms default. Hence, managers should normally not have incentives to make risky and self-interested actions, which could jeopardize the owner‟s values.
On the other hand, several studies which look at the dynamics of the actions made by managers of financially distressed companies find that agency problems usually are aggravated for
1
Based on Standard & Poors estimates.
2 According to BankruptcyData.com, there have been 79 bankruptcies by public companies this year, with total assets of $145 billion, 69 percent ahead of the pace of 2002, the worst year ever.
companies in financial distress. Bradley and Rosenzweig (1992) suggest that managers chose Chapter 11 reorganization as a mean of entrenchment for a distressed situation, purely based on self-interest. Managers are more likely to keep their jobs through Chapter 11 reorganization compared to liquidating their firm. This is not favorable for the debt holders as they disproportionately bear the risks of continuing a firm's operations. Holding risky debt can be seen as writing a put on the company‟s asset holders have the obligation to pay the difference between the assets and default-free debt value. When the managers refrain from liquidating these assets, the risk of this in-the-money put option being exercised also increases proportionately. Ultimately this represents a value transfer from the debt holders to the equity holders. Also Brown, James and Mooradian (1994) find that managers of distressed companies act in self-interest. Managers that respond to creditor pressure and act in the interest of the most dominant creditors are more likely to be retained by the firm. They therefore randomly sell off asset at prices below liquidation value to please these dominant creditors, and thus increase their likelihood of staying with the firm. The result is that the equity holders are worse off, as they lose the option value associated with a potential increase in the value of the sold assets. Instead a value transfer to the dominant creditors from the equity holders is experienced, which is clearly not in line with the intentions of the shareholders of the firm. All in all we see a general lack of control of distressed firms, in which managers take actions which are likely to maximize their own utility.
Despite several studies suggesting that managers take self-defensive actions when their companies approach financial distress, it is not the coherent view throughout academia. According to Khanna and Poulsen (1995) managers of firms in Chapter 11 compared to managers of a set of control firms make very similar decisions and that, on average, neither set of managers is perceived to be taking value-reducing actions. The managers of the distressed companies however, usually end up as “scapegoats” getting the blame for the difficulties of the company. Khanna and Poulsen highlight two reasons for the managers being blamed. First, the managers are regarded as less competent, with financial distress stemming from their poor judgment as a result. Secondly, when a company run into financial difficulties, managers become more likely to take actions that harm either the whole firm or certain stakeholders. As we saw earlier, academia argued that managers therefore use Chapter 11 entrenchment as a safe haven enabling them to undertake such actions of self-interest. Khanna and Poulsen however, suggest
that this common perception among scholars is wrong. When assessing managerial actions over the three years before filing for Chapter 11 they find similar decisions regarding asset sales, plant closings, reductions in personnel, acquisitions and expansions, new debt and equity issues, equity for debt swaps, and debt restructuring. The market reaction to the announcement of the decision made by the two samples is also the same on average. They therefore conclude that managers of distressed firms are not perceived to be taking value-decreasing or poor decisions before the Chapter 11 filing.
Even though scholars do not reach a homogenous view on whom to blame for a company‟s financial difficulties, the distressed situation represents a great potential for external agents to influence restructurings and discipline managers of distressed firms. The evolution of the market for distressed investments has facilitated a stronger influence from external agents in the governance and reorganization of distressed firms. Contrary to non-distressed firms, bond holders have a strong influence in the governance of the company as the Chapter 114 filings give creditors approval rights in the reorganization. Debt being swapped to equity is usually a likely outcome of such reorganizations. Therefore, investors actively buy outstanding debt claims as well as equity to gain control over the company.
Carl Icahn, Warren Buffet and David Mattlin, are all examples of profiled investors who have acquired outstanding debt claims, aiming to swap the debt into equity in order to gain control over the governance and reorganization of the company. Market practitioners prefer to refer to such companies as distressed debt or special situations funds. In the financial press and in academia however, the term Vulture investors has become a widely used term5 as such investors often are perceived as cynical and tough corporate raiders using troubled distressed companies as their prey. This criticism is often one-sided and only focus on the negative sides of vulture involvement. The motives of the vulture investors however, are as diverse as the debt claims they trade and the distressed companies they target. The various vultures use different strategies. Some vultures take a passive role seeking undervalued debt claims, or simply holding distressed securities as a part of a diversified portfolio. Other investors take a more active strategy through
4 See http://www.uscourts.gov/bankruptcycourts/bankruptcybasics/chapter11.html for further details on the Chapter 11 legislation.
5 I have therefore decided to use the same term in this study when referring this type of investors investing in distressed companies.
so called „bondmailing‟6
or by taking control over the reorganization process. Their principal strategy is to acquire the debt claims, try to gain control of the Chapter 11 reorganization, and then swap the debt into equity to gain control of the company.
The increasing presence of vulture activity has raised the question on how vulture investors can generate superior returns by investing in distressed securities. It has been heavily debated whether it is the vultures‟ use of superior management abilities to exploit the potential agency mismatch of a distressed firm to generate profits, or if there exist more valid reasons for vultures‟ ability to generate profits. Hotchkiss and Mooradian (1997) investigate the role of vulture investors in the governance and reorganization of companies that default on public debt. By comparing the post-restructuring operating performance relative to the pre-default level for companies with vulture investors to companies without vulture investors, they find that companies where the vulture investor becomes CEO or chairman or gains control of the target firm outperform those without vulture involvement. They therefore conclude that vulture investors add value by disciplining managers of distressed firms.
Other scholars however, have attempted to develop alternative hypothesis to explain superior vulture performance. Gilson (1995) highlights three reasons for vultures‟ ability to generate profits. First, the vultures have a superior ability to collect and process information, and thus value a firm‟s assets. Secondly, the vultures have superior negotiation and bargaining skills. In large, these skills are a function of how accurately one values the firm's assets and of how well the investor understands the firm's capital structure. Thirdly, the vulture investors manage to understand the risks of investing in distressed situations. The vultures successfully understand that they are facing firm specific and idiosyncratic risks which cannot be eliminated, but that can be controlled by the use of strong fundamental analysis of the firms operations. Coffee and Klein (1991) suggest that vultures have become experts in acquiring debt claims which optimize their negotiation power, and thus are more successful in the negotiations accompanying distress situations. Noe and Rebello (2003) further elaborate on this, and suggest that a reputation for toughness allows the vulture to limit the value distributed to other claimants. In bankruptcy negotiations, creditors will not accept a payment for their debt claims which are lower than their bankruptcy value. By rejecting the equity holder‟s first-and-final payment offer, the creditor is
6An investor needs only slightly more than one-third of the claims in a particular class to block a reorganization plan. The creditor can therefore threaten to hold up the reorganization unless he is given a higher distribution.
likely to receive a payment which is below bankruptcy values. The creditor is therefore willing to accept an offer that provides him with his bankruptcy payoff. In other words, the equity holder is able to force concessions from the creditors. Because of reputational considerations, the vulture may not be as willing to make concessions to the shareholder as other creditors. Noe and Rebello therefore suggest that the strategy vultures employ when acquiring distressed firm claims impacts their ability to profit from a redistribution of value, with the magnitude of the concessions they are willing to make being proportional to their toughness in negotiations. They conclude that vultures‟ toughness in distressed negotiations rather than superior management abilities is the key to profit generation.
With this study I want to side pass the public perception of vultures as corporate raiders, and rather try to get an objective view on the role vulture investors actually play in the governance and reorganization of financially distressed firms. I will look at to what extent vultures are involved in Chapter 11 reorganizations, and how active they are in the management and governance of the reorganized firm. I will then use post-restructuring performance as a proxy for superior management abilities, to see whether companies run by vultures consistently outperforms companies with a lower degree of vulture influence in the reorganization process.
My study is based on 53 companies who entered Chapter 11 reorganization between 1999 and 2004. I find that vultures are involved in 36 cases (68% of the sample), which are in line with the levels found in earlier studies. Vultures usually gain sufficient power in these companies to discipline management themselves. They join the board of directors of 10 firms (19%) and become CEO or chairman of 14 firms (26%). In line with Hotchkiss and Mooradian (1997) I find superior post-restructuring performance for companies where vultures are involved. However, contrary to Hotchkiss and Mooradian (1997) my analysis shows that improvements in performance relative to pre-default levels are weaker when a vulture joins the board, becomes the CEO or Chairman, relatively to when there is evidence of vulture involvement but the vulture is not subsequently active in the restructured company. When I control for valuation effects I find more or less the same results.
My studies give no evidence of superior management abilities for vulture investors involved in the restructuring. In line with Noe and Rebello (2003) I therefore can‟t conclude that vultures‟ ability to generate superior performance stems from having better management abilities.
However, both the post-restructuring performance and the valuation effects associated with vulture involvement suggest that the threat from external agents have a disciplining effect on managers of distressed companies, and thus add value to the reorganization process. The public perception of vultures as cynical corporate raiders is therefore not justified by empirical evidence.
The remainder of this study is organized as follows. In the next section, I describe my sample and make an analysis of the degree of vulture involvement. In section 3, I look at deviations in asset size. Further I look at post-restructuring performance, and then finish off by looking at valuation effects. Section 4 provides a multivariate analysis highlighting asset size, post-restructuring performance, time in Chapter 11 and degree of vulture involvement. The final section summarizes the findings and contains some concluding observations.
2. D
ATA AND VULTURE INVOLVEMENTIn this section I will describe my sample selection and procedure. I will also give a description of vulture involvement in distressed firms, and give brief characteristics of these firms.
2.1
SAMPLE SELECTION
The study is based on a list of 258 public companies with a total asset size greater than US$ 500 million, which defaulted on public debt between 1999 and 2004. The list was compiled using Lynn M. LoPucki‟s Bankruptcy Research Database7. I mainly want to focus on the companies which manage to emerge from their Chapter 11 filing and remain as a going concern for at least two full fiscal years after their reorganization. Companies mainly file for bankruptcy through Chapter 11 in order to preserve the company as a going concern, while a plan for reorganization is worked out by the creditors. According to Alderson and Betker (1999), a company emerging from bankruptcy must show that its reorganization plan is in the best interest of all claimants. Each creditor class must receive at least as much value as it would under the absolute priority rule in Chapter 7 liquidation. This information is available in a company‟s 8-K and 10-K8 fillings, and I therefore used these fillings to identify those companies which successfully managed to reorganize and emerge from their Chapter 11 filings. Companies which end up filing for Chapter 11 twice within the period will only be counted once.
As Table 1 shows, the distribution of defaults is clustered around 2001-2002, where 52% of the bankruptcies in the sample took place. A total of 53 companies managed to emerge from their Chapter 11 filing and continue their business for at least two consecutive reporting years after their emergence. In order to have sufficient data to assess the post-restructuring performance, I use these companies as the main sample for my further studies of vulture involvement. As for the overall sample, I find that the majority (50%) of the companies emerging from Chapter 11 went bankrupt in the years 2001-2002. In addition I also observe a clear skew towards industries9
7 Lynn M.LoPucki‟s Bankruptcy Research Database: http://lopucki.law.ucla.edu/index.htm
8 These fillings include statements of a bankruptcy plan, which under Section 1125(a) of the 1978 Bankruptcy Code, must include “adequate information that would enable a hypothetical reasonable investor to make an informed judgment about the plan”. Information regarding the reorganized firm, including the firm‟s post-bankruptcy plan and financial projections, is some of the information which is to be found in these statements.
where Industrial Goods & Services and Telecom companies account for 22% and 20% of the Chapter 11 reorganizations respectively.
Table 1
Chapter 11filings for companies with a total asset size greater than US$ 500 Mn, which defaulted on public debt in the period 1999-2004. There is a split between the companies that successfully manage to emerge from chapter 11, and those who end up liquidating their business or taking their business private (P2P).
0 10 20 30 40 50 60 70 80 1999 2000 2001 2002 2003 2004 Emerged from Ch 11 Liquida ted / P2P
2.2
VULTURE INVOLVEMENT
To examine the extent of vulture involvement in the reorganization of the distressed companies I have used the same definition of vulture involvement as Hotchkiss and Mooradian (1997): A vulture investor is considered to be involved in a restructuring if 1) A news story describes the vulture involvement in the target firm10. 2) The vulture becomes an equity holder of the firm as described in a 13-D filing. The fact that buyers of public debt do not have to make similar 13-D filings makes the process complicated. However, when this debt is swapped into equity in the course of a reorganization of the company, there will be made a 13-D filing. In some cases you therefore have to use ex-post equity filings to determine whether vulture investors were holding debt claims in the distressed company. I found evidence of vulture investors being involved in 36 companies (66% of the sample) which is displayed in Table 2. 18% of the vultures‟ involvements
were found through newspaper stories 39% were found through 13-D filings, and 43% were both mention in newspaper searches and in 13-D filings.
To determine whether the vulture investors take an active role in the governance and reorganization of the distressed firms, I look at the changes in management which occurs while the company is in Chapter 11 or as a direct consequence of the reorganization. I define three different categories of involvement: 1) Non-active vulture; No sign of vulture involvement in the governance of the company 2) Vulture on the board; The vulture appoints one or more directors to the board of the company 3) Vulture CEO or Chairman of the board: The vulture nominates either the new CEO, Chairman of the board or both. As for the investigation of whether vultures were involved in the reorganization or not, I used newspaper searches and 10-K filings to determine the level of involvement in the governance and reorganization. As Table 2 shows, my search identified a total of 36 cases (68%) were there are vultures involved in the reorganization process. There are 12 cases (22%) were the vulture investors show no signs of involvement in the reorganization. The vultures are frequently active in the reorganization of the companies. In 10 cases (19%) the vulture gets one or more board seats in the company, and in 14 cases (26%) the vulture actively nominates the CEO and/or the Chairman of the Board.
Companies in financial distress typically suffer from some combination of poor operating performance (firm-specific or industry-related) and suboptimal financial structure. This is also the case for my sample of Chapter 11 reorganizations. The defaulted companies have much higher leverage ratios than the industry in general. They also have below industry-median EBITDA margins and return on assets. In other words, the companies in the sample are not in a very good shape financially.
As we can see in Table 2, the companies use just below one year to reorganize out of their Chapter 11 filings. Franks and Torous (1989) examine the effect of the length of Chapter 11 reorganizations. They find that the more complex the company‟s financing is in terms of number of creditors, the longer time it takes for a company to reorganize out of Chapter 11. Holding risky debt might be viewed as writing a put on the debt holder‟s assets, as the debt holders have the obligation to pay the difference between the asset value and default-free debt value. When the payments to the creditors get delayed, the delay in repayment of debt represent a value transfer from the creditor to the debt holder; The longer time the workout takes the longer the
duration of the option, and the more valuable the option is for the borrower. This increase in option value is a direct value transfer from the debt holder to the holder of equity. As a direct consequence, the creditors usually want to reduce the time in Chapter 11 as much as possible. The market efficiently anticipates and prices in this option value, and it is one of the reasons for the debt of distressed companies being trading at a significant discount, as the value of risky debt can be seen to be the equivalent to the default free value of the debt minus the value of the put option written on the risky debt. Vulture investors usually factor in the potential losses stemming from the fact that option is in the money when buying distressed debt. They want to reduce the value of this put option, and therefore have great incentives to speed up the reorganization. The vulture investors‟ ability to reduce the complexity of the debt structure by acquiring large parts of the debt claims, should also be a good reason for the vultures to be able to reorganize out of Chapter 11 more quickly. However, my findings find no significant difference between reorganizations where vultures were involved compared to reorganizations without vulture involvement.
The average sample firm has a post-bankruptcy asset book value of $3921 million, with a median of $1355 million. The reason for this great dispersion between average and median asset values of the sample relates to the fact that there were several mega bankruptcies included in the sample11. From Table 2 we see the median asset size being greater for the companies without vulture investments. Thus, there might be a tendency towards vulture investors having preferences towards involvement in smaller companies. Franks and Torous (1989) showed that larger firms usually are better able to obtain the administrative skills required to cope with the complexities of the reorganization process. Vulture investors should therefore have preferences towards involvement in smaller reorganizations were they can gain control over the target company more easily. Descriptive statistics however, give no proof of vultures being involved in significantly smaller firms12.
11 Pacific Gas & Electric Co., Mirant Corp., and United Airlines Corporation all had a book value of their total assets greater than $20 Billion the last fiscal year prior to their bankruptcy.
Table 2
Sample description of public companies that defaulted on public debt, which thereby managed to emerge from their respective Chapter 11 filings. The figures are based on the companies‟ reported figures the last fiscal year prior to filing for Chapter 11. The data is obtained from newspaper filings, SEC filings and Datastream. We can see that 36 companies show signs of vulture involvement in their reorganization out of Chapter 11.
Pre-structuring Median (Mean) sample carachteristics
# of cases Days in Chapter 11 Total Assets (US$ Mn) Tot. Liabilities /
Tot. Assets Current Ratio
EBITDA / Sales EBITDA / Total Assets Total Sample 53 320 1355 59,80 % 0,77x 6,76 % 3,87 % (527) (3921) (58,44 %) (1,13x) (-233,30 %) (-13,57 %)
Non Vulture Involvement 17 269 2031 57,06 % 0,65x -0,41 % -0,34 %
(578) (5811) (57,66 %) (0,87x) (-88,35 %) (-34,92 %)
Vulture Involvement 36 337 1169 57,56 % 0,91x 4,60 % 4,50 %
(504) (3028) (56,57 %) (1,24x) (-123,66 %) (-3,48 %)
Vulture not active 12 300 968 51,54 % 1,46x 5,32 % 5,37 %
(668) (3482) (52,35 %) (1,52x) (-10,39 %) (-1,22 %)
Vulture in the board 10 299 1042 59,09 % 0,37x 5,51 % 2,57 %
(341) (1042) (64,04 %) (0,57x) (2,31 %) (-7,73 %)
Vulture CEO or CB 14 442 2417 55,00 % 0,45x 0,52 % 2,01 %
(525) (4320) (54,76 %) (1,30x) (-310,72 %) (-2,38 %)
The sample firms are all highly levered, with most of the companies in the sample having a leverage ratio well above 50%. Contrary to the asset values of the sample, I find more similar debt patterns across the selection, with leverage ratios in the range between 50 – 60%. The companies usually also have current ratios below one, which is strictly below the industry averages. The current ratio is a good indication of a firm‟s liquidity, and levels below one are usually regarded as a sign of coming illiquidity for the company.
From Table 3 we can see that the different investor groups are quite evenly spread out over the different industries, despite some clusters within the different investor groups. Non-vulture investors are overweight in the Travel & Leisure industry, vultures which are not active and vultures which have a member in the board of directors are overweight in the Industrial Goods & Services, while vulture investors which control either the CEO or Chairman of the Board are overweight in the Telecommunications industry.
Table 3
Sample description of public companies which reorganized from Chapter 11, with a split on vulture involvement and the respective industry of the companies reorganized companies. The data is obtained from newspaper filings, SEC filings and Datastream. The industry classification is based on the Level 3 industry classification in Datastream.
0 2 4 6 8 10 12 14 16 18
No Vulture Vulture Not Active Vulture in the boa rd Vulture CEO/CB Utilities
Tra vel & Leisure Telecommunica tions Technology
Reta il
Pers & Househld Goods Oil & Ga s
Media
Ind. Goods & Services Hea lthca re
Food & Bevera ge Fina ncia l Services Construct. & Ma teria l Ba sic Resources Ba nks
3. P
OST-
RESTRUCTURING PERFORMANCEIn this section I will assess differences in the post-restructuring performance between firms with different degrees of vulture involvement. I will start off by looking at post-restructuring size of total assets. I will then relate the findings to the study made by Brown, James and Mooradian (1994) who found that divesting assets in a distressed situation might represent a value transfer from equity holders to the debt holders, and try to link this to whether vulture investors more successfully manage to maintain their pre-restructuring asset levels. Furthermore I will go in the lines of Hotchkiss (1995) and Hotchkiss and Mooradian (1997) and compare ex-post profitability ratios based on cash flows. I will then look at whether there is any in difference value by using the ex-post share price performance as a proxy for value creation. To round up my analysis, I will conduct a multivariate analysis. Through the use of different regressions I will investigate whether there are relationships between superior post-restructuring performance and vulture involvement in the reorganization.
3.1 DEVIATION IN ASSETS
Several studies look at asset sales made by companies in financial distress. Hart and Moore (1991) and Aghlon and Bolton (1992) find evidence that self-interested managers may have an incentive to sell assets at a discount to generate cash to please creditors by buying out their outstanding debt. Moreover, Brown, James and Mooradian (1994) find that management turnover is significantly less for firms that use asset sales to repay debt. This result suggests an avenue through which creditors influence the decisions of management, by being a pivotal force in the decision process for asset sales. They also find that creditors are far better and shareholders worse off when the proceeds of an asset sale are used to reduce the debt overhang by repaying creditors. Hence, managers acting in self-interest represent a serious agency problem which leads to a value transfer from equity holders to debt holders. By looking at differences in the reduction of asset size, I want to investigate whether vulture investors manage to mitigate these agency problems by imposing a stricter control of the asset divestitures of the distressed companies.
Companies that go through a Chapter 11 reorganization struggle to sustain the same asset level as they had prior to the restructuring. As Table 4 shows, all the different categories of companies
in my sample, from non-vulture involvement to companies where the vulture has taken control over the CEO or the Chairman of the board, reduce their assets significantly13 with a median
reduction in total post-restructuring assets ranging from of 25% to 67% for the first reported fiscal year after the restructuring. The pattern in reduction in assets is similar for post-restructuring levels for the +1 and +2 full fiscal years after reorganization. Prior to the analysis, I had a hypothesis that vulture investors that were actively involved in the reorganization of the distressed firm would be able to sustain their assets better. My intuition was that vulture investors, by avoiding hasty asset sell-offs, would manage to mitigate the agency problems relating to management acting in self-interest through selling of assets below face value. Surprisingly enough my statistical analysis proved my hypothesis wrong. Instead it gave me totally opposite results; vulture investors who are active in the reorganization have significantly lower post-restructuring asset levels than companies without or with non-active vulture investors.
Vulture investors‟ impact on asset sales in a Chapter 11 reorganization has not been discussed very frequently by scholars. However, there are some papers which discuss the asset sales of distressed companies. Asquith, Gertner and Scharfstein (1992) and Shieifer and Vishny (1992) found that companies filing for a Chapter 11 reorganization usually overestimate their going-concern value of assets. By selling off assets to repay the debt holders, shareholders of the company lose the option value of the sold assets. Shareholders and partly the managers are reluctant to sell assets as it would represent a value transfer from equity holders to debt holders, and thus tend to overestimate the going concern value of the company‟s assets. They therefore have little incentives to sell of the assets, and thus force the company to keep going despite the fact that the liquidation value of the assets is higher than the going-concern value of the company. Baird and Rasmussen (2003) claim that when vultures get significant control over a company‟s reorganization process, they are better able to prevent fights among themselves that put the assets in jeopardy, and thus no longer fear that the failure to reach a deal with current managers will lead to a piecemeal break-up of the business in which value is lost. Discrete divisions are therefore sold off only because they are thought to maximize value. In addition the sale is thought to give vultures a benchmark they can use to assess whether they are better off converting their claims to equity and appointing a new board of directors to oversee the
13 Due to the fact that the data are not normally distributed or are following some other known theoretical distribution function, I use the non-parametric Wilcoxon signed rank and Mann-Whitney tests to test my data.
enterprise, at least for a time. We therefore see that vultures in charge of a reorganization process are better at mitigating creditor conflicts, they get a more precise view on the going-concern value of the discrete divisions of the distressed firm, and manage to maximize their payoff by selling off assets which have a higher liquidation value than the anticipated going concern value. This is in line with Diane and Denis‟ (2005) findings that show that firms are more likely to emerge as going concerns and to achieve positive post-reorganization profitability if they significantly reduce assets and liabilities while in Chapter 11.
The Chapter 11 reorganization of Comdisco is a good example of a company where the vulture investor is taking control over the distressed company, and manages to preserve values for the owners of the company by taking an active stance in the reorganization of the assets. Comdisco filed for Chapter 11 November 15, 2000. The management shortly after started to offer their assets at discount prices to rivaling companies in a desperate attempt to pile up cash to please their creditors. The main creditors were not happy with the actions being made by the current management, and therefore worked to name a new management. A few weeks after, they ended up naming the turn-around expert Norman Blake as the new CEO and Chairman of the Board14. Shortly after being hired, Blake made the following statement: “Comdisco has been guilty of trying to pursue too many opportunities at once, losing focus as a result”. He claimed that he would evaluate each of the company's businesses, and hired Goldman Sachs to shop the business in order to increase the value for the owners of the company15. Blake worked actively to maximize value through streamlining the business. The company disposed of several of its discrete divisions16, with prices close to or above face value. Amongst others Blake managed to raise the price of Hewlett-Packard‟s bid for Comdisco‟s disaster recovery division from $610 million before filing for bankruptcy, to $835 million within several months of the petition. "The interests of Comdisco's stakeholders have been well-served. The company sold those units that were viable and inherently profitable through an efficient auction process", said Blake after the
14 Comdisco Inc., which provides information technology services, on Wednesday named former hotel executive Norman Blake Jr. as its chairman, president and chief executive, effective immediately.
See REUTERS NEWS, 28 February 2001
15
Comdisco also launched a series of initiatives to capitalize on market opportunities and improve operations. The company hired Goldman Sachs Group Inc. and McKinsey & Co. as advisers to assess alternatives.
See DOW JONES NEWSWIRE, 10 November 2001
16
Comdisco sold its availability services unit to SunGard Data Systems, Inc; the majority of its electronics, lab and scientific, and healthcare leasing assets to divisions of GE Capital Corporation, and certain leasing assets in Australia and New Zealand to Allco International Ltd.
Table 4
Sample description of relative change in pre-restructuring assets .
Median percentage change in total assets relative to pre-restructuring size of total asset. Year – 1 is the fiscal year end prior to filing for Chapter 11, and +1 / +2 is the first/second full fiscal year following the completion of restructuring. Percentage of negative changes is shown in brackets. The sample consists of 53 companies which have successfully emerged from Chapter 11. The data is mainly obtained using Datastram. For 16 of the companies there were no data available in Datastream and I therefore used 10-K reports.
Percentage change in total assets
Year -1 to +1 Year -1 to +2
# of cases Median # of cases Median
Non Vulture Involvement 17 -29,2 %a (94,1 %) 17 -36,5 %a (82,4 %)
Vulture Involvement 36 -33,3 %a (86,1 %) 36 -36,0 %a (80,6 %)
Vulture not active 12 -27,0 %c (83,3 %) 11 -20,1 % (72,7 %)
Vulture in the board 10 -25,3 %b (90,0 %) 10 -37,1 %b (90,0 %) Vulture CEO or CB 14 -67,3 %a, d (85,7 %) 14 -79,5 %b,e (85,7 %)
a,b,c Median change is significantly different from zero based on a two-tailed Wilcoxon signed rank test at a 1%, 5%, or 10% level, respectively.
d,e,f Median of non-vulture/vulture or vulture active / not active / chairman or CB are significantly different at a 1%, 5%, or 10% level, respectively, based on a Mann-Whitney (Wilcoxon rank-sum) test
asset sell-downs were conducted. Blake had reasons to be happy with his achievements. Despite the fact he reduced the post-restructuring size of the assets one year after the reorganization by 96%, he managed to recover nearly 90% of the values of the creditors and simultaneously lead Comdisco out of their Chapter 11 filing.
Similar to the findings made by Hotchkiss and Mooradian (1997), but contrary to the findings by Denis and Rodgers (2005), I find no evidence that the decline in total assets is significantly linked to superior post-restructuring performance. This is the case both for companies with and without vulture involvement in the reorganization process. I therefore find no evidence showing that vultures‟ eagerness to divest assets have a positive effect on the performance for the company as a going concern. On the other hand I have not investigated whether the owners of the assets have gotten the values of their assets maximized with vulture involvement in the reorganization of the firm, which is suggested in recent research. It is therefore hard to draw any conclusions on the vulture involvement‟s effect on asset sell-offs, apart from the fact that vultures are more effective in their divestiture of assets in a distressed situation.
3.2 PROFITABILITY AND RETURN ON ASSETS
As in Hotchkiss (1995) and Alderson and Betker (1999) studies, I evaluate the operating performance of the sample firms for the first two fiscal years after emergence from Chapter 11, by using the operating income to sales. I have decided to use a cash flow measure which is independent from capital structure and depreciation and amortization practices, and define operating income as earnings before interest, taxes, depreciation and amortization (EBITDA). This operating income is then normalized either by sales or total assets. EBITDA margin is a good control variable as it is not directly affected by asset write downs or divestitures, or differences in accounting policies in general. To mitigate differences between industries, I have also made an industry adjusted median. This is done by subtracting the median of an industry portfolio consisting of companies with the same Level 3 in the US.
As Table 5 shows us, at least 60% of the reorganized firms in the sample reported EBITDA margins below the median margin level of the industry. Most of the companies also had below industry return on assets. Thus, my sample has similar characteristics as the one examined by
Hotchkiss and Mooradian (1997) and Alderson and Betker (1999), in that the majority of the firms exhibit poor accounting performance.
From Table 5 we can also see that companies across the investor classes manage to yield a significantly positive EBITDA margin as well as return on assets, with EBITDA margins ranging from 7 to 14% and return on asset margins within more or less the same range, one year after reorganization. However, the industry adjusted median is significantly negative for most of the companies, meaning that they significantly underperform their industry peer group. Vulture investors have significantly higher EBITDA margins and return on assets than companies without vulture involvement. The significance is especially high when you compare the industry adjusted figures. These results are in line with what Hotchkiss and Mooradian (1997) and Alderson and Betker (1999) found in their studies. If we look isolated on vulture investors we see that vulture investors who are active in the governance and reorganization of the firms, actually have lower EBITDA margins and return on asset values than non-active vulture investors on an absolute basis.
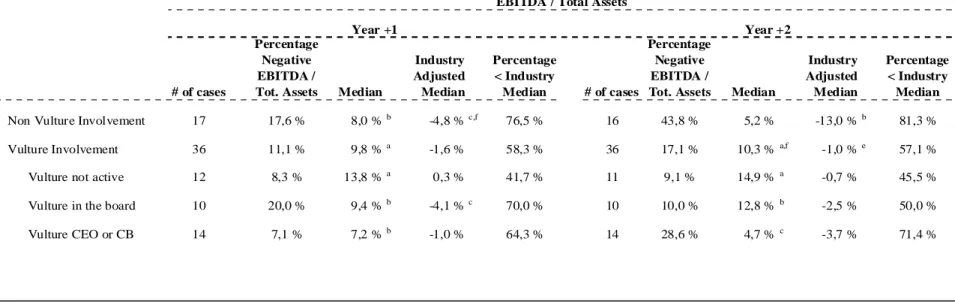
Only a small portion of the companies have negative EBITDA margins and return on asset levels one year after the reorganization. This figure increase significantly for several of the companies two years after the reorganization, showing that many of the companies are not able to sustain the benefits they achieved from the reorganization. Especially companies without vulture investors involved struggle, with the percentage of companies with negative EBITDA margin increasing from 18% to 44% from +1 year to +2 years post-restructuring. For companies with vulture involvement we see a more moderate change from 11 % to 17% from +1 year to +2 years post-restructuring. Further, the companies where vulture investors have taken an active role either through nominating the CEO or Chairman of the Board, underperform the companies where vulture investors are not active. For the non-active vultures, 8% and 9% of their companies have negative EBITDA margins +1 and +2 years after the reorganization, respectively, whereas companies with active vultures have a much greater deviation from 7% to 29%, respectively. This might signify that active vulture investors do not manage to sustain the benefits from the Chapter 11 reorganization in the same way as the companies without active vulture investors, and thus vulture controlled companies are underperforming companies which are led by their old management. .
Table 5
Sample description of post-reorganization performance.
Median EBITDA margin and the return on assets for the sample of 53 firms, for the first/second full fiscal year following the completion of restructuring. The data is mainly obtained using Datastram. For 16 of the companies there were no data available in Datastream and I therefore used 10-K reports. Industry median is adjusted on an absolute basis, by subtracting the median of an industry portfolio consisting of companies with the same Level 3 in the US
EBITDA / Sales Year +1 Year +2 # of cases Percentage Negative EBITDA Median Industry Adjusted Median Percentage < Industry Median # of cases Percentage Negative EBITDA Median Industry Adjusted Median Percentage < Industry Median Non Vulture Involvement 17 17,6 % 10,9 %b -9,8 %b 76,5 % 16 43,8 % 4,2 % -15,0 %b 75,0 %
Vulture Involvement 36 11,1 % 10,2 %a -5,4 %a 77,8 % 36 17,1 % 9,4 %a -6,4 %b,f 77,1 %
Vulture not active 12 8,3 % 14,3 %a -1,2 % 66,7 % 11 9,1 % 13,3 %a -1,3 % 63,6 %
Vulture in the board 10 20,0 % 10,9 %b -6,5 %b 90,0 % 10 10,0 % 12,8 %b -7,9 %c 80,0 %
Vulture CEO or CB 14 7,1 % 7,2 %b -4,6 % 78,6 % 14 28,6 % 7,8 %c,e -8,9 %b 85,7 %
a,b,c Median change is significantly different from zero based on a two-tailed Wilcoxon signed rank test at a 1%, 5%, or 10% level, respectively.
d,e,f Median of non-vulture/vulture or vulture active / not active / chairman or CB are significantly different at a 1%, 5%, or 10% level, respectively, based on a Mann-Whitney (Wilcoxon rank-sum) test
Table 5 continued
EBITDA / Total Assets
Year +1 Year +2
# of cases
Percentage Negative EBITDA /
Tot. Assets Median
Industry Adjusted Median Percentage < Industry Median # of cases Percentage Negative EBITDA /
Tot. Assets Median
Industry Adjusted Median Percentage < Industry Median
Non Vulture Involvement 17 17,6 % 8,0 %b -4,8 %c,f 76,5 % 16 43,8 % 5,2 % -13,0 %b 81,3 %
Vulture Involvement 36 11,1 % 9,8 %a -1,6 % 58,3 % 36 17,1 % 10,3 %a,f -1,0 %e 57,1 %
Vulture not active 12 8,3 % 13,8 %a 0,3 % 41,7 % 11 9,1 % 14,9 %a -0,7 % 45,5 %
Vulture in the board 10 20,0 % 9,4 %b -4,1 %c 70,0 % 10 10,0 % 12,8 %b -2,5 % 50,0 %
Vulture CEO or CB 14 7,1 % 7,2 %b -1,0 % 64,3 % 14 28,6 % 4,7 %c -3,7 % 71,4 %
a,b,c Median change is significantly different from zero based on a two-tailed Wilcoxon signed rank test at a 1%, 5%, or 10% level, respectively.
d,e,f Median of non-vulture/vulture or vulture active / not active / chairman or CB are significantly different at a 1%, 5%, or 10% level, respectively, based on a Mann-Whitney (Wilcoxon rank-sum) test
As we saw in Table 5, vulture investors have higher EBITDA margins and return on assets than non-vulture investors, which is also the case if you compare the vulture investors who are not active with active vulture investors. However, in order to control for differences in pre-reorganization performance, I compare the absolute change in profitability ratios for the last full fiscal year prior to the reorganization with profitability ratios for the first (second) full year after the reorganization. Table 6, shows a significant increase in EBITDA margin as well as return on assets for both non-vulture and vulture investors. However, we see that companies with vulture investors on the board struggle to improve their post-reorganization EBITDA margins.
I find no statistical evidence proving differences between non-vulture and vulture investors in the pre-reorganization performance. This is supported by the statistics in Table 6 which shows only minor differences between non-vulture and vulture investors, both in absolute and in industry adjusted terms. Within vulture investors we see a greater dispersion between the different types of vulture involvement. Vulture investors which are not active in the reorganization generally have higher EBITDA margins and return on assets. However, I do not find any statistical evidence supporting these findings. The lack of statistical differences is somewhat in line with what Hotchkiss and Mooradian (1997) found in their studies. In contrast to my studies however, they found evidence that on an industry-adjusted basis the improvement is greater when the vulture is active in the reorganization of the companies. They also find that the lowest industry adjusted change in performance appears where vultures are involved but not active in the reorganized firm. This is also quite opposite to the results I found in my studies.
3.3 VALUE CREATION
So far the analysis has more or less been focusing on the post-restructuring performance from an accounting perspective, by mainly investigating the developments in EBITDA margins and return on assets. However, these figures do not necessarily give a fair view on the value creation that the owners of the company are experiencing. There are mainly two types of owners of the company; the equity owners and the creditors holding the debt claims. It is usually hard to assess the value creation resulting from a workout. This is especially the case for the creditors. The credits of a firm are usually structured in a very complex way, with different degrees of seniority
Table 6
Change relative to pre-reorganization performance.
Median absolute percentage change in EBITDA margin and return on assets for the sample of 53 firms, the first/second full fiscal year following the completion of restructuring. The percentage of positive cases is shown in parentheses. The data is mainly obtained using Datastram. For 16 of the companies there were no data available in Datastream and I therefore used 10-K reports. Industry median is adjusted on an absolute basis, by subtracting the median of an industry portfolio consisting of companies with the same Level 3 in the US
Percentage change EBITDA/Sales
Year -1 to +1 Year -1 to +2
# of cases Median
Industry Adjusted
Median # of cases Median
Industry Adjusted Median
Non Vulture Involvement 17 10,5 %a (88,2 %) 10,4 %a (76,5 %) 16 8,5 %c (68,8 %) 8,2 % (75,0 %) Vulture Involvement 36 6,3 %a (66,7 %) 8,6 %a (77,8 %) 36 6,9 %a (80,6 %) 8,2 %a (74,3 %) Vulture not active 12 10,2 %a (75,0 %) 9,2 %b (91,7 %) 11 9,3 %a (90,9 %) 10,0 %a (90,9 %)
Vulture in the board 10 -0,5 % (40,0 %) 2,2 % (60,0 %) 10 2,0 % (60,0 %) 2,7 % (50,0 %)
Vulture CEO or CB 14 6,1 %b (78,6 %) 7,4 %b (78,6 %) 14 7,0 %c (71,4 %) 7,5 %c
(78,6 %)
a,b,c Median change is significantly different from zero based on a two-tailed Wilcoxon signed rank test at a 1%, 5%, or 10% level, respectively.
d,e,f Median of non-vulture/vulture or vulture active / not active / chairman or CB are significantly different at a 1%, 5%, or 10% level, respectively, based on a Mann-Whitney (Wilcoxon rank-sum) test
Table 6 continued
Percentage change EBITDA/Total Assets
Year -1 to +1 Year -1 to +2
# of cases Median
Industry Adjusted
Median # of cases Median
Industry Adjusted Median
Non Vulture Involvement 17 10,0 %a (94,1 %) 10,4 %a (88,2 %) 16 10,0 % (75,0 %) 6,0 % (50,0 %)
Vulture Involvement 36 9,3 %a (72,2 %) 8,1 %a (69,4 %) 36 10,9 %a (77,1 %) 8,9 %a (71,4 %) Vulture not active 12 13,2 %b (75,0 %) 10,4 %b (75,0 %) 11 13,1 %b (90,9 %) 4,2 %b (60,0 %)
Vulture in the board 10 1,3 %c (60,0 %) 4,2 % (60,0 %) 10 7,7 %c (70,0 %) 9,6 % (60,0 %)
Vulture CEO or CB 14 11,3 %c (85,7 %) 12,8 % (71,4 %) 14 3,5 %c (85,7 %) 5,9 % (71,4 %)
a,b,c Median change is significantly different from zero based on a two-tailed Wilcoxon signed rank test at a 1%, 5%, or 10% level, respectively.
d,e,f Median of non-vulture/vulture or vulture active / not active / chairman or CB are significantly different at a 1%, 5%, or 10% level, respectively, based on a Mann-Whitney (Wilcoxon rank-sum) test
and subordination among creditors. In addition it is usually hard to get to the fair value of the debt claims, as the secondary market might not be very well developed coupled with the fact that it is not required to disclose credit trades among different parties. In addition, the owners of credit are paid back in different ways. Sometimes they receive a pro rata percent of asset divestments and sometimes they get their debt swapped into equity, which is among the most common way for vulture investors to resolve their claims.
Due to the fact that the assessment of the value of credit claims is quite difficult, I will use the market price of equity as a proxy for ex-post value creation for the reorganized Chapter 11 filings. Most of the companies either remain listed or relist their business shortly after emerging from Chapter 11, and it is therefore possible to get the market‟s view on the value of the business after the reorganization. I have thus look at the share price evolution for the 12 and 24 months preceding the workout, and used this as a measure on value creation. The validity of the market value of the equity as a measure for value creation is disputable. Most of the companies who emerge from Chapter 11 have very volatile share prices, which make it hard to compare the companies to each other like for like. On the other hand I think that the share price serves as a good proxy for the company‟s value creation, as it shows us how the market values the company post-restructuring.
As we can see in Table 7, there are differences in the post-restructuring value creation among the different investor groups. In fact many of the same patterns as we saw related to improvement in EBITDA margin and return on asset, are also present when assessing the post-restructuring value creation. Even if the results are not significant, the companies with vulture involvement have a greater share price development compared to companies without vulture involvement. Further, I find that the vultures which are not active in the reorganization of the firm significantly outperform the companies where vultures are active in the reorganization of the firm. Despite not being significant, companies with non-active vultures involved also have higher post-restructuring share price performance than companies where vultures control the CEO or the Chairman of the Board.
Table 7
Sample description of post-restructuring stock price performance.
Median percentage change in post-restructuring share price for the sample of 53 companies which successfully emerging from their Chapter 11 reorganization. The stock performance is based on the closing price one week after relisting/emergence from Chapter 11, and is compared to the share price 12 and 24 months after. Average share price performance is shown in brackets. The sample consists of 53 companies which have successfully emerged from Chapter 11. The data is mainly obtained using Datastram.
Shareprice development since re-listing
12 months 24 months
# of cases Median # of cases Median
Non Vulture Involvement 17 9,6 % (20,1 %) 17 7,4 % (38,3 %) Vulture Involvement 36 30,9 %a (326,6 %) 36 25,7 %b (524,0 %)
Vulture not active 12 58,2 %b (127,6 %) 11 69,2 %c (163,3 %) Vulture in the board 10 11,9 %f (12,4 %) 10 13,5 %f (12,2 %) Vulture CEO or CB 14 34,0 %c (721,6 %) 14 25,9 % (1199,1 %)
a,b,c Median change is significantly different from zero based on a two-tailed Wilcoxon signed rank test at a 1%, 5%, or 10% level, respectively.
d,e,f Median of non-vulture/vulture or vulture active / not active / chairman or CB are significantly different at a 1%, 5%, or 10% level, respectively, based on a Mann-Whitney (Wilcoxon rank-sum) test
4. M
ULTIVARIATE ANALYSISIn the first part of this study I used descriptive statistics to investigate the relationships between vulture involvement and post-reorganization performance. In order to get a broader view on the analysis, I now turn to a multivariate analysis to further assess the post-reorganization performance. The aim of this analysis is to serve as a compliment to the analysis based on descriptive statistics, and will be based on more or less the same variables. I therefore constructed the following ordinary least square (OLS) regression:
Post-reorganization EBITDA% = γ0 + γRelative change in EBITDA + γLog asset size + γCh 11 duration + γVulture Involvement
I am interested in knowing whether there are differences in the post-restructuring performance of Chapter 11 reorganization where vultures are not active relative to reorganizations were vultures take an active stance in the governance and reorganization. I therefore make five different regressions where an independent variable based on degree of vulture involvement, changes from regression to regression. The dependent variable in each regression is the industry adjusted EBITDA margin for the first full fiscal year following the reorganization. By including the change relative to pre-reorganization performance, for the -1 to +1 full fiscal years after reorganization, I can control whether there are any relationship between improvement in performance and the actual post-restructuring performance. To control whether asset size have any impact, I include log value of total assets as a dependent variable. I also want to control the impact of duration of the reorganization, and have therefore included days in Chapter 11 as an independent variable. Lastly I want to control for vulture involvement and include; No Vulture involvement, vulture involvement, vulture not active, vulture in board and vulture as CEO or chairman as independent binary variables.
The first five rows in Table 8 present regression coefficients for the sample as a whole and the remaining rows present the results of different degrees of vulture involvement. Contrary to the findings made by Hotchkiss and Mooradian (1997), I find that change relative to pre-reorganization performance, for the -1 to +1 full fiscal years after pre-reorganization, have a negative impact on the overall post-reorganization performance. In the regressions where I control for vulture not active, vulture on board, and vulture CEO or Chairman of the board, these negative correlations are significant. This means that companies who manage to improve their
post-reorganization EBITDA margin significantly are likely to have lower EBITDA margins, the first fiscal year after reorganization, than those companies who have minor changes relative to pre-reorganization performance. The reason for the differences in the findings probably stem from the fact that the companies in my sample which had the greatest EBITDA margin improvements usually had very negative pre-reorganization EBITDA margins.These highly negative EBITDA margins usually were a result of large asset impairments or a low level of revenue relative to the cost of operations, and were especially typical for the technology and telecom companies in the sample.17 Let‟s take Covad Communications as an example. Covad Communications managed an absolute improvement in EBITDA margin of 710%, for the -1 to +1 full fiscal years after reorganization. Despite this absolute increase in EBITDA margin, the company still experienced a negative EBITDA margin of -31%, one year after its emergence from Chapter 11. These telecom companies, which mostly were a result of the dot-com bubble, are not present in the Hotchkiss and Mooradian (1997) study. Given that the two samples span over two different timeframes, might therefore explain the different results for the two samples.
Pre-reorganization asset size is significantly related to the post-reorganization performance of the firm, which is true for all types of vulture involvement. The larger total assets size you have prior to the reorganization, the more likely you are to emerge from Chapter 11 with a positive EBITDA margin. One possible reason for this is that larger companies usually have more robust and less volatile EBITDA margins throughout the Chapter 11 filing. In my sample, the top tenth percentile18 ranked by asset size two years prior to filing for Chapter 11, has got a median EBITDA margin of 13,5% relative to a median EBITDA margin of 3,3% for the bottom tenth percentile19. The large companies are thus likely to emerge from Chapter 11 with a higher EBITDA margin than companies with smaller asset sizes.
Denis and Rodgers (2005) found a negative correlation between the time in Chapter 11 and the post restructuring performance. I find the same result in my studies. As we can see from Table 8, all the different classes of vulture involvement are negatively correlated with the duration of the
17 Covad Communications, Global Crossing Ltd, Mpower Holding Corp, and McLoudUSA are examples of such telecom companies, with highly negative EBITDA margins one year prior to filing for Chapter 11.
18
The top tenth percentile ranked on asset size includes Global Crossing, Pacific Gas & Electric Co., Mirant Corp, Finova Group, and NRG Energy.
19 The bottom tenth percentile ranked on asset size includes Exide Technologies, Assisted Living Inc., Advanced Radio Telecom Corp., Komag Inc., and Carmike Cinemas.
Chapter 11 reorganization. However, only the regression which includes vulture involvement has a significant correlation between duration and post-restructuring performance. There might be several reasons for this. Denis and Rodgers (2005) find that firms that are in higher-margin industries reorganize more quickly than those that are not. For my sample this might imply that companies with high EBITDA margins are likely to reorganize out of Chapter 11 more quickly, and thus sustain their superior margins. Increased bankruptcy cost linked to the duration of the Chapter 11 reorganization might be another reason for the negative correlation between duration of the Chapter 11 filing and the post-reorganization performance. Previous studies made by Franks and Torous (1989) and Thorburn (2000) find that duration is a proxy for indirect bankruptcy costs. The rationale is that indirect bankruptcy costs such as bankruptcy‟s adverse impact on product and capital markets increase with the time firms spend in bankruptcy. All of them costs which have a negative effect on the EBITDA margin.
The last four remaining independent variables are related to the type of vulture involvement. These are all binary (dummy) variables controlling for the impact the different types of vulture involvement might have on the post-reorganization performance. Even if there is no significant evidence of vulture involvement having an effect on the post-post reorganization performance, I find some of the same patterns as for the descriptive statistics. If we start by looking at the impact of vulture investors in general in Table 8, vulture investors have a positive impact on the post-restructuring performance. Even if the positive correlation is not statistical significant at a 10% level, the test yields a P-value of 13,8% which makes a positive correlation between the two variables probable. These results are in line with what I found in the descriptive statistics; vulture investors have significantly higher EBITDA margins one year after emergence from Chapter 11. My studies do not give the same degree of significance if we investigate the degree of vulture involvement further. From Table 8 we can see that both vultures which are not active and vultures which control the CEO or Chairman of the Board have more or less the same positive effect on the post-reorganization EBITDA margin. Companies which have vultures involved in the board on the other hand, have a negative effect on the post-reorganization EBITDA margin. These results have a very low degree of significance however, and are therefore not very reliable estimators for post-reorganization performance.
Table 8
Ordinary least square regression (OLS) relating industry-adjusted post-reorganization performance to firm characteristics and vulture involvement.
Industry adjusted EBITDA margin for the first full fiscal year following the reorganization, is used as dependent variable. Total assets are measured in the last full fiscal year prior to reorganization. Change relative to pre-reorganization performance, is based on the absolute change in EBITDA margin for the -1 to +1 full fiscal years after reorganization. Time in Chapter 11, measures the days in Chapter 11. P-values are shown in parentheses. Based on 8-K and 10-K filings for Chapter 11 and emergence from Chapter 11. Vulture involvement is based on 10-K and proxy filings in addition to newspaper articles.
Completed Chapter 11 reorganizations
No Vulture Vulture Involved Vulture - Not Active Vulture - Board Vulture - CEO or CB Constant -0,765 a -0,833 a -0,752 a -0,726 a -0,862 a (0,003) (0,002) (0,004) (0,008) (0,002) Pre-reorganization Industry - -0,025 -0,025 -0,031 c -0,032 c -0,033 b adjusted performance (0,133) (0,133) (0,068) (0,062) (0,043)
Log total assets 0,123 a 0,123 a 0,116 a 0,113 a 0,137 a
(0,004) (0,004) (0,006) (0,010) (3,207)
Time in Chapter 11 -5,1E-05 -5,1E-05 -5,0E-05 -5,0E-05 -8,6E-05 b
No Vulture -0,067 (0,138) Vulture Involved 0,067 (0,138)
Vulture - Not Active
0,037 (0,450) Vulture - Board -0,005 (0,926) Vulture - CEO or CB 0,035 (0,438) N 53 53 53 53 53 Adjusted R-Square 0,158 0,158 0,128 0,118 0,177
5. S
UMMARY ANDC
ONCLUSIONIn this section I will sum up my findings from my studies. I will then conclude on these findings, before I discuss additional analysis which could be conducted in order to further investigate and support my findings.
5.1 SUMMARY
In this paper I have looked at the effect of vulture investors in the reorganization of distressed companies. I used a sample of 53 companies which successfully reorganized out of chapter 11 between 1999 and 2004, and kept their business going for at least two full fiscal years following the reorganization. I find vulture involvement in 36 cases (68%), whereof in 10 cases (19%) the vulture gets one or more board seats in the company, and in 14 cases (26%) the vulture actively nominates the CEO and/or the Chairman of the Board. In other words, vulture investors have a high degree of involvement for the companies emerging from Chapter 11.
If we use time as a proxy for the complexity of the Chapter 11 reorganization, I find no difference between vulture and non-vulture investors. All investor classes use just under one year to work out their Chapter 11 filing. Thus, I find no evidence that vultures are more efficient in their Chapter 11 workouts compared to companies where there are no vulture involvements.
Non-vulture workouts are usually dominated by larger firms. Even though these findings are not significant, there is a skew towards vulture investors being involved in companies with smaller asset sizes. One reason for this might be that larger firms are better able to withstand the pressure from creditors, and therefore are less attractive for vultures to invest in. Further, I find that vulture investors manage to reduce the asset size of the distressed company more effectively than companies with no vulture investors, and are more likely to maximize the ongoing value of the company. On the other hand, I find no evidence supporting the fact that a reduction in asset size is correlated with superior change in pre-reorganization performance. I can therefore not conclude that vulture controlled companies as a going concern are better off given the vulture divestments, as they do not yield superior post-restructuring results relative to the non-vulture investors who do not divest the same amount of assets.