P
ENSION
S
YSTEMS
,
A
GEING AND THE
S
TABILITY AND
G
ROWTH
P
ACT
R
OEL
B
EETSMA
H
EIKKI
O
KSANEN
CES
IFO
W
ORKING
P
APER
N
O
.
2141
C
ATEGORY5:
F
ISCALP
OLICY,
M
ACROECONOMICS ANDG
ROWTHN
OVEMBER2007
© European Communities, 2007
An electronic version of the paper may be downloaded • from the SSRN website: www.SSRN.com • from the RePEc website: www.RePEc.org • from the CESifo website: Twww.CESifo-group.org/wpT
CESifo Working Paper No. 2141
P
ENSION
S
YSTEMS
,
A
GEING AND THE
S
TABILITY AND
G
ROWTH
P
ACT
Abstract
This paper explores how the Stability and Growth Pact may cope with the future costs of
population ageing in the European Union. Clearly, population ageing has forced countries to
reform their pension systems, and will continue to do so, both by reducing the generosity of
pension arrangements and by switching to funding rather than relying on pure pay-as-you go
pension provision. We study how such reforms affect the room for adhering to the Pact, but
also how the Pact may induce or hamper the incentives for reform. In our analysis we will
draw on recent literature on the Pact and on the pensions and the ageing problem. We will
also calibrate a simple model for addressing intergenerational equity.
JEL Code: H55, H62, H63.
Roel Beetsma
Department of Economics
University of Amsterdam
Roetersstraat 11
1018 WB Amsterdam
The Netherlands
[email protected]
Heikki Oksanen
Directorate-General for Economic and
Financial Affairs
European Commission
BU-1, 5/179
1049 Brussels
Belgium
[email protected]
28 September 2007
This paper was prepared while Roel Beetsma stayed at the European Commission under the
DG ECFIN Visiting Fellows Programme in January-February, 2007 (contract number
299/2006/SI2.452.980). He thanks the Commission for the stimulating research environment.
We thank for helpful comments Marco Buti, Antoine Deruennes, Joao Nogueira Martins,
Lucio Pench, Andras Simonovits and Salvador Valdés-Prieto, as well as participants at a
seminar at the European Commission. The usual disclaimer applies.
The views expressed in this paper are the authors’ personal views and do not necessarily
represent those of the Commission or any other organisation they are affiliated with.
2
1. Introduction
This paper aims at addressing the link between two major European policy issues at the heart of the macroeconomic debate. One issue concerns the rising ageing costs over the coming decades and the resulting need for pension reform to cope with these higher expenditures. Starting from a situation in which Pay-As-You-Go (PAYG) pension systems dominate the scene, many politically difficult decisions still need to be taken, although a number of countries have put serious effort into the reform of their pension systems. The other issue concerns the adherence to the EU's fiscal rules. They are enshrined in the Treaty and detailed in the Stability and Growth Pact (SGP). So far, compliance with the Pact has been weak: public debt ratios are on average the same as ten years ago, while the 3% ceiling on the deficit ratio has been frequently violated. Even worse, these violations have taken place under circumstances that are much more favourable in terms of demography than those that lie ahead.
Weak compliance with the original Pact led to its reform in 2005 that accentuated the object of long-term sustainability. Yet, a number of key questions should be posed. If it has already been difficult to adhere to the Pact when ageing costs are on average still relatively moderate, how will compliance with the (revised) Pact be affected when the expected dramatic rise in the ageing costs really sets in? Will the Pact stimulate reforms of pension and health care systems in such a way that the costs can be contained? Is the Pact indeed instrumental in producing long-term sustainability of the public finances? What are the consequences of the Pact for intergenerational equity, i.e. does the Pact provide sufficient incentive to frontload ageing costs, with the aim of easing budgetary pressures to be faced by the subsequent generations?
The remainder of this paper is structured as follows. Section 2 discusses projections of the demography and age-related public spending for the EU-25. Then, in Section 3 we discuss the implementation of the Stability and Growth Pact, both before and after its recent reform, including the links between the SGP and pension reforms and the issues of the implicit pension liabilities and intergenerational equity. While important, the latter two issues are not explicitly addressed in the SGP. Those issues take the centre stage in Section 4, where we set up a model to provide numerical illustrations of public debts, deficits and implicit liabilities under different pension and fiscal arrangements, while paying explicit attention to a transition towards (partial) funding that might be required for intergenerational equity. We link the outcomes explicitly to the restrictions imposed
3
by the SGP. Further implications of this analysis will be discussed in Section 5, while Section 6 concludes the main body of the paper. The Appendix will present the formal model in full while in the main text the references to it are kept minimal.
2. Projections of demography and ageing costs
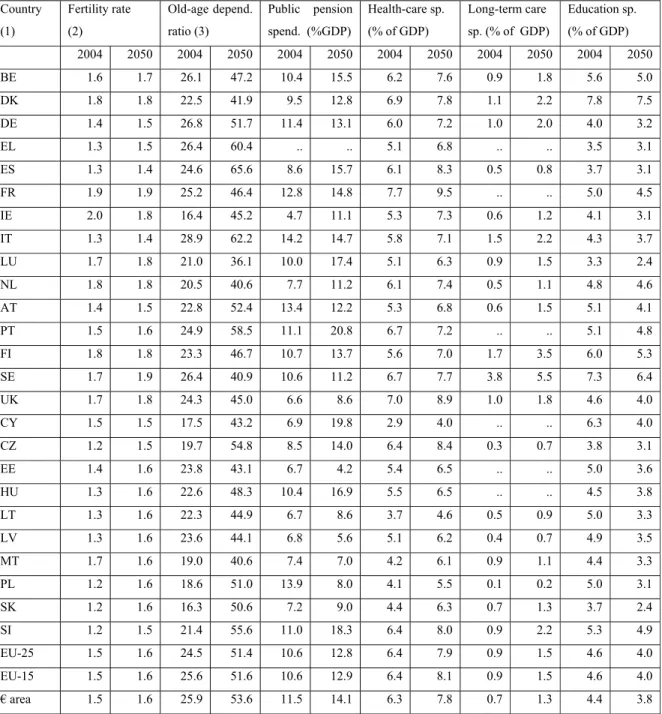
For a comprehensive view of the future budgetary pressures, we present in Table 1 figures for demographic variables, future public pensions and other age-related public expenditures in 2004 and 2050 based on Economic Policy Committee and European Commission (2006a, b), which we henceforth refer to as “EPC projections”.
The projections provide the baseline figures, which are based on unchanged policies. That is, they are based on enacted legislation (that may still need to enter into force) and on a commonly agreed upon set of macroeconomic assumptions regarding the labour force, productivity growth and real interest rates. Pension projections are produced by the Member countries using their own, national models. Projections for the other expenditure items are computed by the European Commission. The projections abstract from potential general equilibrium effects. For example, they do not take into account the possible consequences of rising taxes and premium payments on the labour supply. While there are substantial uncertainties about the outcomes, in particular due to potential deviations of the demographic outcomes from their projections or private sector behavioural responses to the future developments, the figures should suffice to demonstrate the financial severity of the ageing problem.
The old-age dependency ratios (columns 4 and 5, Table 1) are projected to increase in all countries, though not by the same amount. In particular, the Mediterranean countries (Italy, Spain, and Greece) exhibit strong increases in the share of the elderly, primarily due to low fertility. This is also the reason why the most recent EU entrants catch up so dramatically with the other countries in terms of ageing. Existing fertility rates are even lower for these countries than for the Mediterranean countries. Over the long run, fertility rates are projected to converge to some extent, although differences will remain. Differences in the development of pension expenditures, health care and long-term care are determined by differences in demographic changes, as well as differences in the pension and health systems themselves (in particular, the generosity of the benefits).
4
Pension expenditures in 2004 range from 4.7% of GDP in Ireland to 14.2% in Italy. While the average increase in the EU-25 by 2050 is a relatively moderate 2.2%-points of GDP, which is relatively much less than the increase in the old-age-dependency ratio, it hides large differences among the Member States, from the 5.9%-points decrease in Poland to a 12.9%-points increase in Cyprus.
Health-care and long-term care costs are also expected to rise on average roughly at the same relative speed as the pensions. However, the dispersion across countries is smaller. Finally, educational expenses are projected to decline, in line with the falling share of children in the total population.
While very instructive, this data may still miss the full scale of the ageing problem for several reasons. First, judging the pension burden, one should not only consider the outlays on public pensions, but also the burden of the private, funded pensions. This is of particular importance when those private pensions have (largely) a defined-benefit character. If such pension funds are classified outside the public sector accounts,4 then their burden on future workers is hidden from the figures shown in Table 1, but it is as real as the burden presented by public sector pensions. Second, the projections are only up to 2050. The reason why this limitation is important is that the ageing problem persists also in the decades following the projection period. While the generation of baby-boomers will largely have passed away by 2050, the old-age dependency ratio remains high, because fertility is projected to remain low (well below the replacement rate) and life expectancy can reasonably be expected to remain high and maybe rise even further. This matters for public policies, because under such a scenario the problem caused by ageing persists indefinitely, even if the old age dependency ratio stabilises at some (high) level.
5
Table 1: old-age dependency ratios and age-related expenditures
Country (1) Fertility rate (2) Old-age depend. ratio (3) Public pension spend. (%GDP) Health-care sp. (% of GDP) Long-term care sp. (% of GDP) Education sp. (% of GDP) 2004 2050 2004 2050 2004 2050 2004 2050 2004 2050 2004 2050 BE 1.6 1.7 26.1 47.2 10.4 15.5 6.2 7.6 0.9 1.8 5.6 5.0 DK 1.8 1.8 22.5 41.9 9.5 12.8 6.9 7.8 1.1 2.2 7.8 7.5 DE 1.4 1.5 26.8 51.7 11.4 13.1 6.0 7.2 1.0 2.0 4.0 3.2 EL 1.3 1.5 26.4 60.4 .. .. 5.1 6.8 .. .. 3.5 3.1 ES 1.3 1.4 24.6 65.6 8.6 15.7 6.1 8.3 0.5 0.8 3.7 3.1 FR 1.9 1.9 25.2 46.4 12.8 14.8 7.7 9.5 .. .. 5.0 4.5 IE 2.0 1.8 16.4 45.2 4.7 11.1 5.3 7.3 0.6 1.2 4.1 3.1 IT 1.3 1.4 28.9 62.2 14.2 14.7 5.8 7.1 1.5 2.2 4.3 3.7 LU 1.7 1.8 21.0 36.1 10.0 17.4 5.1 6.3 0.9 1.5 3.3 2.4 NL 1.8 1.8 20.5 40.6 7.7 11.2 6.1 7.4 0.5 1.1 4.8 4.6 AT 1.4 1.5 22.8 52.4 13.4 12.2 5.3 6.8 0.6 1.5 5.1 4.1 PT 1.5 1.6 24.9 58.5 11.1 20.8 6.7 7.2 .. .. 5.1 4.8 FI 1.8 1.8 23.3 46.7 10.7 13.7 5.6 7.0 1.7 3.5 6.0 5.3 SE 1.7 1.9 26.4 40.9 10.6 11.2 6.7 7.7 3.8 5.5 7.3 6.4 UK 1.7 1.8 24.3 45.0 6.6 8.6 7.0 8.9 1.0 1.8 4.6 4.0 CY 1.5 1.5 17.5 43.2 6.9 19.8 2.9 4.0 .. .. 6.3 4.0 CZ 1.2 1.5 19.7 54.8 8.5 14.0 6.4 8.4 0.3 0.7 3.8 3.1 EE 1.4 1.6 23.8 43.1 6.7 4.2 5.4 6.5 .. .. 5.0 3.6 HU 1.3 1.6 22.6 48.3 10.4 16.9 5.5 6.5 .. .. 4.5 3.8 LT 1.3 1.6 22.3 44.9 6.7 8.6 3.7 4.6 0.5 0.9 5.0 3.3 LV 1.3 1.6 23.6 44.1 6.8 5.6 5.1 6.2 0.4 0.7 4.9 3.5 MT 1.7 1.6 19.0 40.6 7.4 7.0 4.2 6.1 0.9 1.1 4.4 3.3 PL 1.2 1.6 18.6 51.0 13.9 8.0 4.1 5.5 0.1 0.2 5.0 3.1 SK 1.2 1.6 16.3 50.6 7.2 9.0 4.4 6.3 0.7 1.3 3.7 2.4 SI 1.2 1.5 21.4 55.6 11.0 18.3 6.4 8.0 0.9 2.2 5.3 4.9 EU-25 1.5 1.6 24.5 51.4 10.6 12.8 6.4 7.9 0.9 1.5 4.6 4.0 EU-15 1.5 1.6 25.6 51.6 10.6 12.9 6.4 8.1 0.9 1.5 4.6 4.0 € area 1.5 1.6 25.9 53.6 11.5 14.1 6.3 7.8 0.7 1.3 4.4 3.8 Notes: (1) AT = Austria, BE = Belgium, CY = Cyprus, CZ = Czech Republic, DK = Denmark, DE = Germany, EE =
Estonia, ES = Spain, EL = Greece, FI = Finland, FR = France, HU = Hungary, IE = Ireland, IT = Italy, LV = Latvia, LT = Lithuania, LU = Luxemburg, MT = Malta, NL = Netherlands, PL = Poland, PT = Portugal, SE = Sweden, SI = Slovenia, SK = Slovak Republic, UK = United Kingdom. (2) Fertility is the number of children per woman of child-bearing age. (3) The old-age dependency ratio is the ratio of the number of 65 years and older divided by the number of people in the age group 15-64. (4) “..” = figure not available.
6
3. The Stability and Growth Pact
While monetary policy in the euro area is delegated to the ECB, fiscal policy remains in the hands of the national authorities. They should, however, according to the Treaty agreed in Maastricht in 1991, comply with the principle of sound public finances. To ensure this the Treaty prohibits central bank financing to governments, their privileged access to other financial institutions and the bail-out of debts of any public entity with the help of the European Community or its Member States. A bail-out of a Member State in severe budgetary trouble by raising inflation to erode the real burden of its debt servicing costs was also excluded by setting price stability as the primary objective of the ECB. This arsenal of protection measures was still complemented by laying out an Excessive Deficit Procedure (EDP) with reference values for deficits (3% of GDP) and debt (60% of GDP). Yet, some countries believed that all this would still not be sufficient guarantee for the ECB to be able to operate independently and achieve price stability. This fear led the German Finance Minister at the time to come up with a proposal for a so-called Stability Pact that would lead to automatic financial punishments for countries with excessive deficits. However, the eventual agreement was coined the "Stability and Growth Pact" to reflect the view of some Member States (in particular, France) that the task of the EU fiscal framework was also to stimulate economic activity. Moreover, the automatic fines were replaced by a complex procedure of increasing severity of punishments that would only in the end lead to the payment of fines (see Eichengreen and Wyplosz, 1998, for a more detailed discussion on the SGP and its rationales).
3.1. The original Pact
The Pact basically makes the Treaty-based Excessive Deficit Procedure operational. It is part of secondary law in the EU and can be amended without changing the Treaty on the European Union. It is composed of two components. One arm (the Regulation “on the Strengthening of Surveillance of Budgetary Positions and the Surveillance and Coordination of Economic Policies”) aims at preventing excessive deficits by requiring countries to strive for a budget that is close to balance or in surplus in the medium run. This way, countries build up a safety margin that prevents the deficit from rising above its reference level of 3% of GDP when the economy is in a downturn. The safety margin thus allows the automatic stabilizers to do their work (see Buti et al., 1998), unless the economy falls into a very severe recession. As part of this Regulation, euro area members have to submit a “Stability Program” every year, in which they set out its budgetary path
7
for the coming years and the measures that underpin the projected path. EU countries that have not (yet) adopted the euro, submit similar “Convergence Programs”. The programs are assessed by the Commission, which provides recommendations on their content, after which the ECOFIN Council gives its opinion.
The other regulation is that on “Speeding up and Clarifying the Implementation of the Excessive Deficit Procedure”. This is the corrective arm of the Pact setting out the provisions for adhering to the Treaty based objectives that the deficit should stay below 3% of GDP, while the public debt should remain below 60% of GDP, or be decreasing at a sufficient pace. In practice, only the deficit criterion is enforced through specific measures. If an excessive deficit is detected, the Commission and the ECOFIN Council put in motion the Excessive Deficit Procedure (EDP). The EDP foresees measures of increasing severity the longer the country maintains its excessive deficit. The country may even undergo financial penalties, first in the form of a non-interest bearing deposit, which can be turned into a fine, if the country does not correct the deficit before the prescribed deadline.
3.2. Evaluation of the Pact and comparison with reform proposals in the literature
Motivated by the (expected) problems with the implementation of the SGP, a large number of experts have put forward more specific proposals to change the SGP, including the proposal to abolish the Pact. Fischer et al. (2006) classify the various proposals, though they restrict themselves to proposals made before 20 March 2005, the date when the European Council (2005) approved the outline for the revision of the Pact. Proposals are based on a variety of arguments. One major group of proposals concerns the lack of credibility of the original framework. Their proposals mainly aim at institutional and procedural changes that strengthen the incentives for fiscal discipline. A noticeable example is Wyplosz' (2005) proposal for independent fiscal policy councils, so that the ECOFIN members no longer judge each other's policies. Related proposals were also made in von Hagen (2002) and Fatas et al. (2003). A second group emphasizes that fiscal rules should shift focus to economic growth. For example, Fitoussi (2002) argues that fiscal rules should be contingent on the state of the economy. In particular, he argues in favour of replacing the current deficit rule with a debt rule, which would allow more flexibility in response to an economic downturn. Blanchard and Giavazzi (2004) advocate golden rules or capital budgeting to fix the alleged disincentive for public investments under the SGP. A third group of proposals focuses on long-term
8
sustainability. Also this group is in favour of more prominence of public debt instead of deficits. An example is Pisani-Ferry (2002). He also advocates more emphasis on the medium run monitoring of comprehensive public finance figures. Calmfors and Corsetti (2004) propose an SGP deficit ceiling that is explicitly dependent on the public debt. Buiter and Grafe (2004) present the “permanent balance rule”, which allows a higher deficit in response to transfer payments, government consumption and gross capital formation that exceed their permanent (that is, roughly speaking, the average expected future) levels. In their view it is of particular importance that the countries that entered the EU after the turn of the century and where infrastructure is in a deplorable state implying a need for temporarily high investment in public capital, be allowed to run a temporarily higher deficit. More importantly, they consider that the increase in future PAYG public pensions causes the permanent level of pension transfers to exceed current pension transfers, which implies the need for reducing debt, i.e. producing smaller public deficits or even surpluses.
A major virtue of the permanent balance rule is that it is aimed at keeping the tax rate constant (as long as no new information arrives) and that it would thereby help to reduce distortionary losses. A major complication, of course, is that the rule would require projections of budgetary variables long into the future. In addition, it is not clear how it should be enforced.
Although the issue of fiscal sustainability is high on the priority list of a number of these proposals, somewhat surprisingly existing proposals have paid very little, if any, attention to the question how the SGP could be better aligned with the need to reform pension systems. The articles by Beetsma and Debrun (2004, 2007) are somewhat of an exception. They argue that a strict implementation of a deficit rule may hamper structural reforms if such reforms entail large upfront costs. Obviously, this is not the case for all types of structural reforms (such as reforms that involve a widening of the tax base at given tax rates). However, this is certainly the case for some types of reforms, such as a shift of the pension system towards more funding. Beetsma and Debrun's (2004, 2007) variable for upfront cost also includes compensation that needs to be provided to get the support from those who lose out on the reforms.
9
The revision of the Stability and Growth Pact was agreed at the European Council in March 2005, after the Pact had been put on hold at the end of 2003 as a result of the failure to follow its formal procedure in the case of the excessive deficits of Germany and France.5 There was a general recognition that the Pact should handle the protracted slowdown of these economies in an adequate way and that it would make sense to have a Pact that would discourage pro-cyclical fiscal behaviour (by inducing countries to strengthen their public finances during good times in order to have more room for manoeuvre during bad times) and pay more attention to long-run fiscal sustainability (see also Buti and Nogueira Martins, 2006).
The definition of the medium term objective (MTO) was made country-specific, taking account of potential growth and of the debt level, subject to possible revision when major structural reforms are implemented and in any case every four years. For countries that have already adopted the euro or participate in ERM-II, the MTO ranges from a minimum of -1% of GDP for low debt or high potential growth countries to budget balance or surplus for high debt/low potential growth countries. The MTOs are defined net of one-off and temporary measures. As long as a country has not yet reached its MTO, it should achieve an annual reduction in its cyclically adjusted deficit, again net of one-off and temporary measures, of at least 0.5% of GDP. The short-run costs of structural reforms are explicitly recognized for defining the adjustment path to the MTO, but in general not directly for the determination of the MTO itself.
5Apart from the fact that in many Member States deficits exceeded 3% there was a particular issue that
triggered the crisis in implementing the SGP in 2003. It was the question as to what should happen when the Member States in excessive deficit have implemented the recommendations given to it, but exogenous factors turn out to be more unfavourable than expected and the deficit therefore does not decline. This was especially relevant for Germany in 2003. The Commission took the view that it was legally obliged to recommend moving to the next stage on the road towards sanctions while Germany, supported by France, wanted to go back to the previous recommendations and revise them (Korkman, 2005, p. 117). This dispute caused a deadlock in the Council as the required qualified majority was not found under the correct legal procedure to any decision. In the subsequent ruling the Court of Justice of the European Communities (2004) considered (among other things) that recommendations given at the earlier stage can indeed be modified by the Council, but this cannot happen without a fresh recommendation from the Commission (paragraph 92). After this clarification to the original SGP the possibility of repeating the steps was made explicit in the revised SGP, i.e. in the modifications to the SGP regulation in question.
10
3.4. Pension system reform and the revised SGP
Traditionally, only the Netherlands, Denmark and the United Kingdom have featured a substantial funded pension pillar, while in most EU countries pensions are largely unfunded.6 If strictly applied, a pure PAYG pension system means that contributions into the system exactly match the pension payments. Hence, the presence of such a system neither affects government deficit nor public debt. However, the consequence of a pure PAYG system is that over the coming decades fewer workers would have to finance the pension benefits of an increasing number of retirees. Hence, in the absence of a reduction in pension benefits or an increase in the retirement age, PAYG pension premium payments have to increase substantially. This has two major implications. One is a potentially unfair distribution of the aging costs with future workers at the losing end. The other is that high premium payments may distort the labour supply, although the precise effects depend on the intra-temporal trade off between income and substitution effects and on the scope for inter-temporal substitution in labour supply.7 In addition to the rise in the number of pensions to be paid out for each working person, also other age-related expenditures, in particular health care and long-term care will increase. While the old usually do make contributions to the health care system, they receive a disproportionate share of its benefits.
The projected rise in the future financial burden on workers in the absence of reform may easily induce governments to take economically unsound measures. Governments may start to finance the rising expenditures by running deficits and issuing debt, thereby potentially violating the rules of the SGP. Alternatively, or in combination, they may resort to one-off measures such as the sale of public assets or substituting explicit debt for off-balance liabilities. For example, in the recent past some countries (France and Germany) received a cash-inflow in return for an increase in future pension liabilities (see Coeuré and Pisani-Ferry, 2005). Empirical evidence suggests that such budgetary gimmickry has been widely applied – see Milesi-Ferretti and Morriyama (2004), von
6 An overview of European pension systems is found in European Commission (2006a), pages 52-56. A
scheme of the pension reforms in the EU is contained in the European Commission (2006b), pages 28-31. See also Whiteford and Whitehouse (2006).
7 Disposable (after-tax) income falls. In order to (partially) make up for this reduction in consumption
possibilities, individuals increase their labour supply. The substitution effect works in the opposite direction. Leisure becomes relatively cheaper in terms of the foregone net wage. This produces a negative effect on the incentive to work. What is the overall effect of these two forces depends on the specific preferences entertained by individuals. Inter-temporal substitution produces a shift in labour supply from
11
Hagen and Wolff (2004) and Koen and Van den Noord (2005). However, the reformed SGP at least partly addresses this issue, as the main fiscal indicator is the structural balance net of temporary factors and one-off measures.
In anticipation of the rising ageing costs and to more evenly share the costs of old-age pension provision among the generations, countries have started to introduce both systemic and parametric reforms in their pension systems. Italy, Latvia, Poland and Sweden transformed their old Defined Benefit (DB) PAYG systems to Notional Defined Contribution (NDC) systems where the pension contributions earn an administratively determined return, basically equal (or closely related) to the rate of growth of the wage bill and the notional capital is converted at retirement into an annuity. This rule to a great extent takes care of adjusting pension according to the number of employees and change in longevity. The latter three of these countries also set up mandatory funded tiers with personal accounts. Some countries have introduced personal retirement accounts, often supported by tax incentives (for example, Estonia, Ireland, Germany and Lithuania) or made mandatory to new labour market entrants or specific groups (such as Hungary, Slovakia and Slovenia). Also, the role of funded private supplementary occupational pensions is increasing. Countries are also undertaking parametric reforms to ease the pressure on future public resources. Among those measures, most countries are gradually raising the retirement age, increasing the contribution period for a full pension, linking pensions to improvements in life expectancy, limiting early retirement and introducing bonuses for working longer. Also, indexation of pension benefits has in some countries been shifted from wages to prices (France and Austria). Furthermore, in some countries, pre-funding within or linked to public DB systems remains significant (Finland) or has recently been introduced (Belgium and Ireland). Overall, apart from measures to increase the effective retirement age, pension funding is acquiring a more important role in pension systems, although PAYG remains dominant so far.
Privatisation that (normally) replaces part of the public pension system by a private sector managed fully funded tier triggers a transition during which a stock of assets is built up in the newly established funded pillar, while at the same moment the pensions of the current retirees need to be financed.8 To ease the transition, the government may start
periods when premium payments are high (and, thus, the net wage is low) to periods when premium payments are low.
8 This is the counterpart of the windfall gain that the first generation of retirees receives when a PAYG
12
issuing debt, making some of the implicit debt explicit. However, the problem here is that the public deficit and debt increase, while the fall in implicit liabilities due to the reduction of future pension payments from the PAYG pillar is not recognised in the national accounts relevant for the SGP assessments. In addition, in most cases the emerging surplus in the new funded pillar will not be part of the government accounts as, according to the decision by Eurostat (2004), funded defined-contribution schemes should be recorded as part of the private sector.9
The transition from the original system to a (partially) funded system outside the government accounts may thus lead to a potential conflict with the rules of the SGP. The preventive arm of the revised SGP takes this into account as follows:
"…The Council acknowledges that special attention must be paid to pension reforms introducing a multi-pillar system that includes a mandatory, fully funded pillar. Although these reforms entail a short-term deterioration of public finances during the implementation period, the long-term sustainability of public finances is clearly improved. The Council therefore agrees that Member States implementing such reforms should be allowed to deviate from the adjustment path towards the MTO, or from the MTO itself. The deviation from the MTO should reflect the net cost of the reform to the publicly managed pillar, provided the deviation remains temporary and an appropriate safety margin to the reference value is preserved. "
In the corrective arm the leeway provided by the revision of the SGP is specified in the following way:
"…Consideration to the net cost of the reform will be given for the initial five years after a Member State has introduced a mandatory fully-funded system, or five years after 2004 for Member States that have already introduced such a system. Furthermore, it will also be regressive, i.e. during a period of five years consideration will be given to 100, 80, 60, 40 and 20 percent of the net cost of the reform to the publicly managed pillar." (European Council, 2005; also ECOFIN Council, 2005).
We should note here that the allowed deviations from the (path to) the MTO and the reference deficit level as a share of the cost are falling over time and restricted to five years only, while transitions during pension reforms typically last for decades (for a detailed presentation of these rules, see European Commission, 2007).
9 This decision by Eurostat concerned the defined contribution, funded pension systems that may be
managed by the government. It considered that the fund’s assets are ultimately owned by the participants, who are the ones that bear the risk associated with the return on the assets. Therefore, they should be classified in the private sector. For the defined benefit schemes an important criterion is the degree of funding. The Dutch occupational defined-benefit system is classified in the private sector as it is fully funded while the Finnish partially mandatory defined-benefit system falls within general government as the degree of funding is only about a quarter.
13
Moreover, the new SGP provisions can alleviate only a shift from PAYG towards partial privatisation. Other reforms, such as reductions in the generosity of future pension benefits and increases in retirement age are not directly facilitated for the simple reason that they do not lead to short-run costs.10 However, they are indirectly facilitated by the new SGP through the emphasis it puts on sustainability.
3.5. Treatment of implicit liabilities and long-term sustainability
In revising the SGP it was recognised that implicit liabilities, notably those related to population ageing should be taken into account in setting the MTOs. However, the criteria and modalities were left open for further agreement in the Council. Current practice partly follows the lines of Buiter (1985): based on the projection of increasing expenditures the constant tax rate that covers future expenditure and the servicing of the current debt is calculated and this is compared to the tax rate under current policies. The difference between the two is called the 'sustainability gap'. Given the expenditure projection, it indicates the permanent budgetary adjustment that ensures that the inter-temporal budget constraint is fulfilled over an infinite horizon.11 The European Commission (2006) presents its implications as the required primary balance over a specified period in the medium term, adding, however, that setting budget adjustment targets along these lines would require a large adjustment in most countries. Therefore, it argues, along the lines expressed by the European Council (2005), that adjusting future expenditure downwards by implementing structural reforms should be part of a policy package for reaching sustainability.
As part of the preventive arm of the SGP Member States are asked to address long-term sustainability in their Stability and Convergence Programmes. According to the ECOFIN
10 While there exist a number of papers that deal with the political-economy effects of population ageing
on pension arrangements (for example, Conesa and Krueger, 1999, and Gonzalez-Eiras and Niepelt, 2005), there are only a few papers that also make a formal connection with Stability and Growth Pact. A notable example is Tabellini (2003) who considers "a pension reform that gradually but permanently reduces pension outlays in the future, but immediately cuts social security contributions so as to relax political constraints". He notes that a "transition from a pay-as-you-go towards a fully funded private pension system could have this effect", and further notes that such a reform could violate the SGP, no matter how desirable from an economic point of view.
11 See also Buiter and Grafe (2004). This method is also used by the Board of Trustees of the US Social
Security system (Board of Trustees, 2007). Since 1988 they have reported the measure for an immediate adjustment for balance over a 75 years period. However, as this does not properly reflect the (likely) imbalance at the end of the period, they have from 2003 onwards reported this measure also for the infinite horizon. The latter is the same as the sustainability gap referred to here.
14
Council (2005), setting up the guidelines "…the programmes should outline the countries’ strategies to ensure the sustainability of public finances, especially in light of the economic and budgetary impact of ageing population." Further, the ECOFIN Council (2005) says: "The programmes should include all the necessary additional information, both of qualitative and quantitative nature, so as to enable the Commission and the Council to assess the sustainability of Member States of public finances based on current policies…. Programmes should clearly distinguish between measures that have been enacted and measures that are envisaged." By reporting long-term projections under unchanged policies, including those determining the taxes, the submitted data demonstrate how the increasing ageing costs show up in rising explicit debt.
While the corrective arm of the Pact primarily focuses on deficits and pays some attention to explicit debt, implicit pension liabilities are now addressed to the extent that the cost of switching towards a funded pension system allows for a temporary deviation from the 3% deficit ceiling, thereby facilitating a reduction in implicit pension liabilities. The international statistical community made progress in March 2007 in preparing the proposal for revising the treatment of pension entitlements in national accounts (see Advisory Expert Group on National Accounts (AEG), 2007; also European Commission, 2007, Part II, Section 2.3). It was agreed that the pension liabilities of private corporations will be shown on their balance sheet, as is already the case under International Financing Reporting Standards (IFRS) for (listed) companies. Due to the difficulties in defining pension liabilities under the government social insurance schemes, these will not be shown in the core accounts but new supplementary accounts will be established for this purpose. The concept to be used will be the accrued-to-reference date liability.
The pension entitlements of the government’s own employees form a special case as neutrality with respect to private sector employers should require recording it as government debt. This could add roughly 50-60% of GDP to the public debt figures in the European welfare states. However, pension entitlements of government employees may be closer to social insurance schemes and it is therefore foreseen that they would be shown in the supplementary accounts only. The more precise criteria where to draw the line will be set up later. It is admitted that there will be difficult border line cases and international comparisons will be hampered as fully harmonised treatment will not be found, simply because pension systems considerably differ from one country to another.
15
3.6. Intergenerational equity
While the revised SGP puts more emphasis on fiscal sustainability, it is important to realize that there are many potential sustainable fiscal paths with very different distributive and efficiency implications across generations. In fact, while under rather weak conditions on macroeconomic developments perfect adherence to the SGP would guarantee fiscal solvency, such a policy would only by coincidence ensure an optimal intergenerational distribution of the costs of population ageing (however this may be defined). It would also only by coincidence ensure efficiency through the minimization of the present discounted sum of the losses caused by the distortionary taxes and premium payments needed to finance the (ageing-related) public expenditures. Hence, even if the Pact is never violated, the intergenerational distribution of the ageing costs may be very unequal. For example, if governments choose to address the ageing costs by raising revenues only when increased expenditure materializes, then the current workers, especially the older ones, will benefit at the expense of the younger generations, who will have to bear the increasing financial burden. This burden would be shared more equitably if also benefits are reduced, the effective retirement age is raised and/or the increase in pension contributions is frontloaded.
Establishing the intergenerational distribution of the costs and benefits from pension and other age-dependent arrangements is a difficult matter, let alone what might be a “fair” distribution. A number of factors would reasonably need to be taken into account. First, how long is a cohort expected to receive pension benefits and medical treatment? If future cohorts are expected to live longer and they do not face a corresponding increase in their retirement age then it seems reasonable that they also face a higher contribution rate. Also, one might need to take account of differences in fertility. A generation that produces fewer children per adult should pay more for given benefits or receive less generous pensions (Sinn 2000). Account must also be taken of public investments that have been made or are being made by current workers and from which the future workers will also profit. A proper intergenerational contract would require future workers to make similar public investments or else make larger contributions into the pension system. Given these complex issues, it is not surprising that the Pact does not address the issues of efficiency and intergenerational distribution. These do not directly affect the functioning of the common monetary policy, while distributional issues are a matter of political preferences expressed and implemented at the national level – affecting the
16
fundamental principles of national social security is even explicitly excluded from the competence of the European Union (EU Treaty article 137). The problem is that young (those below the eligible voting age) and unborn generations are not naturally represented in the political processes. Hence, they have no vote in decisions affecting the future explicit and implicit debt burden, but they are still affected by these decisions. Indeed, given that those who have to shoulder part of burden cannot decide about its distribution, one can easily imagine a political-economy equilibrium in which the decision about a pension reform (for example, a reduction in benefits or a lengthening of working life) is postponed longer than would be socially optimal, thereby leading a country into a major crisis. This should show that incapacity to cope with intergenerational distribution related to the major public expenditure schemes could grossly breach the principle of sound public finances established in the EU Treaty. It has also certainly been addressed under the SGP, and to an increasing extent under its revision, as reduction of public debt has been called for to prepare for the future expenditure pressures. However, it is clear, as also admitted by the European Commission (2006, p. 21-22), that the SGP does not incorporate intergenerational equity explicitly and systematically. This is what we want to tackle below with the help of a simple model and numerical illustrations.
4. The intergenerational distribution of costs under alternative fiscal rules
Here we address explicitly the consequences, under population ageing, of different fiscal and pension arrangements for public deficits, public debt, implicit liabilities and the balance of contributions and benefits per cohort. The former two variables are of particular importance for assessing to what extent the arrangements comply with the SGP. The balance of contributions and benefits per cohort is the key for assessing the size of potential economic distortions and the intergenerational distribution of the ageing burden. We illustrate the consequences of a fall in fertility and a rise in life expectancy. An important question that we try to address is whether compliance with the SGP can be consistent with a balanced treatment of successive generations that we shall term
actuarial neutrality.
17
The model that underlies the illustration is presented in the Appendix. It is adapted from Oksanen (2005 and 2006). Here, we just describe its main features. For convenience, we use a partial equilibrium “overlapping-generations” model of total wage cost, pension contributions and public pensions. There are three generations: children, workers and retirees. Workers (or employers on their behalf) contribute to the pension system, while the retirees receive a public pension (and do not pay pension contributions or, for simplicity, other taxes). The pensions can be partly (or fully) financed out of current workers' contributions and they can be partly (or fully) financed out of the pension systems assets (which are consolidated with the assets – or debt – of the rest of the government). The extreme case in which current pensions are completely financed out of current workers’ contributions is, of course, the pure PAYG system. The other extreme in which they are fully financed out of the system’s assets corresponds to a fully funded system. The discounted pension benefits to be received by the current workers are termed the "implicit pension debt" (IPD – this corresponds to 'accrued-to-reference date liability' in a more general setting) of the public sector.
The consolidated public sector (government plus the pension system) owns (net) financial assets At in period t (public debt amounts to negative assets). Further, all taxes
are levied on the wage bill.12 The consolidated public sector budget constraint is
(1) c w Lt t t +(ρt −1)At−1 =πt−1w Rt t + At− At−1,
where ct is the tax rate, wt is the (gross) wage rate,13 Lt is the “effective” labour supply of
workers in period t, ρt is the financial market interest rate factor (the interest rate is ρt-1),
πt-1 is the pension accrual rate and Rt is the “effective” number of elderly. Here, Lt = %l Lt t,
where L%t is the number of new entrants to the labour force in period t, and lt is the
number of years spent in work in period t, divided by the number of years in work in period 0. Further, since periods refer to generations here, and as the number of years during which a pension benefit is received generally differs from the number of years that individuals pay contributions into the pension system, we define σt as the number of
years spent in retirement in period t divided by the number of years spent working in
12 For convenience, we label all primary revenues of the public sector as “taxes” even though in our
theoretical model they consist mostly of pension contributions. The reason is that primary revenues also include the taxes collected (from wages) to service the initial explicit debt of the government.
13 Here, and in the sequel, “wage” stands for “gross wage”, that is, the wage before pension contributions
18
period t-1, i.e. Rt = σt Lt-1. Finally,
ρ
t = +(1 gt)(1+µ
t), where1 1 1 t t t t t w L g w− L− + = is the
wage bill growth factor and µt>0 is an exogenous mark-up of the financial market
interest factor on the wage bill growth factor. Hence, µt is not influenced by the
demographic shocks that we consider below.14 The accrual rate as a share of the wage net of contributions, 1
n t
π
− , is set by policy. Based on 1n t
π
− , one then derives the appropriate accrual rate πt-1 as a share of the gross wage wt (for the details on the calculation, see theAppendix). Dividing by the total wage bill in period t, we can also rewrite (1) as: (2) ct = πt-1 (lt-1/lt)(σt/ft-1) + at – (1+µt) at-1,
where ft-1 is the fertility rate (hence, L%t = ft-1L%t−1) and at = At/(wtLt) are (net) assets as a
share of the wage bill.
Pure PAYG and constant debt ratio
The first rule (PAYG), which maintains the financial position of the public sector (i.e. assets as a share of the total wage bill are kept constant at a level a), implies the following tax rate (see the Appendix):
(3) ct = πt-1 (lt-1/lt)(σt/ft-1) – µt a.
Since assets are held constant at their initial level, we have a a= 0, where a0 are the
initial assets as a share of GDP. Hence, the total tax rate consists of a component that covers the pension outlays (the first term) and, hence, keeps the asset position of the pension system at zero, and a component that captures the debt-servicing cost, when public debt as a share of GDP (or the wage bill) is kept constant (the second term). In the case of positive public debt (a <0) this says that each generation has to pay the interest mark-up (above the growth of the wage bill) on the public debt. As for the budget balance, with positive wage growth, it is in surplus (deficit) if government net assets are positive (negative) (see the Appendix).15
14 Note that for setting up the accounting framework, the expression for the interest rate is merely an
identity; however, for the main results below we need to assume that µt is exogenous.
15 One could also look at many other alternative rules. One is that a given explicit debt/GDP ratio is
generated at some future point in time. The main problem with such a rule is that there are many different ways in which the future target debt/GDP ratio can be achieved. Suppose, for simplicity, that the future target ratio for, say, 2050 equals the current debt/GDP ratio and that society faces a problem of rising
19
Actuarial neutrality across generations
Next, we introduce the policy rule such that in each period, given any demographic shock or change in any policy parameter, the tax rate is set at a constant level that is financially sustainable as long as there is no new shock. If and when a new shock arrives, the same principle is applied. The implied tax rate is found as (see the Appendix):
(4)
(
)
(
)
(
)
1 1 1 1 1 1 1 1 1 / 1 , 1 1 1 t t t t t t t t t a t t t t t t t t t t t t t t t l l c a f f π σ µ π σ µ µ µ µ − − − + + − + − + + = − + + + + where a superscript t indicates that the variable is based on the shock in period t. For example, t
t
µ denotes the interest mark-up in period t based on all information available in period t, while t1
t
µ+ denotes the expected interest mark-up in period t+1 based on all information available in period t. We define θ as the implicit pension debt (IPD) as a share of the total wage bill. Hence,
(
)
(
)
1 1 1 1 1 1 1 1 1 1 1 1 1 / / , 1 t t t t t t t t t t t t t t t t t t t t t t t t t t l l IPD w R w L w L f π σ π ρ θ µ − − − − − − − − − − − − − = = = + and(
)
1 1 1 1 1 / . 1 t t t t t t t t t t t t t t t t t t t t t t IPD w R w L w L f π ρ π σ θ µ + + + + + = = = +Hence, θt-1 is corrected for the possible change in the retirement age in period t (for a
detailed explanation, see the Appendix). Using these expressions, we can reduce (4) to:
(4’) 1
(
1 1)
1 1 . 1 t a t t t t t t t t t t t c µ µ θ a θ µ + − − + + = − + + ageing costs. One extreme way to reach the target debt ratio is to leave pension benefits unchanged and raise the pension contribution rate (it could jump to a higher level now and then stay constant, or it could gradually rise, etc.). Another extreme path would leave contribution rates at their current levels and reduce the pension replacement rate. Again, the reduction could be once and for all after which no further reduction follows, or the replacement rate could gradually fall (but at the end to a lower level than under an abrupt reduction). All these paths may imply very different distributions of the ageing costs. Under a once and for all increase in the contribution rate, it is the current workers that start to contribute more, leaving current retirees unaffected. With a once and for all reduction in the replacement rate, current retirees share in the burden of rising ageing costs.
20
The rule here is termed "actuarial neutrality" as each generation of workers, first, contributes to share the burden stemming from the past decisions on pensions and other expenditures and revenues by paying the interest mark-up on the sum of the implicit pension liabilities and the explicit public debt, and, secondly, pays the full present value of its own future pensions.
Further, under this rule the sum of explicit public debt (-a) and implicit liabilities as a share of the wage bill, labelled the “total debt ratio”, evolves as follows:
(5)
(
1 1)
1 1 . 1 t t t t t t t t t t a µ a θ θ µ − − + + − = − +This equation thus implies that the total debt ratio remains constant as long as t t1 t t
µ =µ+ . In the more general case in which t
t
µ may differ from t1 t
µ+ , the total debt in the previous period has to be re-valued by the factor
(
1 t) (
/ 1 t1)
t t
µ µ+
+ + . If implicit liabilities increase, i.e. t t1 0
t t
θ θ− − > , for example due to longer time in retirement, pension contributions should increase, thereby leading to an offsetting reduction in the public debt. This contributes a positive component to the public sector budget surplus.
The expression for a t
c given above is a general expression for the tax rate under actuarial
neutrality. It is valid for any subsequent changes, permanent or temporary, in the demography, retirement age, generosity of pensions and interest rate margin t
t
µ . Under this rule the balance of pension contributions and benefits of each generation is fully separated from the characteristics and pension policy choices of other generations starting from the point in time when the actuarial neutrality rule was first implemented. This result is quite robust as it allows, for example, any changes in t
t
µ as long as they do not depend on the other factors in the formula. To assess the plausibility of this assumption, note that under elementary growth theory the interest rate should depend on demographic factors and the pension system rules. In the model here this is the case: for given t
t
µ and t1 t
µ+ , the interest rate goes down with the fall in fertility. Combined with the actuarial neutrality rule that affects government saving in the economy, this may be a plausible approximation of the functioning of the economy.
Note furthermore that our result on the dynamics of the total debt ratio (including the considerations related to t
t
21
initially fully funded it remains so under the actuarial neutrality rule. The rule here is applicable under any initial degree of funding. The degree of funding then evolves as a function of factors in the formula for a
t
c . 4.2 The calibration
Our numerical example is largely based on the following stylized calibration taken from Oksanen (2005). The unit period corresponds to 30 years, which is roughly the average child bearing age of women in Europe. It is also roughly the average age difference between a retired person (70) and a worker (40). Throughout, we assume that the annual growth rate of the nominal wage per worker is 3.28%, which stems from a unit real wage growth rate of 1.75% and an inflation rate of 1.5% per annum. The interest rate mark-up over the growth of the total wage bill equals 1.5 percentage points per annum.
The economy starts in period 0 in a steady state in which the number of years at work equals 40 and those in retirement are 18 (hence, σt = 0.45). These numbers are thus used
to scale pension contributions and pensions to correspond to realistic numbers, although the formal model works with the 30-year unit period. Also, initially, fertility preserves a constant population, that is, the number of children in a period equals the number of workers. Further, the unit pension is initially set at 55% of the wage after pension contributions (i.e., 1
n t
π
− = 0.55), so as to make the initial numbers comparable with those for 2004 in the EPC projections.In period 1, there is both a 20% fall in fertility (roughly corresponding to a fall from 2.1 children per woman, which is needed to preserve the population, to 1.7 children per woman, which is close to the current average fertility in Europe) and an increase in longevity by three years (this corresponds to one year for each 10 year period). In period 2 there is a further increase in longevity by three years. This way we match quite closely the assumptions on the increase in longevity in the EPC projections for the EU average (an increase in life expectancy (at birth) for males of 6.3 years and for females of 5.1 years between 2004 and 2050).
4.3 The numerical results
We show the time paths of the most relevant variables under pure PAYG and various policies under actuarial neutrality. We consider two possible policy measures to deal with the rising ageing burden: an increase in the retirement age and a reduction of the
22
replacement rate; the tax rate is then determined by these factors and the type of policy rule implemented. For the case of actuarial neutrality we also consider a (partial) privatisation of the public pension pillar, where the latter is partly replaced by a mandatory, funded private pillar. Most numbers are expressed in percentages of GDP, assuming that the total wage bill (including pension contributions) is 60% of GDP. Table 2 displays the time paths of the tax rate and pension expenditures, the public debt, the implicit pension debt (IPD), the total debt and the budget surplus (all as shares of GDP) under the PAYG rule. A negative value for the budget surplus/GDP ratio thus indicates a public deficit. Throughout, the debt and the budget surplus are expressed as ratios of annual GDP. The Appendix describes a procedure to transform thirty-year figures for these variables into annual figures. In the baseline case no policy changes are undertaken, while in the next case the retirement age increases “moderately” so that the working life in period 1 rises to 41 years and in period 2 to 42 years (i.e. it rises by one-third of the increase in life expectancy); under the “large” retirement increase the respectively numbers are 41.5 and 43 years (i.e. the retirement age increases by half of the increase in life expectancy). Further, we also consider a reduction in the pension accrual rate 1
n t
π
− as a share of the wage net of pension contributions from 55% to 48%. In Table 3 we report the corresponding cases under actuarial neutrality. In Tables 4 and 5 we also illustrate a partial or full privatisation of the public pension system under actuarial neutrality. A new steady state is always achieved in period 3; the period 4 numbers are merely reported to confirm this. Budget balances and public debt levels that violate the Stability and Growth pact are indicated with bold characters.Panel 1 of Table 2 shows the results for the baseline PAYG scenario. The reduction in fertility and the two-step rise in longevity produce an increase in pension expenditure from an initial level of 11.9% of GDP to a new steady state level of 17.5% of GDP. Taxes, the bulk of which consist of pension contributions, as a share of the total wage cost (“wage” for short) rise from 21.7% in the beginning to 31.1% in the new steady state. This substantial increase in the tax rate is caused by the failure to take additional measures to contain the ageing costs. Given that the generosity of the pension benefits is untouched, the implicit pension debt rises as a share of GDP. The rise is produced both by the rise in the pension benefit as a share of the gross wage (due to the additional years in retirement) and the fall in fertility. Permanently lower fertility means that the relative IPD increases because the growth of the wage bill is permanently reduced, implying that
23
a given amount of future pension outlays is discounted at the lower rate. Naturally, an increase in the retirement age alleviates the rise in pension expenditures and the tax rate. In period 1 the tax rate falls because the contribution period has increased while the rise in longevity has not yet materialized (because it concerns those working in period 1 and thus the longevity rise materializes in period 2). Panels 2-3 of Table 2 show the results for moderate and large increases in working life, respectively. Panels 4 – 6 correspond to panels 1 – 3, respectively, assuming that the target net replacement rate set in period 1 and onwards is 48% instead of 55%. Obviously, as next period’s pension outlays fall, the implicit pension debt is lower under the lower net replacement rate. The budget surplus is practically unaffected in all these cases. Projected pension expenditure in Panel 5 roughly corresponds to the EPC projection for EU-15.
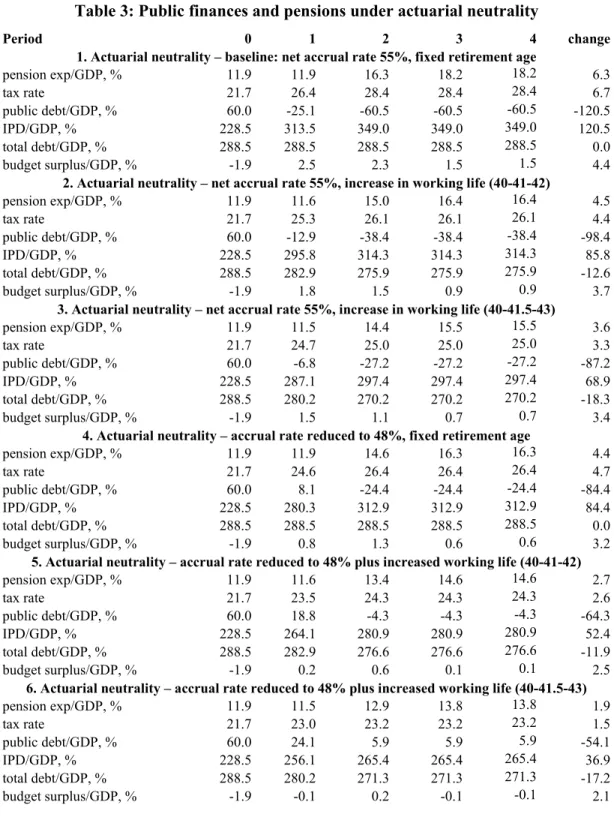
Table 3 illustrates actuarial neutrality as an alternative policy rule. The baseline assumes no change in the generosity of the benefits or in the retirement age. Both pension expenditures as a share of GDP and the tax rate rise in line with the fall in fertility and the rise in life expectancy. However, now the system moves to partial funding. This is achieved by increasing the contributions already in period 1. The rise in the implicit debt ratio induces an equivalent reduction in the public debt ratio (or increase in the public asset ratio), which naturally happens only when the deficit ratio is reduced. Actually, the public budget turns into a surplus from period 1 and onwards in panels 1-3. The surplus is largest in period 1 when the demography is hit by two shocks simultaneously (the rise in workers’ life expectancy and the fall in the fertility rate). An increase in the retirement age (panels 2 and 3) reduces the pensions (as a share of the gross wage), thereby lowering the implicit pension debt. This implies that fewer public assets need to be accumulated and, hence, the public sector runs a smaller surplus than under the baseline. Also, a reduction in the accrual rate (panel 4) produces a smaller implicit debt/GDP ratio, thereby requiring smaller surpluses than under the baseline. This effect is further strengthened when the reduction in the accrual rate is combined with the increase in the retirement age (panels 5 and 6).
Panel 5 in Table 3 roughly corresponds to the EPC projection for the EU. The expenditure increase is 2.7%-points of GDP (that is a little higher than in the corresponding pure PAYG scenario because now the 48% net accrual rate leads to somewhat higher pensions made possible by the fall in the tax rate owing to the virtual elimination of the 60% of GDP public debt).
24
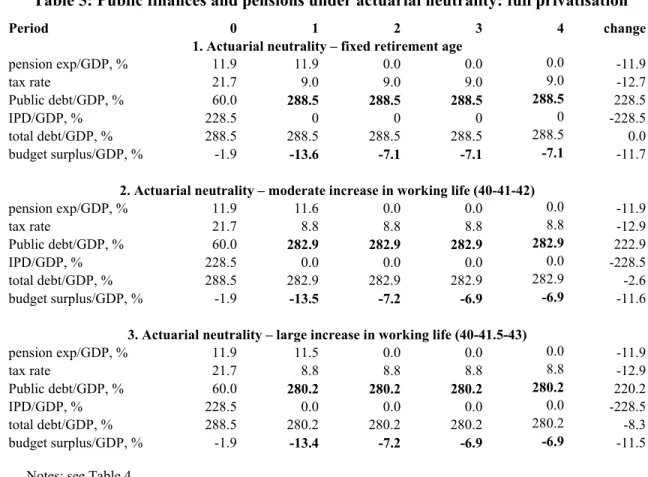
All actuarially neutral scenarios spell out clearly that as long as the demographic change is permanent, the outcome should also be a permanent change in government financial position. Therefore, a strategy in which public assets are depleted when the ageing process has reached its peak is excluded, unless pension accrual is drastically reduced. Table 4 considers the latter option induced by a partial privatisation (possibly in combination with other measures) in which implicit pension debt is swapped for (explicit) public debt. The partial privatisation is implemented with a one-third reduction in the accrual rate expressed as a share of the gross wage rate. Obviously, compared to the baseline under actuarial neutrality, the partial privatisation leads to a reduction in public pension expenditure as a share of GDP and a lower tax rate as a share of the gross wage. Comparing period 0 with the new steady state, the debt/GDP ratio falls only slightly (panel 1), because the original reduction in this ratio is almost entirely offset by the worsening of the debt/GDP ratio caused by the partial privatisation. We observe that the public debt ratio in period 1 exceeds the 60% limit of the SGP, while the deficit ratio in that period remains just marginally below the 3% limit. Obviously, because a rise in the retirement age lowers the implicit debt ratio, the combination of such a rise with a partial privatisation produces higher public debt and deficit ratios than a partial privatisation alone as a larger share of implicit debt becomes explicit. The deficit ratio now violates the SGP in period 1 (see panels 2 and 3) and so does the debt ratio from period 1 onwards. Adding to this a reduction in the accrual rate leads to a further swap of debt, hence to a worsening of the budgetary figures (see panels 4-6).
25
Table 2: Public finances and pensions under PAYG
Period 0 1 2 3 4 change
1. PAYG – baseline: net accrual rate 55%, fixed retirement age
pension exp/GDP, % 11.9 11.9 15.9 17.5 17.5 5.6 tax rate 21.7 21.7 28.4 31.1 31.1 9.4 public debt/GDP, % 60.0 60.0 60.0 60.0 60.0 0.0 IPD/GDP, % 228.5 305.4 336.3 336.3 336.3 107.8 total debt/GDP, % 288.5 365.4 396.3 396.3 396.3 107.8 budget surplus/GDP, % -1.9 -1.9 -1.5 -1.5 -1.5 0.4
2. PAYG – net accrual rate 55%, moderate increase in working life (40-41-42)
pension exp/GDP, % 11.9 11.7 14.8 15.9 15.9 4.0 tax rate 21.7 21.3 26.5 28.4 28.4 6.7 public debt/GDP, % 60.0 60.0 60.0 60.0 60.0 0.0 IPD/GDP, % 228.5 284.0 304.9 304.9 304.9 76.4 total debt/GDP, % 288.5 344.0 364.9 364.9 364.9 76.4 budget surplus/GDP, % -1.9 -2.0 -1.5 -1.5 -1.5 0.4
3. PAYG – net accrual rate 55%, large increase in working life (40-41.5-43)
pension exp/GDP, % 11.9 11.6 14.3 15.1 15.1 3.2 tax rate 21.7 21.1 25.6 27.0 27.0 5.3 public debt/GDP, % 60.0 60.0 60.0 60.0 60.0 0.0 IPD/GDP, % 228.5 273.7 289.5 289.5 289.5 61.0 total debt/GDP, % 288.5 333.7 349.5 349.5 349.5 61.0 budget surplus/GDP, % -1.9 -2.0 -1.5 -1.5 -1.5 0.4
4. PAYG – target net replacement rate 48%; fixed retirement age
pension exp/GDP, % 11.9 11.9 14.4 15.9 15.9 4.0 tax rate 21.7 21.7 25.8 28.3 28.3 6.6 public debt/GDP, % 60.0 60.0 60.0 60.0 60.0 0.0 IPD/GDP, % 228.5 275.9 304.8 304.8 304.8 76.3 total debt/GDP, % 288.5 335.9 364.8 364.8 364.8 76.3 budget surplus/GDP, % -1.9 -1.9 -1.5 -1.5 -1.5 0.4
5. PAYG – target net replacement rate 48%; moderate increase in working life (40-41-42)
pension exp/GDP, % 11.9 11.7 13.3 14.3 14.3 2.4 tax rate 21.7 21.3 24.1 25.8 25.8 4.1 public debt/GDP, % 60.0 60.0 60.0 60.0 60.0 0.0 IPD/GDP, % 228.5 255.9 275.4 275.4 275.4 46.9 total debt/GDP, % 288.5 315.9 335.4 335.4 335.4 46.9 budget surplus/GDP, % -1.9 -2.0 -1.5 -1.5 -1.5 0.4
6. PAYG – target net replacement rate 48%; large increase in working life (40-41.5-43)
pension exp/GDP, % 11.9 11.6 12.8 13.6 13.6 1.7 tax rate 21.7 21.1 23.3 24.5 24.5 2.8 public debt/GDP, % 60.0 60.0 60.0 60.0 60.0 0.0 IPD/GDP, % 228.5 246.3 261.0 261.0 261.0 32.5 total debt/GDP, % 288.5 306.3 321.0 321.0 321.0 32.5 budget surplus/GDP, % -1.9 -2.0 -1.5 -1.5 -1.5 0.4
Notes: (1) The tax rate consists mainly of pension contributions and is expressed as % of the total wage cost. (2) The final column “change” gives the percentage point change from period 0 to the new steady state, except for the budget surplus/GDP ratio, where it gives the percentage point change from period 0 to the peak.
26
Table 3: Public finances and pensions under actuarial neutrality
Period 0 1 2 3 4 change
1. Actuarial neutrality – baseline: net accrual rate 55%, fixed retirement age
pension exp/GDP, % 11.9 11.9 16.3 18.2 18.2 6.3 tax rate 21.7 26.4 28.4 28.4 28.4 6.7 public debt/GDP, % 60.0 -25.1 -60.5 -60.5 -60.5 -120.5 IPD/GDP, % 228.5 313.5 349.0 349.0 349.0 120.5 total debt/GDP, % 288.5 288.5 288.5 288.5 288.5 0.0 budget surplus/GDP, % -1.9 2.5 2.3 1.5 1.5 4.4
2. Actuarial neutrality – net accrual rate 55%, increase in working life (40-41-42)
pension exp/GDP, % 11.9 11.6 15.0 16.4 16.4 4.5 tax rate 21.7 25.3 26.1 26.1 26.1 4.4 public debt/GDP, % 60.0 -12.9 -38.4 -38.4 -38.4 -98.4 IPD/GDP, % 228.5 295.8 314.3 314.3 314.3 85.8 total debt/GDP, % 288.5 282.9 275.9 275.9 275.9 -12.6 budget surplus/GDP, % -1.9 1.8 1.5 0.9 0.9 3.7
3. Actuarial neutrality – net accrual rate 55%, increase in working life (40-41.5-43)
pension exp/GDP, % 11.9 11.5 14.4 15.5 15.5 3.6 tax rate 21.7 24.7 25.0 25.0 25.0 3.3 public debt/GDP, % 60.0 -6.8 -27.2 -27.2 -27.2 -87.2 IPD/GDP, % 228.5 287.1 297.4 297.4 297.4 68.9 total debt/GDP, % 288.5 280.2 270.2 270.2 270.2 -18.3 budget surplus/GDP, % -1.9 1.5 1.1 0.7 0.7 3.4
4. Actuarial neutrality – accrual rate reduced to 48%, fixed retirement age
pension exp/GDP, % 11.9 11.9 14.6 16.3 16.3 4.4 tax rate 21.7 24.6 26.4 26.4 26.4 4.7 public debt/GDP, % 60.0 8.1 -24.4 -24.4 -24.4 -84.4 IPD/GDP, % 228.5 280.3 312.9 312.9 312.9 84.4 total debt/GDP, % 288.5 288.5 288.5 288.5 288.5 0.0 budget surplus/GDP, % -1.9 0.8 1.3 0.6 0.6 3.2
5. Actuarial neutrality – accrual rate reduced to 48% plus increased working life (40-41-42)
pension exp/GDP, % 11.9 11.6 13.4 14.6 14.6 2.7 tax rate 21.7 23.5 24.3 24.3 24.3 2.6 public debt/GDP, % 60.0 18.8 -4.3 -4.3 -4.3 -64.3 IPD/GDP, % 228.5 264.1 280.9 280.9 280.9 52.4 total debt/GDP, % 288.5 282.9 276.6 276.6 276.6 -11.9 budget surplus/GDP, % -1.9 0.2 0.6 0.1 0.1 2.5
6. Actuarial neutrality – accrual rate reduced to 48% plus increased working life (40-41.5-43)
pension exp/GDP, % 11.9 11.5 12.9 13.8 13.8 1.9 tax rate 21.7 23.0 23.2 23.2 23.2 1.5 public debt/GDP, % 60.0 24.1 5.9 5.9 5.9 -54.1 IPD/GDP, % 228.5 256.1 265.4 265.4 265.4 36.9 total debt/GDP, % 288.5 280.2 271.3 271.3 271.3 -17.2 budget surplus/GDP, % -1.9 -0.1 0.2 -0.1 -0.1 2.1