Whole genome expression profiling of the medial and lateral substantia
nigra in Parkinson's disease
L. B. Moran1, D. C. Duke1, M. Deprez2, D. T. Dexter3, R. K. B. Pearce1, M. B. Graeber1
1University Department of Neuropathology, Division of Neuroscience and Mental Health, Imperial College London and Hammersmith Hospitals Trust. Charing Cross campus, Fulham Palace Road, London W6 8RF, UK
2Laboratory of Neuropathology, University Hospital, University of Liège, Liège, Belgium
3Department of Cellular and Molecular Neuroscience, Division of Neuroscience and Mental Health, Imperial College London, London, UK
Abstract
We have used brain tissue from clinically well-documented and neuropathologically confirmed cases of sporadic Parkinson's disease to establish the transcriptomic expression profile of the medial and lateral substantia nigra. In addition, the superior frontal cortex was analyzed in a subset of the same cases. DNA oligonucleotide
microarrays were employed, which provide whole human genome coverage. A total of 570 genes were found to be differentially regulated at a high level of significance. A large number of differentially regulated expressed sequence tags were also identified. Levels of mRNA sequences encoded by genes of key interest were validated by means of quantitative realtime polymerase chain reaction (PCR). Comparing three different normalization procedures, results based on the recently published GeneChip Robust Multi Array algorithm were found to be the most accurate predictor of realtime PCR results. Several new candidate genes which map to PARK loci are reported. In addition, the DNAJ family of chaperones is discussed in the context of Parkinson's disease pathogenesis.
Keywords : GC-RMA algorithm ; Microarrays ; Neurodegeneration ; Pathway definition ; Transcriptome
signature
Introduction
Parkinson's disease [PD; Online Mendelian Inheritance in Man (OMIM) 168600] is the second most common neurodegenerative disorder after Alzheimer's disease. Due to demographic ageing [World Health Organization (WHO) Health Report 1998], the incidence of this devastating neurological disorder is expected to increase severalfold over the next decades. A number of mutations have been described which cause rare familial forms of the disease [1-10], but the vast majority (>85%) of all PD cases are considered sporadic. In the latter "idiopathic" form of PD both genetic and environmental factors are expected to contribute to disease
development in keeping with the concept of PD being a complex genetic disorder. Current thinking about the pathogenesis of PD is increasingly focused on disease-causing pathways, some of which have been identified in connection with the rare familial forms of PD. These include the ubiquitin-proteasome system, the mitochondrial respiratory chain and, notably, the alpha-synuclein pathway and its associated genes. We are establishing a comprehensive molecular pathological database of sporadic PD to provide a basis for studies into these and other functionally related "PD pathways".
We have studied a clinically well-documented and neuropathologically confirmed cohort of idiopathic PD cases. All cases showed alpha-synuclein immunopathology. Two cases showed additional Alzheimer's disease
pathology (an expected frequency), one developed dementia, allowing a diagnosis of Parkinson's disease with dementia (PDD) and one could be classified as dementia with Lewy bodies (DLB) based on clinical course and alpha-synuclein pathology.
The international neuropathological consensus definition of sporadic PD includes an assessment of alpha-synuclein status of the whole brain (http://www.ICDNS.org). However, the human substantia nigra (SN) still represents a key anatomical region of interest in PD because this is the brain area which exhibits extensive and most consistent tissue damage in the disease. Here, characteristic degeneration of dopaminergic nerve cells is easy to recognise. In addition, remaining nerve cells typically show Lewy bodies. Once more than half of the
existing nerve cell population has died, parkinsonism manifests itself clinically. It is well known that the lateral SN shows the most pronounced degeneration [11 ].
We have determined the whole genome expression profile (complete transcriptome) of the adult SN in 15 PD brain donors, in seven controls (brain donors without neurological disease) and in one disease-specific control (a neuropathologically confirmed case of multiple sclerosis) with histologically intact nigra. In addition, we have compared the expression profile of the lateral and medial SN to the frontal cerebral cortex in a subset of the same cases.
Materials and methods
Case material
The human brain tissue for this study was obtained from the UK Parkinson's Disease Society Tissue Bank at Imperial College London and from the Laboratory of Neuropathology of the University of Liège. In addition, one disease-specific control was obtained from the UK Multiple Sclerosis Society Tissue Bank at Imperial College London. The basic clinical and neuropathological characteristics of the cases used in the study are shown in Table 1. A detailed description of the clinical and histological findings in each case will be provided elsewhere (Moran et al., in preparation). In total, 47 individual tissue samples were analyzed, i.e. 15 samples of medial parkinsonian SN, nine samples of lateral parkinsonian SN, eight medial nigra control samples and seven lateral nigra control samples. Lateral and medial nigra samples were from the same cases. In addition, the frontal cerebral cortex was analyzed in five of the PD cases and in three of the controls.
RNA extraction
Total RNA was extracted from freshly dissected brain tissue, snap-frozen and kept at -70°C until further use. For nucleic acid extraction, the RNeasy Mini Kit (Qiagen, Valencia, CA, USA) was used according to the
manufacturer's protocols (http://www.qiagen.com). Tissue samples were mechanically disrupted using a rotary homogenizer, lysed in buffer containing guanidine isothiocyanate (GITC) and then further homogenized (shredder tubes, Qiagen). The resulting homogenate was passed through the RNeasy mini column containing the RNeasy silica gel membrane that selectively binds RNA. Total RNA was resuspended in RNAse-free water (http://www.eppendorf.com). RNA yields were determined using a spectrophotometer (GeneQuantPro), and the quality was assessed using agarose gel electrophoresis. RNA samples were stored at -80°C.
Preparation of target cRNA for microarrays
Target cRNA for microarray analysis was prepared following the manufacturer's protocol
(http://www.affymetrix.com) and, essentially, as described previously [12]. In brief, total RNA was used for cDNA synthesis employing the Super-Script double-stranded cDNA synthesis kit (Superscript Choice System, Life Technologies, Gaithersburg, MD) with the T7-(dT)24 primer. In vitro transcription was performed using the
Enzo-IVT kit (Enzo BioArray High Yield RNA Transcript Labelling Kit, Enzo Diagnostics, Farmingdale, New York, USA). The resulting biotin-labelled cRNA was purified employing the RNeasy Mini Kit and then fragmented in buffer (40 mM Tris-acetate pH 8.1, 100 mM KOAc, and 30 mM MgOAc) at 95°C for 35 min. A quality check using Affymetrix Test3 arrays was carried out, and the fragmented biotinylated cRNA was then hybridized to Affymetrix Human Genome U133A and U133B gene chips (Affymetrix, Santa Clara, CA, USA). This array set contained 44,760 unique human probe sets representing more than 39,000 transcripts and approximately 6,000 expressed sequence tags (ESTs). The arrays were labelled with streptavidin-phycoerythrin and then washed before scanning in a Gene Array scanner (Affymetrix).
Microarray data analysis
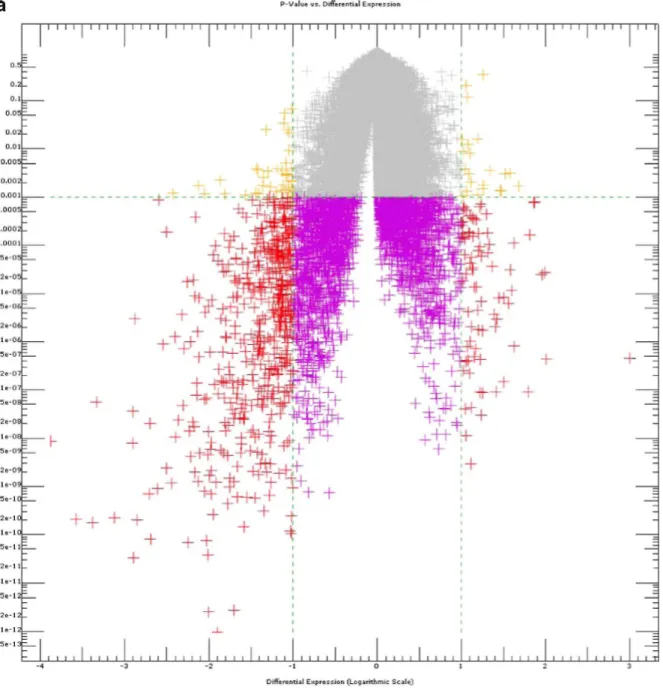
Analysis output (CHP) files were generated using Affymetrix Microarray Suite 5.0 software (MAS5.0). The 94 microarrays employed in this study were scaled to the same target intensity. CHP and cell intensity (CEL) files of the microarrays were read using ArrayAssist software (versions 3.0 and 3.2, respectively; Stratagene Interaction Explorer; http://www.stratagene.com). Aggregate intensity values were derived applying the GeneChip Robust Multi Array (GC-RMA) algorithm [13] and the Probe Logarithmic Intensity Error (PLIER; http://www.affymetrix.com), respectively. Transcripts were defined as statistically significant (two-class unpaired significance analysis with unequal variance) when they met the criteria of (a) p<0.001 and (b) an
absolute difference in expression of 1.0 log unit (log with base 2) (Fig. 1a). For comparative purposes, significance analysis was carried out with or without error stabilization (variance inflation which increases precision of the analysis for very low expression values) and p value correction for multiple testing [Bonferroni or Hochberg false-discovery rate (FDR)], respectively, p values corrected according to the Benjamini-Hochberg method are given in the following text (no error stabilization/variance inflation) except where
explicitly indicated.
Table 1 Clinical and neuropathological characteristics of cases
Case number Gender Age at
death (years) Duration of illness (years) Brain weight (g) Tissue pHa Postmortem delay (h) HU_133 A and B array SN medial HU_133 A and B array SN lateral Parkinson's disease 1 F 87 12 975 6.7 - Yesb Yes 2 M 83 9 1,182 6.5 - Yes Yes 3c M 68 3 1,422 6.6 15.0 Yesb Yes 4 M 78 10 1,560 6.5 21.7 Yes Yes 5 F 86 15 1,299 6.4 5.5 Yes Yes 6 F 81 14 1,330 6.4 17.5 Yes Yes 7 F 85 18 1,286 6.2 13.5 Yes Yes 8 M 75 34 1,351 6.1 1.3 Yes ND 9 M 76 27 1,282 6.0 17.0 Yes ND 10 F 76 10 1,144 6.2 13.5 Yes Yes 11 M 82 18 1,251 6.2 13.5 Yes Yes 12 M 76 7 1,313 6.3 15.0 Yesb ND 13 M 89 3 1,400 6.0 16.0 Yes ND 14c F 84 11 1,089 6.1 15 Yesb ND 15 M 76 10 1,291 6.7 9.7 Yesb ND Mean±SD 80±5.7 13.4±8.3 1,278±142 6.3±0.23 13.4±5.2 - - Range (68-89) (3-34) (975-1,560) (6.0-6.7) (1.3-21.7) - - Ratio M to F 9:6 - - - - Controls 16 M 76 NA 1,456 6.8 - Yes Yes 17 M 77 NA l,484d 6.7 4 Yesb Yes 18 M 81 NA 1,410 6.8 30 Yesb ND 19 M 71 NA 1,430 6.3 4 Yes Yes 20 F 77 NA 1,052 6.0 9 Yes Yes 21e F 80 NA 1,029 6.0 13.0 Yes Yes 22 M 46 NA 1,160 6.6 NA Yes Yes 23 M 57 NA 1,458 6.0 5.0 Yesb Yes Mean±SD 70.6±12.5 NA 1,309±194 6.4±0.37 10.8±10.0 Range (46-81) NA (1,029-1,484) (6.0-6.8) (4-30) Ratio M to F 6:2 - - - -
F Female, M male, NA not applicable, ND not determined, - information not available
a
Both tissue pH and pH of cerebrospinal fluid (CSF) were determined bCerebral cortex was analyzed incases 1, 3, 12, 14, 15, 17, 18 and 23 cNeuropathological changes consistent with Alzheimer's disease dFixed brain weight
eDisease control case
Real-time PCR assay
DNase-treated RNA was reverse-transcribed with random decamers using a RetroScript kit (Ambion;
http://www. ambion.com) following the manufacturer's protocol and then stored at -20°C. Two internal controls were selected based on their consistent expression in normal human brain tissue [14] and as also confirmed in our set of cases: beclin 1 [coiled-coil, myosin-like BCL2-interacting protein (BECN1)] and glutaminyl-tRNA synthetase (QARS). Primers for the above control sequences and alpha-synuclein (SNCA), orphan nuclear receptor (NR4A2 or Nurr1), mitochondrial complex I subunit (NDUFA9) and ubiquitin carboxyl-terminal esterase L1 (UCHL1) were designed using MacVector 7.0 software (Accelrys, Cambridge, UK) and synthesised by Sigma Genosys, Haverhill, UK (http://www.sigma-genosys. com). Primer sequences are shown in Table 2.
Where possible, primers were designed to span intron sequences to detect any genomic contamination. Real-time PCR was performed using Sybr Green I Mastermix (Applied Biosystems, Foster City, CA, USA; http://appliedbiosystems.com) using an ABI PRISM 7700 Sequence Detection System. Each reaction was run in triplicate and contained 1 µl of cDNA template along with 300 nM primer in a final reaction volume of 25 µl. Cycling parameters were 95°C for 10 min, 40 cycles at 95°C for 15 s, 60°C (annealing and extension) for 1 min, with a final extension step at 78-84°C for 20 s. Melting curves were determined using Dissociation Curves 1.0 software (Applied Biosystems). In addition, samples were run on a 3% agarose gel to control for amplification product specificity.
Real-time PCR data were processed using SDS 1.7 software (Applied Biosystems). Data were exported from SDS 1.7, and a normalization factor was calculated, derived from the geometric mean of the internal control genes [15]. Fold differences (relative expression) in PD samples compared to controls were determined using Data Analysis software for Real-Time PCR (DART-PCR Version 1.0) [16].
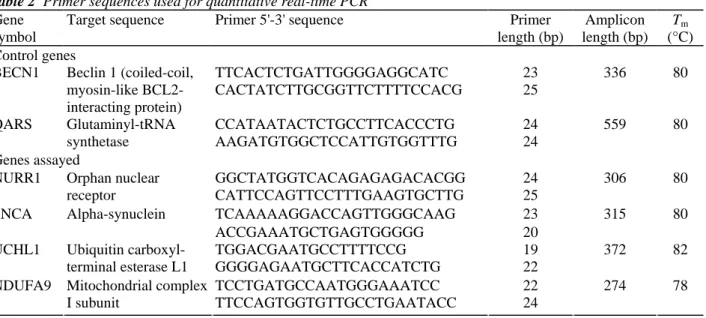
Table 2 Primer sequences used for quantitative real-time PCR Gene
symbol
Target sequence Primer 5'-3' sequence Primer
length (bp) Amplicon length (bp) Tm (°C) Control genes
BECN1 Beclin 1 (coiled-coil, TTCACTCTGATTGGGGAGGCATC 23 336 80
myosin-like BCL2-interacting protein)
CACTATCTTGCGGTTCTTTTCCACG 25
QARS Glutaminyl-tRNA CCATAATACTCTGCCTTCACCCTG 24 559 80
synthetase AAGATGTGGCTCCATTGTGGTTTG 24
Genes assayed
NURR1 Orphan nuclear GGCTATGGTCACAGAGAGACACGG 24 306 80
receptor CATTCCAGTTCCTTTGAAGTGCTTG 25
SNCA Alpha-synuclein TCAAAAAGGACCAGTTGGGCAAG 23 315 80
ACCGAAATGCTGAGTGGGGG 20
UCHL1 Ubiquitin carboxyl- TGGACGAATGCCTTTTCCG 19 372 82
terminal esterase L1 GGGGAGAATGCTTCACCATCTG 22
NDUFA9 Mitochondrial complex TCCTGATGCCAATGGGAAATCC 22 274 78
I subunit TTCCAGTGGTGTTGCCTGAATACC 24
Tm Melting temperature
Results
We have found that on average, 15,600 (35%) of all genes in the SN received present calls. The difference between PD nigra and control appeared to be predominantly quantitative rather than qualitative, with more than 85% of all genes being shared. A direct comparison of the different normalization procedures (Fig. 1b) revealed very significant differences in the number of identified differentially regulated genes at low significance levels. Results obtained with the three different algorithms were more comparable at p<0.001, although not all priority genes detected using the different algorithms were identical. This demonstrates the need to assess the quality of microarray algorithms through external validation (Fig. 1c).
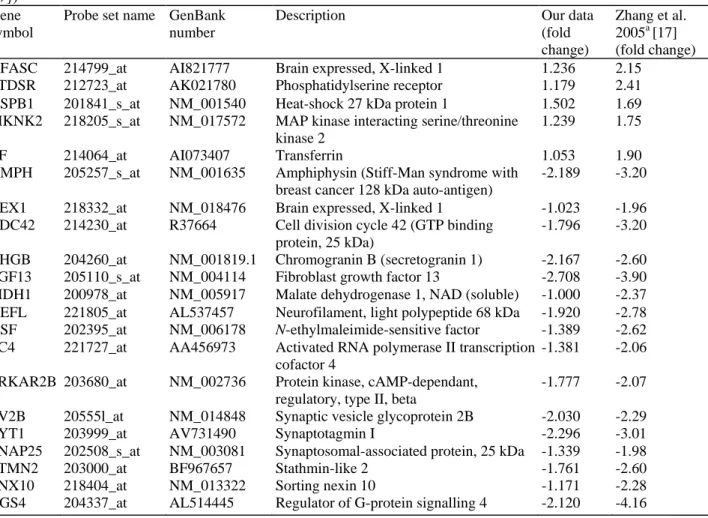
Validation of microarray-based results was achieved using quantitative real-time polymerase chain reaction (qRT-PCR) analysis. Samples from the original RNA extraction used for running the gene chips and additional RNA from independant extractions of the same brain tissue blocks were used, and a close match was observed, with excellent preservation of the original trend (Fig. 1c). The overall best match was observed for the GC-RMA algorithm. This was in keeping with recently published studies [13]. We therefore decided to use the GC-RMA algorithm as the "gold standard" for our analysis. Further validation of the results obtained in this study came from another microarray project [17]. We compared a list of genes (Table 3) for consistency of expression, up- or down-regulation of the genes under study and preservation of expression trends within each group and found a perfect match of trend for every single probe checked (r= 0.864, Spearman). Accordingly, the list of genes shown in Table 3 can be considered as confirmed PD-associated sequences or a first PD expression signature. Supplemental Figure 1 shows the pathway relationships of these genes (PathwayAssist programme).
Fig. 1 a Volcano plot of differentially expressed genes in substantia nigra. The x axis shows differential expression (DE; logarithmic scale), the y axis indicates the respective p value of each sequence. The sequences coloured in red show a differential expression greater or smaller than one (logarithm with base 2, i.e. one log unit representing a 100% difference) and p values smaller than 0.001. There are 570 probe sets fulfilling these criteria. b Comparison of the number of "significant genes" as detected by GC-RMA-, PLIER- and MAS5.0-based analysis procedures. At p<0.05 (no variance inflation, no Bonferroni or Benjamini-Hochberg FDR correction) the PLIER algorithm which takes into account Affymetrix proprietary information on probe behaviour stands out by producing a very large number of significantly regulated genes. The number of significantly regulated genes as detected by the different algorithms compares rather well at
p<0.001. This very stringent threshold leaves 570 significantly regulated genes according to the GC-RMA procedure (Fig. 2). For p values
<0.05 and <0.01, a DE of 1 was also chosen. c Validation of microarray results. Predictions made on the basis of microarray results obtained following different normalization procedures were validated using qRT-PCR analysis. Values expected from GC-RMA-based analysis match qRT-PCR results most closely. Genes selected were chosen on the basis of their relevance for Parkinson's disease. GC-RMA-, PLIER- and MAS5.0-based algorithms are compared
Fig. 1 (continued)
Fig. 2 Comparison of the number of significant genes in the medial and lateral substantia nigra. For the two analysis
results on the left (medial and lateral nigra, respectively) only medial and lateral samples (PD vs control) were compared (two-class unpaired t test, unequal variance, variance inflation, Bonferroni p value correction). It is interesting to note that the observation that some highly significant genes appear to be "specific" to the lateral and medial nigra, respectively (235 and 86, respectively), is paralleled by the fact that the patterns of degeneration in the lateral compared with the medial substantia nigra are known to differ
Table 3 Direct comparison of differentially regulated genes in this and another published study (A chip only;
[17]) Gene symbol
Probe set name GenBank number
Description Our data
(fold change)
Zhang et al. 2005a [17] (fold change)
NFASC 214799_at AI821777 Brain expressed, X-linked 1 1.236 2.15
PTDSR 212723_at AK021780 Phosphatidylserine receptor 1.179 2.41
HSPB1 201841_s_at NM_001540 Heat-shock 27 kDa protein 1 1.502 1.69
MKNK2 218205_s_at NM_017572 MAP kinase interacting serine/threonine kinase 2
1.239 1.75
TF 214064_at AI073407 Transferrin 1.053 1.90
AMPH 205257_s_at NM_001635 Amphiphysin (Stiff-Man syndrome with
breast cancer 128 kDa auto-antigen)
-2.189 -3.20
BEX1 218332_at NM_018476 Brain expressed, X-linked 1 -1.023 -1.96
CDC42 214230_at R37664 Cell division cycle 42 (GTP binding
protein, 25 kDa)
-1.796 -3.20
CHGB 204260_at NM_001819.1 Chromogranin B (secretogranin 1) -2.167 -2.60
FGF13 205110_s_at NM_004114 Fibroblast growth factor 13 -2.708 -3.90
MDH1 200978_at NM_005917 Malate dehydrogenase 1, NAD (soluble) -1.000 -2.37
NEFL 221805_at AL537457 Neurofilament, light polypeptide 68 kDa -1.920 -2.78
NSF 202395_at NM_006178 N-ethylmaleimide-sensitive factor -1.389 -2.62
PC4 221727_at AA456973 Activated RNA polymerase II transcription
cofactor 4
-1.381 -2.06
PRKAR2B 203680_at NM_002736 Protein kinase, cAMP-dependant,
regulatory, type II, beta
-1.777 -2.07
SV2B 20555l_at NM_014848 Synaptic vesicle glycoprotein 2B -2.030 -2.29
SYT1 203999_at AV731490 Synaptotagmin I -2.296 -3.01
SNAP25 202508_s_at NM_003081 Synaptosomal-associated protein, 25 kDa -1.339 -1.98
STMN2 203000_at BF967657 Stathmin-like 2 -1.761 -2.60
SNX10 218404_at NM_013322 Sorting nexin 10 -1.171 -2.28
RGS4 204337_at AL514445 Regulator of G-protein signalling 4 -2.120 -4.16
NAD Nicotinamide adenine dinucleotide, cAMP cyclic adenosine monophosphate
aThe paper by Zhang et al. (2005) [17] lists alternative probe set names for NEFL (221916_at) and SNAP25 (202507_s_at). Unlike the present study, the manuscript by Zhang et al. only reports results obtained using the Affymetrix HG_133A chip
We identified 570 sequences ("priority genes") which passed the FDR correction and which were up- or down-regulated at least twofold in the parkinsonian nigra (Fig. 1a). The ratio between up- and down-down-regulated messages was 1:6. The gene exhibiting the strongest loss of activity was tyrosine hydroxylase (probe 208291 s at, p = 5.29384e-06, DE = -3.88). The highest up-regulation observed was at three log units (800%) with p = 7.14996e-05. The highest significance for differential regulation was obtained at p = 4.151 48e-08 for one EST at DE = -1.7. Using p<0.001 as the significance threshold and 0.1 log units (approximately 7% difference in expression) as the cut-off for differentially expressed mRNA sequences, 3,224 differentially regulated messages were identified.
The Venn diagram in Fig. 2 shows the intersection of highly significant genes detected in the lateral and medial nigra compared with the total number of nigra genes. The medial and lateral nigra showed significant differences in expression for some genes (86 and 235, respectively). The 466 genes at the intersection of all three groups form the focus of our current analysis. Contained within this group of significant genes are a larger number of ESTs, suggesting that new pathways exist that have so far not been studied in relation to PD pathogenesis. However, it is clear that our list of 570 priority genes is a "working" list and will have to be constantly checked and amended if justified.
Regarding differential regulation of PD-associated genes in the cerebral cortex, we found that some were co-regulated with genes that were differentially expressed in the SN, but we also observed a number of apparently unique transcriptomic profiles which will need to be confirmed. Importantly, it appears that the number of genes showing co-regulation was too high (several observations made, work in progress) to be explained by chance alone, suggesting that at least at the level of the brain, PD may be considered a "systemic" disease. This would be in keeping with the widespread pathology revealed by alpha-synuclein immunocytochemistry.
'Gene ontology' (GO) [18] represents a controlled vocabulary to describe gene and gene product attributes in an organism (http://www.geneontology.org). The three organizing principles of GO are molecular function, biological process and cellular component. The 570 regulated sequences were grouped according to their corresponding annotations (Fig. 3). It is interesting that for each of the above GO categories, approximately half of the priority sequences could not be assigned to known GO categories (48.2, 54.8 and 50.8%, respectively). Of the priority sequences concerned, 51.8% possess known molecular functions (Fig. 3 a). The most highly
represented transcripts in this group are involved in metal ion binding or act as receptors and enzymes. It is notable that a large number of sequences also play a role in DNA and nucleic acid binding. This is of special interest considering that fragmentation of nuclear DNA is an established finding in parkinsonian nigra [19, 20]. Transcripts representative of established cellular components (Fig. 3b) and known biological processes (Fig. 3c) accounted for slightly less than half (45.2 and 49.2%, respectively) of all regulated transcripts. In the cellular component group, genes and functions related to the nucleus, plasma membrane and the membrane fraction represent more than half of all priority transcripts. For the known biological processes, the highest percentage of transcripts were protein synthesis and breakdown (7.4%), signalling (7.9%), cell cycle, growth and development (9.5%) and transport (10.7%). Examining the distribution of highly regulated messages across pathways, only a small minority (11%) could be assigned to established metabolic cascades (GenMAPP/KEGG). The most highly represented include amino acid metabolism, translation factors, cellular signalling and cell adhesion (Fig. 3d). Interestingly, a number of our priority messages map to PARK loci, which are likely to harbour as yet
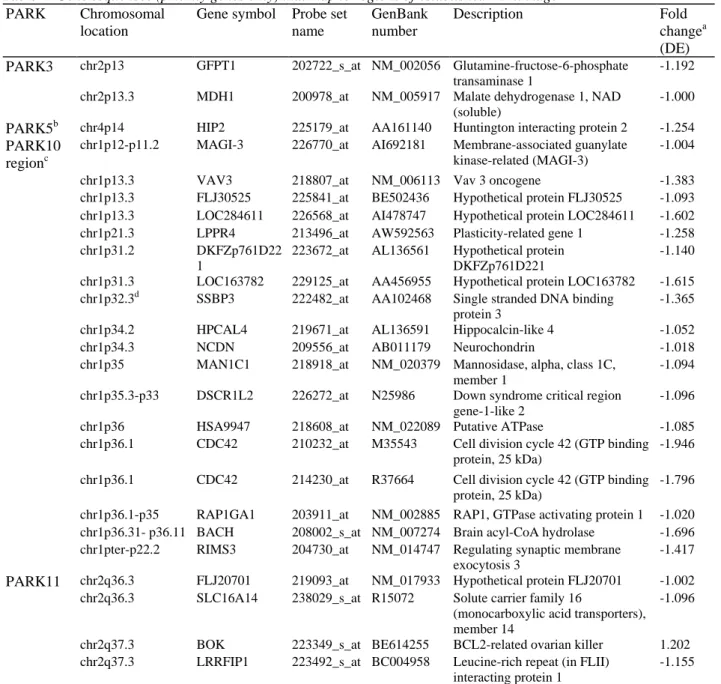
unidentified PD-causing genes (Table 4). In addition to the gene mapping most closely to the Park10 locus [21], our full list includes all transcripts (priority genes only) derived from chromosome 1p, in view of a recent publication linking this region to risk and age-of-onset in PD [22]. However, overall and based on GO, only approximately 50% of these transcripts located on 1p have known molecular functions or form part of
established biological processes or cellular components (data not shown). Three of the probes mapping to the lp region, which identify two proteins, i.e. cell division cycle 42 (CDC42) and vav 3 oncogene (VAV3), are involved in the integrin-mediated cell adhesion pathway (GenMAPP). Furthermore, looking at the list of priority genes in greater detail, several up-regulated transcripts were found to be members of the DNAJ family of heat-shock proteins. These include DnaJ (Hsp40) homologue subfamily B, member 1 (DNAJB1) and DnaJ (Hsp40) homologue, subfamily B, member 6 (DNAJB6). The DNAJ family provides important molecular chaperones which have been implicated in the assembly and disassembly of protein complexes, pro-tein folding, renaturation of denatured proteins, prevention of protein aggregation and protein export (http://www.ncbi.nlm.nih.gov/ entrez/query.fcgi?b=OMIM). Observed values for those genes were p = 0.000212164 and DE=1.4 for DNAJB6 (209015_s_at), p = 0.007720513 and DE = 1.1 for DNAJB1 (200666_s_at) and p = 8.08917e-05 and DE=0.9 for DNAJB2 (202500 at), respectively.
Fig. 3 Percentage of established genes (non-EST transcripts) serving a known molecular function, representing
an established cellular component, participating in known biological processes and forming pathways. Genes are grouped according to their annotations as defined by Gene Ontology (GO; [18]). In the case of very small group sizes, summary headings were created for functionally related groups. Keys for resolving each summary group are given in Supplementary Table 1. a Per cent of non-EST transcripts (51.8% of 570) serving a known molecular function. The insert (pie chart) shows that almost half (48.2%) of the "prioritised genes" do not have a known molecular function. b Per cent of differentially expressed non-EST transcripts (45.2% of 570) categorized according to the cellular component to which they belong. The insert (pie chart) shows that the majority of the "prioritised genes" do not have a known cellular function. c Per cent of non-EST transcripts (49.2% of 570) serving a known biological process. Genes were grouped according to the known biological process in which they are involved; the majority of transcripts (50.8%) cannot be assigned to Gene Ontology categories. d Per cent of highly significant non-EST sequences that are members of established pathways. The pie chart shows that only 11% (63/570) of the regulated transcripts can be assigned to known pathways (GenMAPP/ KEGG). Therefore, the vast majority (89%) of the "prioritised genes" are not part of a known gene regulatory network
Table 4 Gene sequences (priority genes only) that map to regions of established PD linkage
PARK Chromosomal
location
Gene symbol Probe set name GenBank number Description Fold changea (DE)
PARK3 chr2p13 GFPT1 202722_s_at NM_002056 Glutamine-fructose-6-phosphate
transaminase 1
-1.192
chr2p13.3 MDH1 200978_at NM_005917 Malate dehydrogenase 1, NAD
(soluble)
-1.000
PARK5b chr4p14 HIP2 225179_at AA161140 Huntington interacting protein 2 -1.254
PARK10 regionc
chr1p12-p11.2 MAGI-3 226770_at AI692181 Membrane-associated guanylate kinase-related (MAGI-3)
-1.004
chr1p13.3 VAV3 218807_at NM_006113 Vav 3 oncogene -1.383
chr1p13.3 FLJ30525 225841_at BE502436 Hypothetical protein FLJ30525 -1.093 chr1p13.3 LOC284611 226568_at AI478747 Hypothetical protein LOC284611 -1.602
chr1p21.3 LPPR4 213496_at AW592563 Plasticity-related gene 1 -1.258
chr1p31.2 DKFZp761D22
1
223672_at AL136561 Hypothetical protein DKFZp761D221
-1.140
chr1p31.3 LOC163782 229125_at AA456955 Hypothetical protein LOC163782 -1.615
chr1p32.3d SSBP3 222482_at AA102468 Single stranded DNA binding
protein 3
-1.365
chr1p34.2 HPCAL4 219671_at AL136591 Hippocalcin-like 4 -1.052
chr1p34.3 NCDN 209556_at AB011179 Neurochondrin -1.018
chr1p35 MAN1C1 218918_at NM_020379 Mannosidase, alpha, class 1C,
member 1
-1.094
chr1p35.3-p33 DSCR1L2 226272_at N25986 Down syndrome critical region gene-1-like 2
-1.096
chr1p36 HSA9947 218608_at NM_022089 Putative ATPase -1.085
chr1p36.1 CDC42 210232_at M35543 Cell division cycle 42 (GTP binding
protein, 25 kDa)
-1.946
chr1p36.1 CDC42 214230_at R37664 Cell division cycle 42 (GTP binding
protein, 25 kDa)
-1.796
chr1p36.1-p35 RAP1GA1 203911_at NM_002885 RAP1, GTPase activating protein 1 -1.020 chr1p36.31- p36.11 BACH 208002_s_at NM_007274 Brain acyl-CoA hydrolase -1.696 chr1pter-p22.2 RIMS3 204730_at NM_014747 Regulating synaptic membrane
exocytosis 3
-1.417
PARK11 chr2q36.3 FLJ20701 219093_at NM_017933 Hypothetical protein FLJ20701 -1.002
chr2q36.3 SLC16A14 238029_s_at R15072 Solute carrier family 16
(monocarboxylic acid transporters), member 14
-1.096
chr2q37.3 BOK 223349_s_at BE614255 BCL2-related ovarian killer 1.202
chr2q37.3 LRRFIP1 223492_s_at BC004958 Leucine-rich repeat (in FLII) interacting protein 1
-1.155
ATPase Adenosinetriphosphatase
aAll probes listed were tested using the Benjamini and Hochberg FDR model bUCHL1 is also a member of the list of priority genes
cSome genes associated with risk and age-of-onset in PD are localised to chromosome 1p [22] d
Fig. 4 Identification of novel PD-associated genes belonging to the DnaJ family of heat-shock proteins which
have been implicated in protein folding and protein complex dissociation (OMIM). The pathway schematic illustrates that binding of HERPUD1 (homocysteine-inducible, endoplasmic reticulum stress-inducible, ubiquitin-like domain member 1) with the proteasome [28, 29] has a negative effect on the regulation and expression of DnaJ (Hsp40) homolog, subfamily B, member 1 (DNAJB1) [30] and DnaJ (Hsp40) homolog, subfamily B, member 6 (DNAJB6) [31]. N, nucleus
Discussion
The goal of this research programme is to answer the question of which differences in gene expression are responsible for the preferential susceptibility of dopaminergic nerve cells of the SN to dysfunction and eventual cell death. We present for the first time a whole genome expression analysis of the SN of 15 cases of
neuropathologically confirmed PD and 8 controls. We have observed a number of highly significant expression differences in this study, and it is important to bear in mind that we have analyzed RNA extracted from whole-tissue rather than individual cell types, and that expression differences are likely to be a reflection of disease affecting nerve cells as well as glia. We have found that less than 50% of the sequences interrogated by the gene chips were detectable in the SN. Therefore, approximately half of all human genes may be excluded from the search for genes that are of relevance in Parkinson's disease. At the same time we find that the difference between the parkinsonian nigra and control tissue is remarkably quantitative rather than predominantly qualitative.
Only a few publications have so far detailed transcriptomic information on the parkinsonian nigra, and in those studies, genome coverage was restricted to either small Affymetrix HG Focus arrays [23] or the HG 133A array only [17, 24]. We compared the published gene lists of all three studies and checked for overlap (consistency), examining in detail all genes that are shared between at least two of the data sets. While the study by Hauser et al. 2005 [24] provides limited published information, and none of the top candidates of Grunblatt et al. 2004 [23] could be confirmed in our data set (matching results with seven down-regulated transcripts only, i.e. GBE1, ALDH 1A1, TRIM36, SLC18A2P, TMEM4, HIP2, and NR4A2), we observed excellent agreement between the A chip gene list published by Zhang et al. 2005 [17] and our own data (their study only used the HG_133A chip).
A potentially very important finding of this study concerns a series of 25 sequences which are highly
differentially regulated in PD and which map to known PARK loci. Accordingly, these sequences may play a role in sporadic PD and represent candidates for as yet unidentified disease-causing genes. Details of these candidate genes are given in Table 4.
We and others believe that dysfunction in the ubiquitin-proteasome system and cellular stress represent mechanisms behind the irreversible loss of dopaminergic neurones in PD (Duke et al., submitted). Dysfunction of the endoplasmic reticulum (ER) has also been proposed. In this study, we report increased levels of
HERPUD1 mRNA in parkinsonian SN, which is the product of a gene that encodes an ER resident protein which is up-regulated in response to ER stress. It is well known that the accumulation of misfolded proteins in ER triggers an "unfolded protein response" (UPR), which increases transcription of genes encoding for ER chaperones and enzymes associated with ER protein degradation [25]. In the normal brain HERPUD1 has been localised to neurones, and it is found in activated microglia in senile plaques in the brains of Alzheimer's disease patients [26]. A microarray study of a 6-hydroxydopamine (6-OHDA)-treated dopaminergic cell line also shows that the neurotoxin stimulates pathways associated with cellular stress and the UPR accompanied by the expression of HERPUD1 [27]. The schematic pathway shown in Fig. 4 illustrates the interaction between homocys teine-inducible, ER stress-inducible, ubiquitin-like domain member 1 (HERPUD1; 217168_s_at, p = 0.00 2316407, DE= 0.53) and the proteasome [28, 29], which is known to negatively influence expression of DNAJB1 [30] and downstream DNAJB6 [31]. DNAJB1 is involved in biological processes (GO) associated with chaperone-cofactor-dependant protein folding (i.e. assisting in the covalent and non-covalent assembly of post-translational proteins and single-chain polypeptides or multi-subunit complexes into the correct tertiary structure) and has a known molecular function interacting selectively with unfolded protein.
Future work will focus on the detailed and individualised expression profile of the priority sequences described here as well as additional members of this data set across various PD brain regions, their cellular localisation in different cell types and a study of their biological function in pathways in vitro and in vivo. Furthermore, a detailed analysis of individual genome usage by each PD case in relation to neuropathological and clinical features will be performed. Finally, we are planning to link our transcriptomic data to additional data layers (proteomics, metabonomics and morphonomics) to obtain a more holistic and refined picture of PD in the context of what we have termed multidimensional tissue analysis (http://www.neurogenetics.net/
Multidimensional.html).
Acknowledgements
We are grateful to the brain donors and their families for the provision of brain tissue for research. This work was funded through a programme grant from the UK Parkinson's Disease Society. We are grateful to the Parkinson's Disease Society Tissue Bank at Imperial College London, funded by the Parkinson's Disease Society of the UK, registered charity 948776. We would also like to thank the UK Multiple Sclerosis Tissue Bank at Imperial College London. Use of an Affymetrix node in the Department of Neuropathology, funded by the Trustees of the Corsellis Collection, is gratefully acknowledged. The authors would like to thank Dr. Stuart Peirson for his expert advice on the qRT-PCR analysis and Dr. Geraint Barton from the Bioinformatics Support Service, Imperial College London, for his advice and for the reading of the manuscript.
References
1. Polymeropoulos MH, Lavedan C, Leroy E, Ide SE, Dehejia A, Dutra A, Pike B, Root H, Rubenstein J, Boyer R, Stenroos ES,
Chandrasekharappa S, Athanassiadou A, Papapetropoulos T, Johnson WG, Lazzarini AM, Duvoisin RC, Di Iorio G, Golbe LI, Nussbaum RL (1997) Mutation in the alpha-synuclein gene identified in families with Parkinson's disease. Science 276:2045-2047
2. Kruger R, Kuhn W, Muller T, Woitalla D, Graeber M, Kosel S. Przuntek H, Epplen JT, Schols L, Riess O (1998) Ala30Pro mutation in the gene encoding alpha-synuclein in Parkinson's disease. Nat Genet 18:106-108
3. Singleton AB, Farrer M, Johnson J, Singleton A, Hague S, Kachergus J, Hulihan M, Peuralinna T, Dutra A, Nussbaum R, Lincoln S, Crawley A, Hanson M, Maraganore D, Adler C, Cookson MR, Muenter M, Baptista M, Miller D, Blancato J, Hardy J, Gwinn-Hardy K (2003) Alpha-synuclein locus triplication causes Parkinson's disease. Science 302:841
4. Kitada T, Asakawa S, Hattori N, Matsumine H, Yamamura Y Minoshima S, Yokochi M, Mizuno Y, Shimizu N (1998) Mutations in the parkin gene cause autosomal recessive juvenile parkinsonism. Nature 392:605-608
5. Leroy E, Boyer R, Auburger G, Leube B, Ulm G, Mezey E, Harta G, Brownstein MJ, Jonnalagada S, Chernova T, Dehejia A, Lavedan C, Gasser T, Steinbach PJ, Wilkinson KD, Polymeropoulos MH (1998) The ubiquitin pathway in Parkinson's disease. Nature 395:451-452 6. Valente EM, Abou-Sleiman PM, Caputo V, Muqit MM, Harvey K, Gispert S, Ali Z, Del Turco D, Bentivoglio AR, Healy DG, Albanese A, Nussbaum R, Gonzalez-Maldonado R, Deller T, Salvi S, Cortelli P, Gilks WP, Latchman DS, Harvey RJ, Dallapiccola B, Auburger G, Wood NW (2004) Hereditary early-onset Parkinson's disease caused by mutations in PINK1. Science 304:1158-1160
7. Bonifati V, Rizzu P, van Baren MJ, Schaap O, Breedveld GJ, Krieger E, Dekker MC, Squitieri F, Ibanez P, Joosse M, van Dongen JW, Vanacore N, van Swieten JC, Brice A, Meco G, van Duijn CM, Oostra BA, Heutink P (2003) Mutations in the DJ-1 gene associated with autosomal recessive early-onset parkinsonism. Science 299:256-259
8. Le WD, Xu P, Jankovic J, Jiang H, Appel SH, Smith RG, Vassilatis DK (2003) Mutations in NR4A2 associated with familial Parkinson disease. Nat Genet 33:85-89
9. Paisan-Ruiz C, Jain S, Evans EW, Gilks WP, Simon J, van der Brag M, Lopez de Munain A, Aparicio S, Gil AM, Khan N, Johnson J, Martinez JR, Nicholl D, Carrera IM, Pena AS, de Silva R, Lees A, Marti-Masso JF, Perez-Tur J, Wood NW, Singleton AB (2004) Cloning of the gene containing mutations that cause PARK8-linked Parkinson's disease. Neuron 44:595-600
10. Zimprich A, Biskup S, Leitner P, Lichtner P, Farrer M, Lincoln S, Kachergus J, Hulihan M, Uitti RJ, Calne DB, Stoessl AJ, Pfeiffer RF, Patenge N, Carbajal IC, Vieregge P, Asmus F, Muller-Myhsok B, Dickson DW, Meitinger T, Strom TM, Wszolek ZK, Gasser T (2004) Mutations in LRRK2 cause autosomal-dominant parkinsonism with pleomorphic pathology. Neuron 44:601-607
11. Fearnley JM, Lees AJ (1991) Ageing and Parkinson's disease: substantia nigra regional selectivity. Brain 114:2283-2301 12. Moran LB, Duke DC, Turkheimer FE, Banati RB, Graeber MB (2004) Towards a transcriptome definition of microglial cells. Neurogenetics 5:95-108
13. Wu Z, Irizarry RA (2004) Preprocessing of oligonucleotide array data. Nat Biotechnol 22:656-658
14. Hsiao LL, Dangond F, Yoshida T, Hong R, Jensen RV, Misra J. Dillon W, Lee KF, Clark KE, Haverty P, Weng Z, Mutter GL, Frosch MP, Macdonald ME, Milford EL, Cram CP, Bueno R, Pratt RE, Mahadevappa M, Warrington JA, Stephanopoulos G, Stephanopoulos G, Gullans SR (2001) A compendium of gene expression in normal human tissues. Physiol Genomics 7:97-104
15. Vandesompele J, De Preter K, Pattyn F, Poppe B, Van Roy N, De Paepe A, Speleman F (2002) Accurate normalization of realtime quantitative RT-PCR data by geometric averaging of multiple internal control genes. Genome Biol 3:RESEARCH0034
16. Peirson SN, Butler JN, Foster RG (2003) Experimental validation of novel and conventional approaches to quantitative real-time PCR data analysis. Nucleic Acids Res 31(14):e73
17. Zhang Y, James M, Middleton FA, Davis RL (2005) Transcriptional analysis of multiple brain regions in Parkinson's disease supports the involvement of specific protein processing, energy metabolism, and signaling pathways, and suggests novel disease mechanisms. Am J Med Genet B Neuropsychiatr Genet 137:5-16
18. Ashburner M, Ball CA, Blake JA, Botstein D, Butler H, Cherry JM, Davis AP, Dolinski K, Dwight SS, Eppig JT, Harris MA, Hill DP, Issel-Tarver L, Kasarskis A, Lewis S, Matese JC. Richardson JE, Ringwald M, Rubin GM, Sherlock G (2000) Gene ontology: tool for the unification of biology. The Gene Ontology Consortium. Nat Genet 25:25-29
19. Kosel S, Egensperger R, von Eitzen U, Mehraein P, Graeber MB (1997) On the question of apoptosis in the parkinsonian substantia nigra. Acta Neuropathol (Berl) 93:105-108
20. Graeber MB, Grasbon-Frodl E, Abell-Aleff P, Kösel S (1999) Nigral neurons are likely to die of a mechanism other than classical apoptosis in Parkinson's disease. Parkinsonism Relat Disord 5:187-192
21. Hicks AA, Pétursson H, Jónsson T, Stefánsson H, Jóhannsdóttir HS, Sainz J, Frigge ML, Kong A, Gulcher JR, Stefánsson K, Sveinbjörnsdóttir S (2002) A susceptibility gene for late-onset idiopathic Parkinson's disease. Ann Neurol 52:549-555
22. Oliveira SA, Li YJ, Noureddine MA, Züchner S, Qin X, Pericak-Vance MA, Vance JM (2005) Identification of risk and age-at-onset genes on chromosome 1 p in Parkinson disease. Am J Hum Genet 77:252-264
23. Grunblatt E, Mandel S, Jacob-Hirsch J, Zeligson S, Amariglo N, Rechavi G, Li J, Ravid R, Roggendorf W, Riederer P, Youdim MB (2004) Gene expression profiling of parkinsonian substantia nigra pars compacta; alterations in ubiquitin-protea-some, heat shock protein, iron and oxidative stress regulated proteins, cell adhesion/cellular matrix and vesicle trafficking genes. J Neural Transm 111:1543-1573 24. Hauser MA, Li YJ, Xu H, Noureddine MA, Shao YS, Gullans SR, Scherzer CR, Jensen RV, McLaurin AC, Gibson JR, Scott BL, Jewett RM, Stenger JE, Schmechel DE, Hulette CM, Vance JM (2005) Expression profiling of substantia nigra in Parkinson disease, progressive supranuclear palsy, and frontotemporal dementia with parkinsonism. Arch Neurol 62:917-921
25. Gerace L, Gilmore R, Johnson A, Lazarow P, Neupert W, O'Shea E, Weis K (2002) Intracellular compartments and protein sorting. In: Alberts B, Johnson A, Lewis J, Raff M, Roberts K, Walter P (eds) Molecular biology of the cell, 4th edn. Garland, New York
26. Sai X, Kawamura Y, Kokame K, Yamaguchi H, Shiraishi H, Suzuki R, Suzuki T, Kawaichi M, Miyata T, Kitamura T, De Strooper B, Yanagisawa K, Komano H (2002) Endoplasmic reticulum stress-inducible protein, Herp, enhances presenilin-mediated generation of amyloid beta-protein. J Biol Chem 277:12915-12920
27. Holtz WA, O'Malley KL (2003) Parkinsonian mimetics induce aspects of unfolded protein response in death of dopaminergic neurons. Biol Chem 278:19367-19377
28. van Laar T, van der Eb AJ, Terleth C (2001)Mifl : a missing link between the unfolded protein response pathway and ER-associated protein degradation? Curr Protein Pept Sci 2:169-190
29. van Laar T, van der Eb AJ, Terleth C (2002) A role for Rad23 proteins in 26S proteasome-dependent protein degradation? Mutat Res 499:53-61
30. Tanahashi-Hori T, Tanahashi N, Tanaka K, Chiba T (2003) Conditional knockdown of proteasomes results in cell-cycle arrest and enhanced expression of molecular chaperones Hsp70 and Hsp40 in chicken DT40 cells. J Biol Chem 278:16237-16243
31. Inada H, Izawa I, Nishizawa M, Fujita E, Kiyono T, Takahashi T, Momoi T, Inagaki M (2001) Keratin attenuates tumor necrosis factor-induced cytotoxicity through association with TRADD. J Cell Biol 155:415-426