Science Arts & Métiers (SAM)
is an open access repository that collects the work of Arts et Métiers Institute of Technology researchers and makes it freely available over the web where possible.
This is an author-deposited version published in: https://sam.ensam.eu Handle ID: .http://hdl.handle.net/10985/8406
To cite this version :
Raphaël MOULART, Fabrice PIERRON, Stephen R. HALLETT, Michael R. WISNOM - Full-field strain measurements at high rate on notched composites tested with a tensile Hopkinson bar - In: DYMAT 2009 - 9th International Conferences on the Mechanical and Physical Behaviour of Materials under Dynamic Loading, Belgium, 2009-09-07 - DYMAT 2009 - 9th International Conferences on the Mechanical and Physical Behaviour of Materials under Dynamic Loading -2009
Any correspondence concerning this service should be sent to the repository Administrator : archiveouverte@ensam.eu
FULL-FIELD STRAIN MEASUREMENTS AT HIGH RATE
ON NOTCHED COMPOSITES TESTED WITH A TENSILE
HOPKINSON BAR
R. Moulart1, F. Pierron1, S.R. Hallett2, M.R. Wisnom2
1
Laboratoire de Mécanique et Procédés de Fabrication (LMPF – EA 4106), Arts et Métiers ParisTech, 51000 Châlons-en-Champagne, France
2
Advanced Composites Centre for Innovation and Science, University of Bristol, Queen's Building, BS8 1TR Bristol, UK
Raphael.Moulart@chalons.ensam.fr
SUMMARY
The present paper deals with full-field strain measurement on open-hole tensile specimens submitted to high strain rate through a Hopkinson bar device. After having briefly explained the methodology (using an Ultra-High speed camera), the strain results obtained on a first test are shown leading to a discussion on the non-uniform state of loading induced by the Hopkinson bar system. Then, a first attempt to identify stiffnesses on this dynamic case from only the strain and acceleration maps using the Virtual Fields Method is introduced. The results are extremely promising considering the limited quality of the measurements.
Keywords: Full-field measurement, high strain rate, UHS camera, grid method, Hopkinson bar, virtual fields method.
INTRODUCTION
The identification of the mechanical behaviour of materials at high strain rates is still an open problem. One of the reasons is that at such strain rates, homogeneous stress and strain states are extremely difficult to obtain so that the usual identification procedures do not apply. Thanks to the recent development of ultra-high speed imaging systems, it should now be possible to study the strain distribution in high-rate applications by adapting the full-field measurement methods used in quasi-static load states. This work proposes a first attempt to extract strain fields at speeds up to 300,000 frames per second (fps) with the grid method.
METHODOLOGY
The specimens were 16 mm wide, [452/902/-452/02]s quasi-isotropic glass laminated
composite coupons with a 3.175 mm diameter open circular hole. On these specimens, a cross-grid of 200 µm pitch was bonded. This grid constitutes the pattern necessary to measure the full-field displacement maps. The grid method was used [1] to process the grid images. It is based on the calculation of the phase of a periodic pattern (the grid)
deposited onto the surface. The in-plane displacement maps can thus be obtained and, by numerical differentiation, the in-plane strain fields.
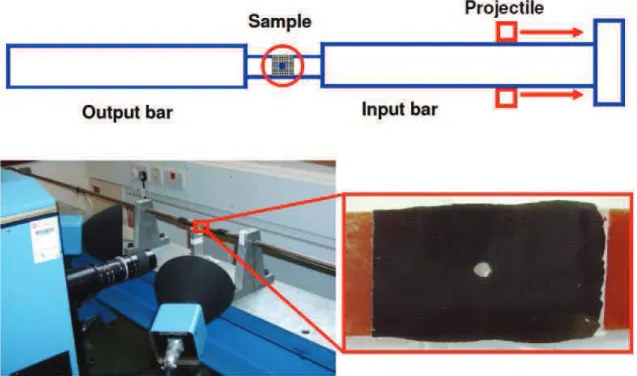
These specimens were tested in tension using a Hopkinson bar device. They were attached to two bars. A projectile was shot onto the input bar, creating a tensile stress wave that will be partially transmitted through the sample. With this kind of device, one can typically obtain strain rates up to 1000 s-1.
To record the pictures of the grid during the mechanical test, an ultra-high speed camera was used. This one, a Cordin 550-62, is based on a rotating mirror that directs the light successively to 62 multiplexed CCD sensors that record the different states of loading. The frame rate of recording is given by the rotation speed of the mirror. With this device, one can obtain a maximum of 4,000,000 fps acquisition. In this study, due to light and triggering issues, the acquisition was limited to 300,000 fps. Figure 1 gives a general overview of the device.
Figure 1: The Hopkinson bar device with camera and lighting system
In order to overcome the problems of image distortions that can occur when correlating images from one CCD sensor to another (misalignment of the sensors, rotations, variations of light intensity, etc.), the displacement maps were calculated sensor by sensor. To do so, a first set of still images was taken before performing the mechanical test. A second set of images was taken during the loading and the displacement between the initial (still) and the actual states have thus been calculated sensor by sensor from these two sets. This approach is only possible if the global strain remains low and by using a phase unwrapping algorithm in order to get “absolute” values of the displacements [2]. With this approach, one can obtain a displacement resolution equal to
approximately 3 % of the grid pitch (6 µm). This is worse than what can be obtained in quasi-static tests but not so bad considering the frame rate.
EXPERIMENTAL RESULTS
A test with the Hopkinson bar has been performed on the glass fibre sample mentioned above. The velocity of the projectile at the moment of the impact was 25 m.s-1.
A set of 62 frames has been recorded with the camera with a frequency of 300,000 fps. On this set, a certain number of frames were recorded before the strain wave passed through the sample. The time t = 0 of this test will be considered to be the last frame recorded without any significant displacement, this is frame 35. On frame 44 (t = 30 µs), the first crack on the sample occurs; calculation of the full-field strain maps will be subsequently meaningless since a discontinuity has appeared.
On frame 49 (Figure 2), several cracks have occurred. These present an angle of 45° which is induced by the angle of the fibres of the surface ply. The two main cracks have occurred from the hole to the edge of the samples. The one located below the hole has reached the edge of the sample whereas the one located above the hole has not. Moreover, two other smaller cracks can be seen on the lower part of the sample. This seems to indicate that the tensile loading is not exactly symmetrical and higher on the lower part of the sample, probably because of some parasitic in-plane bending effect.
Figure 2: Recorded image a t = 46.7 µs (frame 49) showing cracks on the sample.
This is confirmed by the Ux displacement maps (Figure 3). They are showing
isodisplacement lines tilted with a certain angle (approximately 45°). Normally, with a pure tensile loading, they should be almost vertical and only disturbed by the presence of the hole [3].
To determine the strain maps from the displacement maps and considering the fact that the data are disturbed by the relatively high level of noise, the U maps have to be smoothed before being numerically differentiated. For this purpose, a diffuse approximation algorithm has been used [4]. This method is based a local polynomial regression (using a local weighted least square algorithm) that gives smoothed reconstructed displacement fields. The main parameter of this algorithm is the critical radius that determines the size of the window of influence for the reconstruction at each point. Here, a critical radius equal to 10 periods has been used. With the current displacement resolution, it gives a strain resolution equal to 1 to 2×10⁻³.
Figure 3: Some Ux maps (colormap in µm).
The reconstructed εxx maps are shown on Figure 4. These strain maps clearly show that
the value of the normal strain in the direction of the loading is higher in the lower part of the sample than in the upper part. This confirms what has been expected by looking at the spatial localization of the cracks and at the disturbed displacement maps and indicates that there are some bending effects superimposed onto the tensile loading. This can be due to a misalignment of the system (input and output bar of the Hopkinson bar) but more probably to the way the sample is attached to the system. Indeed, the samples are glued to special fixtures called the end-caps that are then screw onto the bars. The bending effects can be induced by a misalignment of the sample in the end-caps or by the clearance in the screw attachments. In this case, the effect should not be reproducible (in terms of location) which has been verified (in another test, the density of cracks is more important in the upper part of the sample). Progress will have to be made in the design of these end-tabs in the future.
Figure 4: Some εxx maps.
IDENTIFICATION OF THE MECHANICAL PROPERTIES OF THE MATERIAL
From the displacement maps, it is also possible to calculate acceleration maps. For this purpose, a simple finite differences algorithm has been used:
{
,}
. , ) ( 2 ) 1 ( ) 1 ( ) ( 2 x y t n U n U n U n a ∈ ∆ × − − + + = α α αα
α (1)On the ax maps (Figure 5), the acceleration can reach several 106 m.s-2. Although these
maps are very noisy, it should be possible to use them in order to identify the mechanical properties of the tested material.
For this purpose, the Virtual Fields Method (VFM) will be used. It is based on the principle on virtual work [5]. In this dynamic case, this principle can be written as follows: , * * *⋅ + ⋅ ⋅ = ⋅ ⋅ ⋅ ⋅ − ∂V V V
σ
ε
dV T U dSρ
a U dV (2) where:–
σ
is the actual stress tensor;– U* is a virtual displacement field and
ε∗ the virtual strain field associated;
– V is the volume of the region of interest;– T is the actual loading imposed at the boundary of the considered region V; – a is the actual acceleration field;
Figure 5: ax maps (colormap in m.s-2).
To replace the unknown
σ
field, an assumption on the constitutive equation has to be made. In the considered case, the composite sample has a quasi-isotropic membrane behaviour. Equation 2 becomes:(
)
(
)
(
* *)
(
* *)
. * 2 * * * 2 * * ⋅ ⋅ + ⋅ ⋅ = ⋅ ⋅ + ⋅ + ⋅ ⋅ ⋅ − ⋅ + ⋅ − + ⋅ ⋅ ⋅ + ⋅ + ⋅ − ∂V x x y y V x x y y V yy xx xx yy xy xy xy V xx xx yy yy xy xy xx dV U a U a dS U T U T dV Q dV Qρ
ε
ε
ε
ε
ε
ε
ε
ε
ε
ε
ε
ε
(3)The two unknowns are the stiffnesses Qxx and Qxy. By choosing two different virtual
fields, U* and associated
ε∗, a linear system of two equations with two unknowns is
obtained: , 2 2 1 1 22 21 12 11 − − = C B C B Q Q A A A A xy xx (4)with the A terms corresponding to the integrals containing the strain fields, the B terms corresponding to inertial effects (integrals containing the acceleration field) and the C terms corresponding to the external virtual works (integrals containing the external loading).
As, in the present case, T, the external loading, is completely unknown (no force measurement was collected during the test), one has to choose two virtual fields that do not make it work (i.e. cancel the terms C is Equation 4) such as the following ones:
(
)
{
} {
}
(
)
{
U U x x L y}
{
x(
x L)
(
x L)
y}
L x U L x x U xy yy xx y x xy yy xx y x − = − = = − = = = = − = = − = 2 5 . 0 * , * , 0 * * , 0 * 0 * , 0 * , 2 * 0 * , * 1 1 1 2 2 1 1 1 1 1ε
ε
ε
ε
ε
ε
(5)Then, the linear system of Equation 4 can be inverted and the unknown stiffnesses be directly obtained from the strain and acceleration fields.
This method should work very well whenever relevant acceleration and strain signals are available. The main issue in the present case is to get enough acceleration signal to be able to apply the VFM accurately. It should work with the results obtained at t = 13.3 µs where significant acceleration was obtained. The identified properties calculated from these measurements with the virtual fields mentioned in Equation 5 are given in table 1.
Table 1: Identified mechanical properties
Parameter E (GPa) ν
Identified value 37 0.31 Expected value 24.5 0.35
These values are not so far from the expected ones. This result is very promising considering the limited quality of the measurements. It has to be underlined that this use of the VFM using only the inertial effects as information source has never been made until now for such a high speed dynamic case. It has only so far been used for identification of damping parameters of vibrating plates [6]. So, although the results have to be improved, this approach remains original and quite promising.
CONCLUSION
In this paper, a first attempt at full-field measurements on open-hole composite tensile specimens tested at high strain rates has been introduced. The methodology using a UHS camera has been described. Regarding the multi-sensor nature of the camera, this method involves the computation of displacement maps from initial and actual stages sensor by sensor (and not incrementally from one sensor to another) to be able to get relevant displacement values by limiting the effects of the sensor to sensor discrepancies.
The strain maps have been deduced from the displacements using a diffuse approximation algorithm. These maps have shown spatial distributions of strain
compatible with the ones obtained for the same geometry in quasi-static. Nevertheless, some asymmetry in these fields suggested that the loading was not exactly homogeneous and unidirectional; some bending effects, probably due to how the coupons are attached to the fixture, were superimposed to the tensile loading.
Finally, a first attempt of identification of mechanical properties from strain and acceleration using the Virtual Field Method has been performed. Although the measurements are rather noisy, this identification procedure has yielded very reasonable values of the equivalent isotropic Young’s modulus and Poissons ratio of the tested laminate, which is quite interesting and encouraging as this is the first time that such an approach has been used.
Some further experiments using the same experimental device and the same procedure should be performed in the future to try to obtain better results (in terms of strain and acceleration resolutions) and thus consolidate the first identification result obtained. Contrast of the grid pattern and lighting are two tracks to follow to improve the quality of the measurements.
ACKNOWLEDGEMENTS
The authors would like to acknowledge the funding from the UK Engineering and Physical Sciences Research Council (EPSRC) to support the present project.
References
1. Surrel Y., Moiré and grid method: a signal processing approach, Interferometry ’94: Photomechanics, SPIE vol. 2342, Nov. 1994.
2. Bioucas-Dias J and Valadão G., Phase unwrapping via graph cuts, IEEE Transactions on Image processing, 16, pp. 698-709, 2007.
3. Pierron F., Green B. and Wisnom M.R., Full-field assessment of the damage process of laminated composite open-hole tensile specimens. Part I: Methodology, Composites Part A, 38, pp. 2321-2332, 2007.
4. Avril S., Feissel P., Pierron F. and Villon P., Estimation of the strain field from full-field displacement noisy data: comparing finite elements global least squares and polynomial diffuse approximation, European Journal of Computational Mechanics, 17, pp. 857-868, 2008.
5. Grédiac M., Pierron F., Avril S. and Toussaint E., The virtual fields method for extracting constitutive parameters from full-field measurements: a review, Strain: an International Journal for Experimental Mechanics, 42, pp.233-253, 2006.
6. Giraudeau A., Guo B. and Pierron F., Stiffness and damping identification from full-field measurements on vibrating plates, Experimental Mechanics, 46, pp.777-787, 2006.