J O U R N A L O F
T
O
R
T H E E U R O P E A N
O P T I C A L S O C I E T Y
R A P ID P U B L IC A T IO N S
P a s s i v e
i n t r o d u c t i o n
o f
c a r r i e r
f r i n g e s
i n
r e a l - t i m e
p h o t o r e f r a c t i v e
i n t e r f e r o m e t e r s
f o r
s i n g l e
i n t e r f e r o g r a m
a n a l y s i s
Gilles Pauliat gilles.pauliat@institutoptique.frLaboratoire Charles Fabry de l’Institut d’Optique, CNRS, Univ Paris-Sud, Campus Polytechnique, RD128, 91127 Palaiseau cedex, France
G´erald Roosen Laboratoire Charles Fabry de l’Institut d’Optique, CNRS, Univ Paris-Sud, Campus Polytechnique, RD128, 91127 Palaiseau cedex, France
Marc P. Georges Centre Spatial de Li`ege, Universit´e de Li`ege, Parc Scientifique du Start Tilman, Avenue du Pr´e Aily, Angleur 4031, Belgium
Giancarlo Pedrini Institut f ¨ur Technische Optik, Universit¨at Stuttgart, Pfaffenwaldring 9, 70569 Stuttgart, Germany
We propose a new technique to introduce carrier fringes in an holographic interferometric set-up for deformation or vibration analyses. This technique makes use of the anisotropic diffraction processes of photorefractive crystals. The main advantage of the proposed technique is that it just involves static components, no moving parts or active components are required. This technique is demonstrated in a real-time interferometric set-up operating at the wavelength of 1.06 µm and with a GaAs photorefractive crystal as the holographic medium. [DOI: 10.2971/jeos.2006.06024]
Keywords: Holographic interferometry, photorefractive crystals, carrier fringes
1 I n t r o d u c t i o n
Holographic interferometry is known as a powerful tool for deformation and vibration analyses [1]. Photorefractive crys-tals are often used as the holographic medium in interferomet-ric demonstrations [2]–[20] and even in commercial interfer-ometers [21]. Indeed, they present very attractive properties for these specific applications. High resolution holograms can be recorded in these crystals with relatively low energies, typ-ically around 1mJ/cm2for sillenite and semiconductor crys-tals, at visible [2]–[18] or near infrared wavelengths [19,20]. The development of holograms automatically occurs as soon as the material is exposed to the interference pattern. A uni-form illumination, or the recording of a new hologram, auto-matically erases any previously recorded holograms so that these holographic media can be indefinitely reused without any deterioration of their properties.
Although, in some demonstrations, double exposure holo-graphic interferometry is achieved through the recording of two successive holograms [7,8], in most systems a real-time configuration is preferred. Indeed, recording two successive holograms first requires a precise recording schedule to equal-ize the diffraction efficiencies of both holograms, and second decreases the diffraction efficiencies of each hologram. On the contrary, only the hologram corresponding to the first expo-sure is recorded for real-time configurations. During the sec-ond exposure, the wavefront scattered by the object interferes onto the detector with the reconstructed wavefront from the hologram.
In order to determine the sign and amplitude of the
displace-ment of each pixel of the object, phase shifting techniques are implemented. For deformation measurements, the object stays still during, and after, the second exposure so that the temporal phase shifting technique is commonly employed [10]. A series of interferograms is grabbed, with the same ob-ject position, but with different phase shifts between the real-time wavefront and the reconstructed wavefront (phase shifts are usually introduced by a mirror glued on a piezo-electric stack).
For vibration analyses, the object is not at rest and the only way to deal with its movement is to consider a stroboscopic opening of the laser beam in synchrony with the object move-ment during the readout [11]. This supposes that the object is excited sinusoidally with a shaker, piezo-translator or loud-speaker. Under such conditions, the temporal phase-shifting technique can be applied.
Now, the stroboscopic technique gives a partial information and is only useful for the observation of mode shapes around resonance frequencies. For more complete vibration analy-ses with amplitude and phase of vibration determination, or for transient events (like shocks), this temporal phase-shifting technique is no more appropriate. At the expense of an in-creased complexity and cost, interferometers comprising sev-eral CCD cameras can then be used to simultaneously acquire the interferograms corresponding to the different phase shifts [6].
Alternatively, spatial phase shifting techniques could be im-plemented. Carrier fringes are introduced in the
interfero-grams, and the deformation of these fringes is a measure of the amplitude and phase of the displacements. Fast Fourier Transforms algorithms are commonly used to analyse such in-terferograms [22,23].
Such spatial phase shifting schemes were proposed and demonstrated either in a real time configuration [10] or in a double hologram recording scheme [7]. In both cases, the car-rier fringes were introduced in the interferogram by moving a mechanical component, lens or mirror.
Hereafter, we propose a simple implementation of such a spa-tial phase shifting technique specially adapted to real-time configurations. Our scheme does not require any moving or active component. The carrier fringes are automatically intro-duced in the interferogram using a simple birefringent plate. This absence of any active component, and thus any synchro-nisation process, makes this system attractive especially for pulsed operation.
The idea of using birefringent optical elements was already applied in various and early works in classical optical metrol-ogy. Indeed Savart polariscopes and Wollaston prisms pro-duce respectively sheared and tilted wavefronts with separate polarisations [24]. An analyser allows observing the interfer-ence between both polarisation components in various wave-front analysis techniques and configurations [25,26]. Differ-ent types of birefringDiffer-ent optical elemDiffer-ents were more recDiffer-ently considered for speckle and shearing interferometry measure-ments but to produce simultaneous phase shifted images in-stead of the single frame analysis required with the carrier fringe addition [27,28]. Another important example of the use of birefringent optics for fringe generation is the conoscopy technique, which can be applied in point-like characterisation of more general objects [29].
2 P R I N C I P L E O F O P E R A T I O N
Our proposed scheme takes advantage of the specific diffrac-tion properties of photorefractive crystals. When they are used in the so-called “anisotropic diffraction” configuration, the polarization of the diffracted beam can be orthogonal to the polarization of the transmitted beam [4,15]. In a real-time in-terferometric scheme, for linearly polarized incident beams, this anisotropic configuration allows to make the diffracted beam polarization (which corresponds to the object wavefront as it was during the first exposure) orthogonal to the real-time transmitted wavefront polarization. Using birefringent com-ponents, such as wave-plates, phase shifts can be introduced between these two wavefronts. Projecting the two polariza-tion components onto a polarizer axis produces the interfero-gram.
2 . 1 G e n e r a l
i m p l e m e n t a t i o n
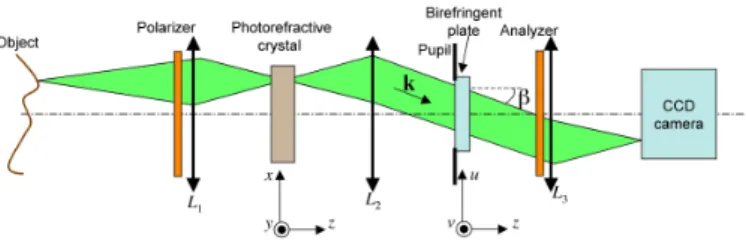
We use the design depicted in Figure1to introduce a phase shift that varies linearly along the x coordinate of the interfer-ogram.
FIG. 1 Scheme of the real-time holographic set-up used to introduce carrier fringes in the interferograms. For sake of clarity, the reference beam and the beam illuminating the object are not represented; only light scattered by one pixel of the object is shown.
This linear variation of the phase shift corresponds to the car-rier fringes with a wave vector along the x coordinate. To compensate for a possible light depolarization, the laser light scattered by the object first goes through a polarizer. During the first exposure, it interferes inside the photorefrac-tive crystal with the reference beam. Although, for hologram recording and reconstruction, the position of the photorefrac-tive crystal is of no importance, in Figure1and in the exper-imental implementation the image plane is set in the middle of the photorefractive crystal. This crystal position presents the advantage of minimizing optical aberrations and of requir-ing the smallest crystal sizes. Lens L1thus projects the image
inside the photorefractive crystals. The two other lenses L2
andL3form a refractive telescope and relay the image onto the
CCD array. In between L2andL3we access the Fourier plane
of this image.
We have inserted inside this Fourier plane the birefringent plate used to introduce the carrier fringes. The pupil position is rejected at infinity (in our experimental set-up the pupil is materialized by an iris diaphragm). Consequently to each (x, y) pixel position in the image plane corresponds a cylin-drical beam onto the birefringent plate. In the (u, v, z) coordi-nate system (see Figure1), this beam propagates along a unit
kvector depending on angles α and β defined by:
k = −cos α sin β u − sin α v + cos α cos β z (1) with (u, v, z) the unit vectors along the(u, v, z) coordinates. In the next paragraph we explain how this birefringent plate is selected to introduce, between the two orthogonal polariza-tions, a phase shift proportional to angle β and thus to coordi-nate x.
These two polarizations are projected onto the analyser and the interferogam modulated by the carrier fringes is grabbed with the CCD camera.
2 . 2 S e l e c t i o n
o f
t h e
b i r e f r i n g e n t
p l a t e
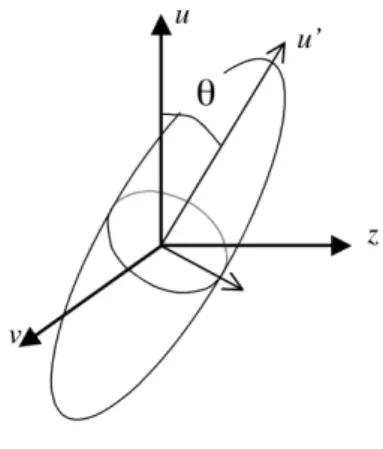
The birefringent plate is made out of a uniaxial crystal. Our goal is to do so that the beam experiences a phase shift ϕ be-tween the two orthogonal polarizations that is proportional to angle β. The input and output faces are thus cut at an angle
angle between the crystal optical axis u0and the set-up axis u (see Figures1and2).
FIG. 2 Cut of the uniaxial plate. The optical axis (u0axis) lies in the(u, z) plane. Simple calculations demonstrate that angle θ that maximizes the phase shift between the two orthogonal polarizations is 45 ˚ . For this angle θ and moderate incident angles α and β (see Eq.(1)), usual calculations of light propagation in uniaxial crystals demonstrate that, at first order in α and β, phase shift
ϕis given by:
ϕ ≈ 2π
λ eβ (ne− no) (2)
with λ the optical wavelength in vacuum, e the physical thick-ness of the plate and neand nothe extraordinary and ordinary
refractive indices of the birefringent material.
Equation (2) expresses the linear dependence of ϕ with β and thus with the image x coordinate: the carrier fringes are thus straight and equally spaced along the x axis. A second order correction in α and β could have been included in Eq.(2). It would introduce a slight curvature of the carrier fringes. For values of θ different from 45 ˚ , this second order correction would be more important. Nevertheless, for the 45 ˚ value we have selected in our experiments this curvature is very small and is perfectly taken into account in the fringe analysis. Of course, the sensitivity to deformation is maximum if the gradient of deformation is along the wave vector of the car-rier fringes, i.e. along the x axis, and it vanishes if the gradient is along the y axis. In case one would need to analyse defor-mations with a circular geometry, one could use a birefringent plate cut perpendicular to its optical axis in a conoscopic ar-rangement in order to generate circular fringes [28].
3 E X P E R I M E N T A L
S E T – U P
A N D
R E S U L T S
3 . 1 S e t - u p
We designed our set-up to operate at 1.06 µm with a Nd:YAG laser. As photorefractive crystal we selected a semiconductor for its photorefractive sensitivity. Several semiconductors of the 43 point group symmetry (GaAs, CdTe, InP) could have worked equally well. We selected GaAs crystals for their good
optical quality in large sizes. We chose a 90 ˚ recording config-uration, i.e a recording configuration in which the signal beam from the object and the reference beam enter the crystal by two orthogonal faces as shown in Figure3[8,9].
FIG. 3 Selected configuration for the photorefractive crystal.
Such a 90 ˚ configuration presents two important advantages:
1. The incidence angle of the reference beam completely frees the space in front of the crystal. Imaging lenses can be set as close as required to the crystal. Typically com-mercial video or camera lenses can be used even with short distances between the image and the first lens or the housing.
2. Because the reference beam does not impact the signal beam entrance and exit faces, this beam is not scattered on these faces in the direction of the detector. These 90 ˚ configurations are thus low noise configurations especially in real-time intererometric configurations in which the reference beam intensity is several orders of magnitude larger than the signal beam [9].
The crystal faces are cut along the crystallographic axes so that the grating wave vector of the interfering beams is along [110] axis as depicted in Figure3[9]. The reference and sig-nal beams are linearly polarized along the [001] crystallo-graphic axis (corresponding to the x axis in Figure1). The diffracted beam is then polarized along the [010] crystallo-graphic axis (corresponding to the y axis in Figure1). The sam-ple is about 10 × 7 × 7mm3along the [100] × [010] × [001] crys-tallographic axes. The h100i and h010i faces are polished at
λ/10 and antireflection coated. In this configuration, we
mea-sure that the maximum amplitude of the refractive index grat-ing recorded with a unit modulation ratio of the interference pattern (equal reference and object beam intensities) is equal to δn ≈ 3.6 10−6. Given the low modulation ratio used dur-ing the interferometric experiments, this ratio is much lower in the experiments reported below, typically about a few per cents.
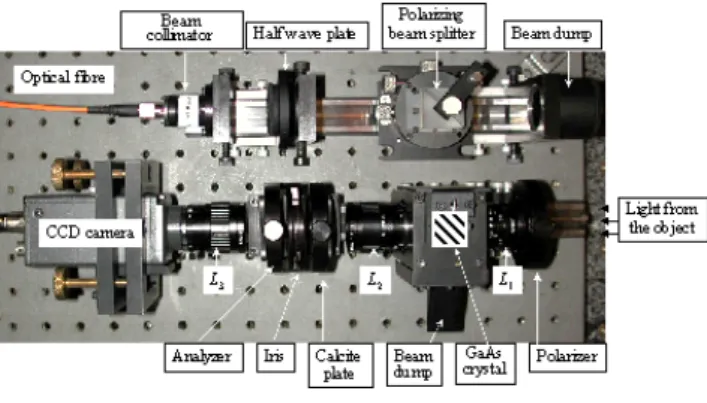
The experiment is fed by a cw Nd:YAG laser operating at 1.06µm. A mechanical shutter at the laser output is used to de-fine the exposure schedule. A power of 220 mW is sent onto the object. About 20 mW is injected inside a multimode fibre to provide the reference beam. The photograph of the experi-mental set-up is shown in Figure4.
FIG. 4 Photograph of the experimental set-up. Its length is about 35 cm.L1,L2,L3
are camera lenses with focal lengths of 25 mm, 50 mm and 50 mm.
Light from this fibre is collimated and sent onto the GaAs sam-ple thanks to the polarizing beam splitter cube. Light from the object first passes a polarizer and is then collected by the first camera lens L1.
The object is then imaged onto the GaAs crystal (only the crys-tal housing is visible in Figure4). The two camera lenses L2
and L3 form a refractive telescope to project the image (and
thus the interferogram) onto the CCD camera. As described in the above section, the birefringent plate, the iris and the an-alyzer are inserted in between these two lenses. For the bire-fringent plate, we chose a calcite plate whose thickness was computed according to Eq.(2) in order to get around 80 carrier fringes onto the CCD array.
The CCD camera is a 1/3” near infra-red camera from Hitachi (Model KP-F2). Such silicon detectors have a relatively low quantum efficiency at the wavelength of 1.06µm. To increase the size of the observed object, given the low efficiency of this camera, we designed an optical system with a large numer-ical aperture. We operated this interferometric set-up with a f-number of 2.8. For such a f-number, the CCD illumination is still uniform over the full field.
The input polarizer is aligned to select the vertical (i.e. along the x axis) polarization component. The axis of the calcite plate is aligned along the same axis. The analyser is then rotated to optimize the carrier fringe contrast in the interferogram. The interferograms are digitized on an 8-bit acquisition video board. Because of the non-uniform illumination of the object, all the interferograms shown below have been normalized to the object image grabbed with the reference beam shut off.
3 . 2 E x p e r i m e n t a l
r e s u l t s
We tested the experiment onto a sand blasted aluminium plate fixed along its border. A piezo-actuator located around the middle of the plate pushes the plate between the two expo-sures. The observed surface is around 13 × 17cm2.
The reference beam power sent onto the crystal is about 2.2 mW. For this power, we measured a recording time con-stant of about τ ≈ 1s. This value is much larger than the
power of the object beam onto the crystal, which is about a few µW.
The interferogram recording schedule is as follows:
• The object being at rest, the hologram is recorded dur-ing 4s.
• The shutter is then closed and the piezo-actuator de-forms the shape of the object.
• We wait for 500ms until all mechanical vibrations van-ish.
• The shutter is opened and the interferogram is grabbed with an integration time of 70 ms, that is before the hologram erasure, which occurs with the time constant
τ ≈1s.
It is important to note that we selected an integration time con-stant much shorter than the hologram erasure time concon-stant to ensure, first that the hologram is not significantly erased, and second that a new hologram is not recorded during the in-terferogram acquisition. The measurement is thus not altered by any hologram modification as explained in more details in reference [10].
We first grabbed an interferogram without activating the piezo-actuator: the object positions are the same during the hologram recording and during the interferogram acquisition. The corresponding interferogram is shown in Figure5a). The noise on the left and right borders corresponds to areas outside the aluminium plate which contain no information. The carrier fringes are clearly visible. The bend of these fringes originate to the second order correction of Eq.(2) in angles α and β.
The interferograms captured after a positive (towards the interferometer) and negative displacements of the piezo-actuator are shown in Figures 5b and 5c). As anticipated, the carrier fringes are curved by the plate deformation. We also observe an unexpected effect: the grey level amplitudes of these fringes are periodically altered along ellipses.We at-tribute this alteration to residual accidental birefringence in-duced by the AR coating on the photorefractive crystal: the diffracted beam polarization is not perfectly perpendicular to the transmitted beam polarization. The part of this diffracted beam that has the wrong polarization interferes constructively (or destructively) with the transmitted beam but experiences, in the calcite plate, the same phase shift than this transmitted beam. It just modifies the transmitted intensity and forms a background image, which is the replica of this deformation. This background image is the interferogram that would have been grabbed in a usual real-time holographic interferometric set-up.
a)
b)
c)
FIG. 5 Interferogram grabbed with the set-up shown in Figure4: a) without object displacement; b) with the object pushed in the middle towards the interferometer; c) with the object pushed in the opposite direction.
The analysis of such an interferogram is of course not suffi-cient to determine the sign and the amplitude of the defor-mation. Indeed, the analysis of such interferograms requires multiple interferograms to be grabbed with temporal phase stepping techniques as described in the introduction. On the contrary, the introduction of the carrier fringes we are per-forming here allows to determine the sign and amplitude of the deformation from a single interferogram.
As shown below, this background image does not signifi-cantly affect the phase maps.
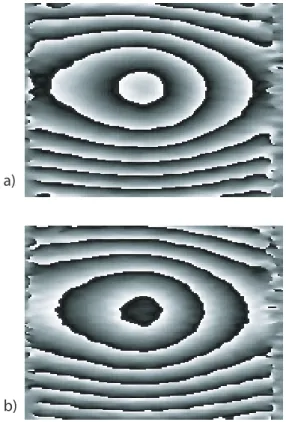
These interferograms were processed with a conventional FFT analysis [22,23] in order to compute the corresponding phase-maps. The unwrapped computed phase maps corresponding to the deformations between respectively Figure5b and Fig-ure5a on the one hand, and between Figure5c and Figure5a) on the other hand, are shown in Figures6a and6b.
These two phase-maps demonstrate the correct operation of
the system: the forward and backward displacements of the object are correctly reconstructed.
a)
b)
FIG. 6 Phase-maps computed from the grabbed interferograms shown in Figure6(see text).
4 C O N C L U S I O N
We have proposed, implemented and tested, a new ometric scheme to introduce carrier fringes in the interfer-ogram. This scheme benefits from the orthogonality of the diffracted and transmitted polarizations in some photore-fractive configurations. We performed the demonstration at 1.06 µm, but other photorefractive crystals, such as sillen-ite crystals, present similar anisotropic diffraction processes and are sensitive in the visible range. Such an interferometric scheme could thus also be implemented in the visible range, for instance at 532nm. In holographic recording materials in which an anisotropic diffraction process is not available, a switchable wave-plate, typically a liquid crystal plate set in front of the first lens, could be used to rotate the transmitted beam polarization between the two exposures.
In the experimental demonstration, the observed area is rather small (about 13 × 17cm2). Nevertheless this area could be
rela-tively easily improved by using CCD arrays with larger active areas, or with larger quantum efficiency (for instance by work-ing at wavelengths below 1.06µm), by increaswork-ing the laser power, or by using photorefractive crystals with larger diffrac-tion efficiencies.
The main advantage of the proposed scheme (with the anisotropic diffraction process) is that no active element is in-volved. This technique would work equally well with pulses.
A C K N O W L E D G M E N T S
This research has been supported by the European Commu-nity in the frame of the EC-funded project PHIFE (Pulsed Holographic Interferometers for analysis of Fast Events).
R e f e r e n c e s
[1] T. Kreis, Holographic Interferometry : Principles and Methods, (Akademie Verlag Series in Optical Metrology 1, Akademie Verlag Berlin 1996).
[2] J.P. Huignard, J.P. Herriau, “Real-time double-exposure interfer-ometry with Bi12SiO20 crystals in transverse electrooptic configu-ration” Appl. Opt.16, 1807 (1977).
[3] J.P. Huignard, J.P. Herriau, T. Valentin, “Time average holographic interferometry with photoconductive electrooptic Bi12SiO20
crys-tals” Appl. Opt.16, 2796 (1977).
[4] A.A. Kamshilin, M.P. Petrov, “Continuous reconstruction of holo-graphic interferograms through anisotropic diffraction in photore-fractive crystals” Opt. Commun.53, 23 (1985).
[5] D. Tontchev, S. Zhivkova, “Enhancement of the signal-to-noise ra-tio during holographic recording in sillenite” Opt. Lett. 17, 1715 (1992).
[6] L. Labrunie, G . Pauliat, J.C. Launay, S. Leidenbach, G. Roosen, “Real-time double exposure holographic phase shifting interfer-ometer using a photorefractive crystal” Opt. Commun. 140, 119 (1997).
[7] F. Rickermann, S. Riehemann, G. von Bally, “Utilization of photore-fractive crystals for holographic double-exposure interferometry with nanosecond laser pulses” Opt. Comm.155, 91 (1998). [8] E. Weidner, G. Pauliat, G. Roosen, “Wavefront buffer memory
based interferometric camera with a photorefractive crystal as the active medium” J. Opt. A: Pure Appl. Opt.5, S524–S528 (2003). [9] M. Georges, G. Pauliat, E. Weidner, S. Giet, C. Thizy, V. Scauflaire,
Ph. Lemaire, G. Roosen, “Holographic interferometry with a 90˚ photorefractive crystal geometry” in:OSA Trends in Optics and Pho-tonics, Advances in photorefractive Materials, Effects, and Devices 87, 511 (2003).
[10] M.P. Georges, Ph.C. Lemaire, “Real-time holographic interferome-try using sillenite photorefractive crystals. Study and optimization of a transportable set-up for quantified phase measurements on large objects” Appl. Phys. B68, 1073 (1999).
[11] M.P. Georges, Ph.C. Lemaire, “Real-time stroboscopic holographic interferometry using sillenite crystals for the quantitative analysis of vibrations” Opt. Comm.145, 249 (1998).
[12] G. Pauliat, G. Roosen, “Continuous monitoring of a surface slope by real-time shearing interferometry with a photorefractive crys-tal” Appl. Opt.45, 993 (2006).
[13] A.A. Kamshilin, V.V. Prokofiev, “Fast adaptive interferometer with a photorefractive GaP crystal” Opt. Lett.27, 1711 (2002).
[14] J. Frejlich, P.M. Garcia, “Advances in real-time holographic inter-ferometry for the measurement of vibrations and deformations” Opt. Lasers Eng.32, 515 (1999).
[15] R.C. Troth, J.C. Dainty, “Holographic-interferometry using anisotropic self-diffraction inBi12SiO20” Opt. Lett.16, 53 (1991).
[16] L. Peng, P. Yu, D.D. Nolte, M.R. Melloch, “High-speed adaptive in-terferometer for optical coherence-domain reflectometry through turbid media” Opt. Lett.28, 396 (2003).
[17] M.R.R. Gesualdi, D. Soga, M. Muramatsu, “Real-time holographic interferometry using photorefractive sillenite crystals with phase-stepping technique” Opt. Lasers Eng.44, 56 (2006).
[18] M. P. Georges, V. S. Scauflaire, Ph. C. Lemaire, “Compact and portable holographic camera using photorefractive crystals. Ap-plication in various metrological problems” Appl. Phys. B72, 761 (2001).
[19] P. Delaye, A. Blouin, D. Drolet, L.A. deMontmorillon, G. Roosen, J.P. Monchalin, “Detection of ultrasonic motion of a scattering surface by photorefractive InP:Fe under an applied dc field” J. Opt. Soc. Am B14, 1723 (1997).
[20] L.A. deMontmorillon, P. Delaye, J.C. Launay, G. Roosen, “Novel the-oretical aspects on photorefractive ultrasonic detection and imple-mentation of a sensor with an optimum sensitivity” J. Appl. Phys. 82, 5913 (1997).
[21] OPTRION S.A., http://www.optrion-tech.com
[22] M. Takeda, H. Ina, S. Kobayashi, “Fourier-transform method of fringe-pattern analysis for computer-based topography and inter-ferometry” J. Opt. Soc. Am.72, 156 (1982).
[23] T. Schwider, “Advanced evaluation techniques in interferometry” ,in Progress in Optics, E. Wolf ed., Vol. XXVIII, (Elsevier Science Publishers, B.V, 1990).
[24] S. Mallick, “Common path interferometers” ,in Optical Shop
Test-ing, D. Malacara ed., page 95, (John Wiley & Sons, Inc. 1992).
[25] M.V. Mantravadi, “Lateral shearing interferometers” ,in Optical
Shop Testing, D. Malacara ed., page 123, (John Wiley & Sons, Inc.
1992).
[26] D. Malacara, “Radial, rotational, and reversal shear interferome-ters” ,in Optical Shop Testing, D. Malacara ed., page 173, (John Wiley & Sons, Inc. 1992).
[27] A.J.P. van Haasteren, H.J. Frankena, “Real-time displacement mea-surement using a multicamera phase-stepping speckle interfer-ometer” Appl. Opt.33, 4137 (1994).
[28] A.L. Weijers, H. van Brug, H.J. Frankena, “Polarization phase step-ping with a Savart element” Appl. Opt.37, 5150 (1988).