1 Effects of rearing environment and strain combination on heterosis in brook trout
1 2
AMELIE CRESPEL AND CELINE AUDET* 3
Institut des sciences de la mer de Rimouski (ISMER), Université du Québec à Rimouski (UQAR), 310 4
des Ursulines, Rimouski, QC, G5L 3A1, Canada 5
6
LOUIS BERNATCHEZ 7
Institut de Biologie Intégrative et des Systèmes (IBIS), Pavillon Charles-Eugène-Marchand, 1030, 8
Avenue de la Médecine, Local 1145, Université Laval, Québec, QC, G1V 0A6, Canada 9
10
DANY GARANT 11
Département de biologie, Faculté des Sciences, Université de Sherbrooke, Sherbrooke, QC, J1K 2R1, 12
Canada 13
14 15
* Corresponding author: celine_audet@uqar.qc.ca 16
17 18 19 20
Short title: Heterosis in brook trout 21
22 23 24
2 Abstract
25
In this study, three strains (domestic [D], Laval [L], and Rupert [R]) of brook trout (Salvelinus 26
fontinalis) and their reciprocal hybrids were reared from 7 to 21 months of age in three different 27
environments (indoor, constant temperature conditions; indoor, seasonal temperature variations; 28
outdoor, seasonal temperature variations) to test for the occurrence of heterosis of important life history 29
traits also of interest for production (body mass, length, condition factor, absence of early sexual 30
maturation, survival). For each cross, body mass, length, and mortality were measured at regular 31
intervals and sexual maturity was assessed in 1+ animals (21 months of age). We found evidence for 32
heterosis in mass and length that varied according to strain, cross direction in reciprocal hybrids, 33
developmental stage, or environment; no significant outbreeding depression was detected for these 34
traits. Heterosis expression for weight varied from 4.9% to 23.8% depending on hybrids and 35
environments. We found that one out of five reciprocal hybrids tested (L♀R♂) expressed heterosis at 36
each age stage throughout the experiment in the three environments while the other four had mixed 37
results. No evidence for heterosis was observed for sexual maturity and survival. These results provide 38
one of the first clear pieces of evidence for the occurrence of heterosis in salmonids but also illustrate 39
the complex nature and the unpredictability of this phenomenon. 40
41 42 43 44
Keywords: heterosis; outbreeding depression; environment; performance; hybrids; brook trout, 45
Salvelinus fontinalis 46
47 48
3 Introduction
49 50
Heterosis, or hybrid vigor, refers to the increased performance and fitness of first generation progeny 51
when compared to parental lines (Falconer and Mackay 1996; Birchler et al. 2003). The main 52
explanation supporting the occurrence of heterosis is based on non-additive genetic components: the 53
dominance effect seen in hybrids, which is based on the replacement or complementation of deleterious 54
alleles accumulated in one parental line by superior alleles from the other parent; over-dominance, 55
which suggests that heterozygotes perform better than homozygotes; and epistasis, which refers to 56
allelic position and interactions in the hybrid (Birchler et al. 2003; Hochholdinger and Hoecker 2007; 57
Lippman and Zamir 2007). The relative contribution of each of these processes in the expression of 58
heterosis is still a matter of debate (Lippman and Zamir 2007). 59
60
The intensity of heterosis is usually higher when parental lines are highly inbred or genetically distant 61
from each other (Shikano et al. 2000; Wang and Xia 2002; Hochholdinger and Hoecker 2007). 62
However, the opposite phenomenon that results from genome admixture—outbreeding depression— 63
could also affect crosses involving genetically distant strains. Outbreeding depression may arise from a 64
disruption of the linkage arrangement of co-adapted gene complexes in the presence of a divergence in 65
the genetic architecture of populations (based on epistasis components and referred to as intrinsic 66
outbreeding depression) or from a loss of favorable allelic interactions (based on additive and 67
dominance components and referred to as extrinsic outbreeding depression) (Edmands 2007; 68
McClelland and Naish 2007; Tymchuk et al. 2007; Wang et al. 2007). When a cross is made, it is 69
difficult to predict which phenomenon might appear since both heterosis and outbreeding depression, 70
result from outbreeding crosses between distant parental lines and are controlled, at least in part, by 71
similar non-additive effects. 72
4 73
Breeding programs in plants and animals commonly use heterosis to improve traits of interest for 74
production as an alternative to the use of additive genetic components (Falconer and Mackay 1996; 75
Comings and MacMurray 2000; Hochholdinger and Hoecker 2007). While such practice has been more 76
limited in fish production, it has been used to improve aquaculture in carp (Cyprinus carpio; Wohlfarth 77
1993; Hulata 1995; Nielsen et al. 2010), tilapia (Oreochromis niloticus; Marengoni et al. 1998), and 78
also experimentally explored in guppy (Poecilia reticulate; Shikano and Taniguchi 2002a). Previous 79
studies have also investigated heterosis for various traits, including growth, survival, salinity and 80
temperature tolerance (Moav and Wohlfarth 1976; Bentsen et al. 1998; Nakadate et al. 2003), and more 81
recently for patterns of gene expression (Bougas et al. 2010). 82
83
In salmonids, it is still unclear if heterosis occurs. Heterosis for growth and survival in intra-specific 84
hybrid crosses have been reported (Ayles and Baker 1983; Gjerde and Refstie 1984; Bryden et al. 85
2004) while other authors only observed additive interactions for these same traits (Cheng et al. 1987; 86
Einum and Fleming 1997; Glover et al. 2006) and even outbreeding depression (Gharrett et al. 1999). 87
From these studies, it has been hypothesized that heterosis may be generally rare in salmonids (Gjerde 88
and Refstie 1984; Gharrett et al. 1999; Bryden et al. 2004). More specifically, Tymchuk et al. (2007) 89
suggested that salmonid populations may be too genetically distant and locally adapted to produce 90
heterosis. However, in brook trout (genus Salvelinus) in particular, previous studies on hybrid crosses 91
between wild and domestic populations have suggested a potential for heterosis expression for growth 92
and survival (Fraser 1981; Webster and Flick 1981) in this species although it has not been investigated 93
in details. 94
5 The choice of the strain used as dam or sire in the cross may also be determinant on heterosis
96
expression (Bentsen et al. 1998). A strain can perform better when used as dam or sire, improving 97
specific capacities in hybrids (Bentsen et al. 1998; Perry et al. 2004; Wang et al. 2006b). The 98
environment may also modify genetic expression and influence the additive and non-additive genetic 99
components. A decrease in the additive variance and an increase in the epistasis variance are usually 100
expected under unfavorable environmental conditions (Wohlfarth 1993; Hoffmann and Merilä 1999). 101
In addition, heterosis seems to be more sensitive to environmental variations than additive components 102
(Bentsen et al. 1998). Different strains could also express different sensitivities to environmental 103
variations involving possible genotype – environment interactions relative to heterosis expression 104
(Falconer and Mackay 1996; Bentsen et al. 1998). 105
106
In this context, the aim of this study was to investigate the effects of rearing environment and strain 107
combination on the occurrence of heterosis for growth in the brook trout (Salvelinus fontinalis). In 108
teleost fishes, body mass and size at the juvenile stage can be considered as fitness-related traits since 109
they are correlated with different components of fitness such as survival, life history tactic, or 110
reproductive success (Sogard 1997; Wilson et al. 2003; Garcia de Leaniz et al. 2007; Thériault et al. 111
2007). Our specific objectives were therefore to evaluate (1) the occurrence of intra-specific heterosis 112
on important life history traits also of interest for production (body mass, length, condition factor, 113
absence of early sexual maturation, survival), (2) the presence of dam or sire effects on the hybrid 114
performance and heterosis for the traits considered, and (3) the effects of environment on heterosis 115
expression. 116
117 118
6 Materials and methods
119 120
Brook trout strains 121
Three strains of brook trout were used as parental stock. The Laval strain originates from a wild 122
population of anadromous brook trout from the Laval River (48°44'N; 69°05'W) on the north shore of 123
the St. Lawrence estuary (Quebec). The fish used as breeders were third generation individuals 124
produced in captivity at the Station aquicole of ISMER/UQAR (Rimouski, Quebec). The Rupert strain 125
originates from a freshwater resident wild population inhabiting the Rupert River system (51°05'N; 126
73°41'W) draining Mistassini Lake (Quebec). The breeders were again third generation fish produced 127
in captivity at the Laboratoire régional en sciences aquatiques (LARSA, Université Laval, Quebec). 128
The domestic strain is widely used by the Québec fish farming industry. It originates from two strains 129
(Nashua and Baldwin), and breeders were obtained from the Pisciculture de la Jacques Cartier (Cap-130
Santé, Quebec). The two strains recently domesticated from wild populations were selected for breed 131
improvement because adults exhibit late sexual maturation and large adult size in the wild. The Laval 132
and Rupert strains were shown to be genetically distant from the domestic strain. Thus 76.2% of alleles 133
from the wild strains were not found in the domestic strain, resulting in high Fst between the domestic 134
vs. Rupert and Laval strains [mean Fst = 0.187 ± 0.009). The Laval and Rupert strains were even more 135
genetically differentiated than the domestic vs. Laval or domestic vs. Rupert strains [mean Fst = 0.427 136
± 0.020 (Martin et al. 1997). Finally, Martin et al. (1997) found no evidence for pronounced inbreeding 137
in any of these three strains with inbreeding coefficient (F) values varying between 0.18 and 0.35. 138
139
Breeding design 140
Hybrid and purebred crosses were made from mid-November 2005 until the end of December 2005 at 141
LARSA using eggs and milt obtained from the different fish rearing locations. Three purebred strains 142
7 were produced: ♀ domestic × ♂ domestic (D♀D♂), ♀ Laval × ♂ Laval (L♀L♂), and ♀ Rupert × ♂ 143
Rupert (R♀R♂). Five reciprocal hybrids were produced: D♀R♂, D♀L♂, L♀D♂, L♀R♂, and R♀L♂. It was 144
not possible to obtain the R♀D♂ cross because of the temporal differences in sexual maturation between 145
these two strains (October for domestic males and December for Rupert females). All breeders were 146
used only once. For each cross, 10 full-sib families were obtained through single-pair matings, but 8 of 147
these 80 families were eliminated (because of low hatching success for some due to poor egg or milt 148
quality and random elimination of two families with high hatching success rate to get similar numbers 149
of families in each rearing tank). The final numbers of families were 10 D♀D♂, 10 L♀L♂, 9 R♀R♂, 9 150 D♀R♂, 7 D♀L♂, 9 L♀D♂, 10 L♀R♂ and 8 R♀L♂. 151 152 Family rearing 153
During the first six months, i.e., from egg incubation (January) to exogenous feeding (June), families 154
were kept separate in recirculating fresh water and reared in seven troughs, each of which was divided 155
into twelve units. Water temperature was maintained at 6°C during egg incubation and at 8°C after 156
hatching. In June, families were marked and, later identified, by different combinations of adipose and 157
pelvic fin clippings and transferred to nine 3 m3 tanks, with eight families per tank. All families were 158
brought to the same fry stage by the end of the summer and maintained at 10°C in recirculating fresh 159
water. The photoperiod followed the natural seasonal cycle and fish were fed according to commercial 160
charts. 161
162
In September, fish from each family were randomly divided among three rearing environments. At 163
ISMER, 230 fish per family were reared in ten 0.5 m3 indoor tanks, with six to eight families per tank 164
according to the initial pool conditions set up at LARSA, under natural temperature and photoperiod 165
conditions in running dechlorinated fresh water. To maintain sustainable rearing densities, the number 166
8 of fish per family was gradually reduced to 60 by the end of the experiment (Table 1), with all
167
reductions in number being done randomly. Fish were fed daily (1% w/w ration) with commercial dry 168
pellets. At LARSA, 150 fish per family were reared in nine 3 m3 tanks under natural photoperiod 169
conditions at 10°C in recirculating indoor freshwater tanks. Fish numbers were gradually decreased to 170
50 fish per family by the end of the experiment (Table 1). Fish were fed daily (1% w/w ration) with 171
commercial dry pellets. At the fish farm (Pisciculture de la Jacques Cartier facility), it was not possible 172
to follow individual families and only type comparisons were done. Two hundred fish per cross-173
type were reared in one outdoor pond under natural temperature and photoperiod conditions. The 174
experiment lasted from September 2006 (7-month-old fish) to November 2007 (21-month-old fish). 175
176
Performance traits 177
Every eight weeks at ISMER and LARSA, 25 fish per family (n = 1800 for each location: 250 fish [25 178
fish × 10 families] for D♀D♂, L♀L♂, and L♀R♂ cross-types; 225 fish [25 fish × 9 families] for the R♀R♂, 179
D♀R♂, and L♀D♂ cross-types; 200 fish [25 fish × 8 families] for the R♀L♂ cross-type; and 175 fish [25 180
fish × 7 families] for the D♀L♂ cross-type) were anaesthetized in MS 222 (0.16 g/L [3-aminobenzoic 181
acid ethyl ester]) and their body mass (0.1 g) and fork length (0.1 cm) were measured. At the fish farm, 182
mass and length were measured only twice: on 25 fish per cross-type in July (n = 200), and on every 183
remaining fish in November (n = 710). In the two others environments, mass and length were also 184
recorded for every remaining fish at the final sampling in November (LARSA, n = 3500: D♀D♂, and 185
L♀R♂: 500 fish [50 fish × 10 families]; L♀L♂: 477 fish [ ≈ 48 fish × 10 families]; R♀R♂ and D♀R♂: 450 186
fish [50 × 9 families]; R♀L♂: 400 fish [50 × 8 families]; L♀D♂: 373 fish [≈ 42 fish × 9 families]; and 187
D♀L♂: 350 fish [50 × 7 families]; (2) ISMER, n = 4115: D♀D♂, L♀L♂, and L♀R♂: 600 fish [60 × 10 188
families];; D♀R♂ and L♀D♂: 540 fish [60 × 9 families]; R♀R♂: 39 fish [≈ 49 fish × 9 families]; D♀L♂: 189
9 420 fish [60 × 7 families]; and R♀L♂: 376 fish [≈ 47 fish × 8 families]. Condition factor was estimated 190
according to the equation: 191
(mass / length3) × 100 (1) 192
193
In November 2007, the presence or absence of sexual maturation was determined at the three rearing 194
environments. For 25 fish per family at ISMER and LARSA and 25 fish per cross-type at Pisciculture 195
de la Jacques Cartier, gonads were excised and weighed and the gonadosomatic index was calculated 196
as: 197
(gonad mass / total mass) × 100 (2) 198
199
A daily record of mortalities was made at ISMER and LARSA. The relative mortality was determined 200
for each family in these two environments. At Pisciculture de la Jacques Cartier, all fish were captured 201
and counted at the end of the experiment and the relative mortality determined for each cross-type. 202
203
Statistical analysis 204
Data normality and homogeneity of variance were tested with the Kolmogorov-Smirnov and the 205
Brown-Forsythe tests respectively. Mass data (log), condition factor (rank), and all percentage indexes 206
(arcsin) were transformed to obtain normality and account for heteroscedasticity. Since body mass and 207
length were highly correlated (r = 0.98, P < 0.05), we only tested models using body mass. 208
209
To test for the presence of heterosis (objective 1), hybrid performance was compared to the 210
performance of parental strains using ANOVAs and post-hoc tests. We used a conservative approach 211
and considered that heterosis was present only when hybrids significantly outperformed both parental 212
strains. Mass and condition factor were analyzed using two linear mixed models: 213
10 yijkl = µ + ASi + Ej + Ck + (AS×E)ij + (AS×C)ik + (E×C)jk + (AS×E×C)ijk + Fkl+ eijkl Model A
214
yijkl = µ + ASi + Ej + Ck + (AS×E)ij + (AS×C)ik + (E×C)jk + (AS×E×C)ijk + eijkl Model B
215
where yijkl is the phenotypic observation; µ is the sample mean; ASi is the effect of the ith age stage; Ej
216
is the effect of the jth environment; Ck is the effect of the kth cross-type, all of which were fitted as
217
fixed effects as well as their interactions; Fkl is the effect of the lth full-sib families nested in kth
cross-218
types fitted as a random effect; and eijkl is the random residual effect. Model A includes the two
219
environments, ISMER and LARSA, at each age stage while model B includes the three environments 220
at two age stages (17 and 21 months). The a posteriori Tukey’s HSD tests applied on least square 221
means were used to detail significant factor or interaction effects. Sexual maturity and survival were 222
analyzed using two-way ANOVAs with environment and cross-type as factors. The a posteriori Tukey 223
test was used for mean comparisons when possible or replaced by the Games and Howell test when 224
variances were not homogenous (Sokal and Rohlf 1981). 225
226
When the presence of significant heterosis or outbreeding depression was found, the intensity was 227
expressed in percentage according to Shikano and Taniguchi (2002): 228
[(f1/m) - 1] × 100 (3) 229
where f1 is the mean performance of the F1 hybrids and m the mean performance of parental strains. To 230
test for the effects of cross direction (objective 2) and environment (objective 3) on the intensity of 231
heterosis, we either took into account the presence or absence of significant heterosis, or when 232
heterosis was present in both reciprocal hybrids or for a same hybrid in different environments, the 233
intensity was compared with ANOVAs. 234
11 The relative importance of additive, dominant, and epistatic genetic interactions in determining the 236
performance of hybrids were calculated according to Wu and Li (2002) and based on the partitioning of 237
the phenotypic variance of the full-sibs F1 into each component of the variance. 238 VA(f1) = (1/2) [Vf1 + Vm – VH] (4) 239 VNA(f1) = (1/2) [Vf1 + VH – Vm] (5) 240 d/a = 2 (f1 – m) / (Pi – Pj) (6) 241 VD(f1) = [(d/a)2 × VA(f1)] / 2 (7) 242 VI(f1) = VNA(f1) – VD(f1) (8) 243
where VA(f1) is the additive variance and VNA(f1) the non-additive variance of the F1 hybrids; Vf1, Vm, 244
and VH are the variance of the performance of the F1 hybrids, the variance of the mean performance of 245
the parental strains, and of the variance of heterosis respectively; d/a is the dominance ratio; f1 is the 246
mean performance of the F1 hybrids; m is the mean performance of parental strains; Pi and Pj are the 247
mean performance of each i and j parental strains; VD(f1) is the dominance variance and VI(f1) the 248
epistasis variance of the F1 hybrids. 249
250
Mixed model analyses were performed using JMP 7 (SAS Institute, NC, USA); other statistical 251
analyses were conducted using Statistica version 6.0 for Windows (StatSoft, USA). The statistical 252
analyses were not corrected for multiple tests. A significance level of α = 0.05 was used in all statistical 253 tests. 254 255 Results 256 257
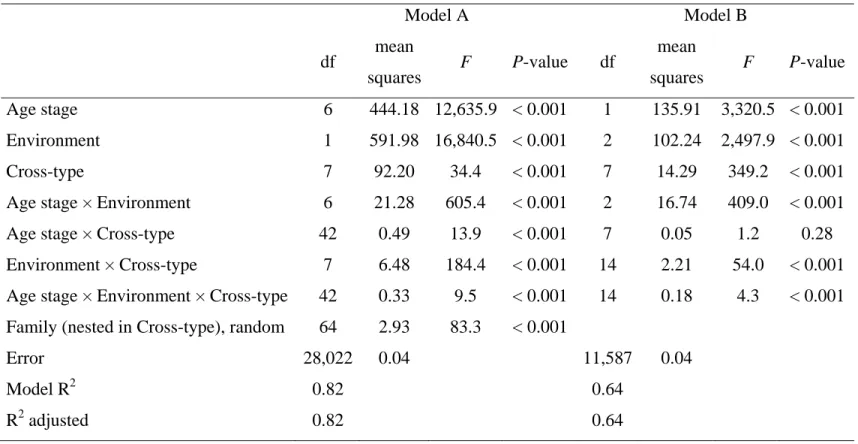
Body mass differed among environments, age stages and cross-types (significant interaction, P < 0.001; 258
Table 2). The mixed models explained a large proportion of the total variance with an adjusted R2 of 259
12 0.82 (Model A) and 0.64 (Model B) for body mass (Table 2). All cross-types were significantly heavier 260
when raised in the constant temperature environment (LARSA), except for domestic fish, which 261
showed similar weights at the three different environments at the end of the experiment (Table 3). 262
When the three pure cross-types were compared, domestic fish were always significantly bigger than 263
the two other strains in all three environments (P < 0.05; Table 3). In the constant temperature 264
environment at LARSA, the Rupert strain was significantly heavier than the Laval strain (P < 0.05; 265
Table 3). At ISMER, such a difference could only be observed at 17 months of age (Table 3). 266
267
When hybrid body mass was compared to those of their respective parental lines, heterosis was present 268
but varied according to the type of hybrid cross; no outbreeding depression was observed (Tables 3 and 269
4). The D♀R♂ hybrid was intermediate to the values measured for the two parental strains in all three 270
environments (Table 3) and never expressed heterosis. L♀R♂ hybrids were significantly heavier than 271
their two parental lines (P < 0.01; Table 3). They also expressed heterosis at each age stage and in all 272
three environments (Table 4). Globally, the intensity of heterosis expressed by L♀R♂ hybrids was 273
higher at ISMER than at LARSA (14.6 ± 1.5 vs. 10.2 ± 1.0; df =1, F = 6.6294, P = 0.011) and 274
decreased over time, i.e., the intensities in 18- and 21-month-old fish were significantly lower than in 275
9-, 11-, 13- and 15-month-olds (df = 6, F = 4.0388, P < 0.001; Interaction site × age stage: P > 0.05). In 276
contrast, R♀L♂ hybrids were usually intermediate to their parental lines, except for 17- and 21-month-277
old animals, which were significantly heavier than their two parental lines in the two environments 278
with less controlled rearing conditions, i.e., ISMER (17 month-old only) and the fish farm (Table 3). 279
The intensity of heterosis expressed by the R♀L♂ hybrids was similar in both LARSA and ISMER 280
environments for 17-month-old animals, similar between 17-month-old and 21-month-old animals at 281
the fish farm, and similar to the heterosis intensity expressed by the L♀R ♂ hybrids when occurring 282
simultaneously at the farm and at ISMER (P < 0.05 for all statistical comparisons). The D♀L♂ and 283
13 L♀D♂ hybrids both had intermediate mass compared to the parental lines in the varying temperature 284
environments (ISMER and the fish farm) and presented no heterosis (Table 3). However, under 285
constant temperature at LARSA, L♀D♂ hybrids were significantly heavier than the two parental lines 286
(P < 0.05; Table 3) and expressed heterosis, but only starting at 15 months of age. The intensity of 287
heterosis did not vary over time (df = 3, F = 0.2544, P > 0.05; Table 4). In contrast, the reciprocal 288
hybrid D♀L♂, remained intermediate to its parental lines and never expressed heterosis (Table 3). 289
290
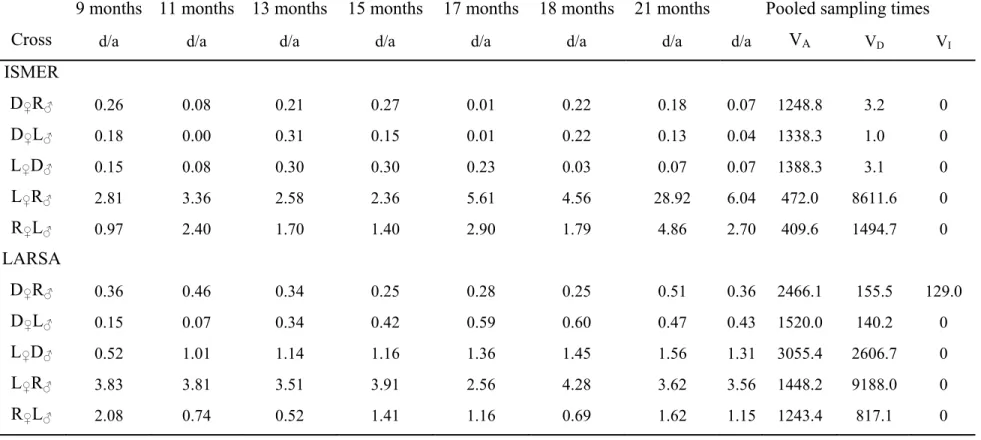
The calculated dominance ratio (d/a) revealed that hybrids expressing heterosis also had a high 291
dominance ratio and seemed therefore to be more susceptible to non-additive than to additive effects 292
(Table 5). The dominance variance (VD) was also greater in hybrids that expressed heterosis than in 293
hybrids that did not while no clear pattern emerged from the additive variance (VA) values. On the 294
other hand, the epistasis variance component was null in all hybrid crosses with the exception of the 295
D♀R♂ cross-type at LARSA. 296
297 298
Condition factor, sexual maturity and survival 299
Even though some hybrid crosses differed from parental lines at certain ages or locations, the effects of 300
hybridization on condition factor were less consistent and marked than those for mass; we thus only 301
present results for mass. The occurrence of sexual maturity varied among cross-types (P < 0.05; Fig. 1) 302
and was also greater in males than in females (P < 0.001). However, there was no significant effect of 303
rearing environment, and no significant interaction between environment, sex and cross-type on the 304
expression of early sexual maturation (df = 14; F = 0.65; P = 0.82). The percentage of early sexual 305
maturation was significantly higher in the domestic strain (more than 25%) than in the other two pure 306
crosses (less than 10% in both Laval and Rupert) (P < 0.001; Fig. 1). In hybrids, the percentage of 307
14 animals reaching early sexual maturation was intermediate (L♀D♂) or similar (all other hybrid cross-308
types) to the percentage observed in the parental line expressing the lowest percentage of sexual 309
maturation. Thus, no heterosis or outbreeding depression was observed for the occurrence of early 310
sexual maturity. Finally, survival differed among environments, and mortalities were more numerous in 311
the variable temperature environments (P < 0.05; fish farm 58 ± 32%; ISMER 7.25 ± 8.7%; LARSA 1 312
± 1.3%), but there was no cross-type effect. It is noteworthy that, at the fish farm, predation played an 313
important role in mortalities occurring in the outdoor pond. Overall then, no heterosis or outbreeding 314
depression was observed in the three environments. 315
316
Discussion 317
318
This experiment highlights the presence of heterosis for variables related to growth—i.e. mass) —in 319
brook trout using inter-strain crosses and provides no evidence for outbreeding depression. Strong 320
heterosis expression was observed in a few cases that were as high as 24% for mass in some crosses. In 321
general, however, heterosis expression levels were slightly higher or similar to those reported for the 322
same traits in chinook salmon (Oncorhynchus tshawytscha, up to 10%; Bryden et al. 2004), Nile and 323
Mphende tilapia (O. niloticus; Bentsen et al. 1998; O. shiranus; Maluwa and Gjerde 2006; 12% to 324
17%), guppy (P. reticulata, 4.5%; Nakadate et al. 2003), and carp (Labeo rohita, 10%; Gjerde et al. 325
2002 ). Also, the expression of heterosis for growth variables varied according to rearing environments 326
and to the strains involved in the cross. No evidence for heterosis was observed for sexual maturity or 327 survival. 328 329 Genetic distance 330
15 The genetic distance between strains involved in hybridization may partly explain the variable patterns 331
of heterosis being expressed (Shikano et al. 2000; Linhart et al. 2002; Wang and Xia 2002; Stelkens et 332
al. 2009). Heterosis is known to be linked to the extant of genetic differentiation between the parental 333
strains owing to local adaptations that can fix different alleles in populations (Falconer and Mackay 334
1996). Yet, some authors found no correlation between genetic distance and heterosis (Bentsen et al. 335
1998), and it was argued that the genetic diversity and dissimilarity among individuals in strains 336
(Shikano and Taniguchi 2002b) or the degree of inbreeding (Nakadate et al. 2003) would be more 337
important factors for the expression of heterosis. Here, it is noteworthy that we observed the highest 338
occurrence of heterosis in intra-specific crosses involving parental populations with the highest level of 339
genetic differentiation, that is between the Rupert and Laval strains with Fst = 0.427 (Martin et al. 340
1997). As mentioned in the Introduction, the three strains used here previously showed no sign of 341
inbreeding, suggesting that genetic divergence more than inbreeding may have been responsible in 342
explaining variable patterns of heterosis observed between the different crosses. 343
344
Cross direction 345
The cross direction also played a role in the intensity of heterosis expression for growth. This was 346
particularly evident in hybrid crosses between the Rupert and Laval strains. More generally, the extent 347
of heterosis was more pronounced when the Laval strain was used as dam than when it was used as sire 348
in hybrid crosses involving either the Rupert or the domestic strains. The importance of cross direction 349
in heterosis expression has been reported in other species for different performance traits (resistance to 350
infections in poeciliid fish, Clayton and Price 1994; growth in tilapias, Bentsen et al. 1998; swimming 351
performance in largemouth bass, Cooke et al. 2001). Different factors may explain such reciprocal 352
effects: maternal effects, paternal effects, and genetic linkage between sex genes and performance 353
genes. Maternal effects are generally involved in cross direction, but are more often observed during 354
16 the early fry development (Klupp 1979; Wangila and Dick 1996; Bentsen et al. 1998; Heath et al. 1999; 355
Perry et al. 2004; Wang et al. 2006b). Paternal effects have also been reported, but their underlying 356
genetic mechanisms are still unclear (Cheng et al. 1987; Bentsen et al. 1998; Gjerde et al. 2002; Wang 357
et al. 2006b). The genetic linkage between sex genes and genes associated with specific traits of 358
performance can result in sex-biased gene expression that may influence the predominance of a specific 359
strain as dam or sire (Nilsson 1993; Bentsen et al. 1998; Ellegren and Parsch 2007; Derome et al. 360
2008). Further investigations are needed to discriminate the influence of each of these factors on 361 heterosis expression. 362 363 Family effects 364
Within cross-types, significant family effects were present; some families expressed strong and 365
significant heterosis, while others did not (data not shown). Such differences among families have also 366
previously been observed in carp (Moav and Wohlfarth 1976), rainbow trout (Salmo gairdneri; Klupp 367
1979), and guppy (Shikano et al. 2000). However, familial variability was lowest in the L♀R♂ hybrid, 368
which constantly expressed significant heterosis, while in most other crosses, even though some 369
families expressed heterosis, there was no significant outperformance when the cross-type was 370
considered as a whole. Shikano et al. (2000) explained that such family differences could result from 371
differences in the degree of genetic differentiation among parental strains. As already demonstrated by 372
Martin et al. (1997), the Rupert and Laval strains were the most genetically distant. 373
374
Environment interaction 375
Genomic influence on performance and heterosis expression is also dependent on environmental 376
conditions. The environment may modify gene expression as previously shown for the physiological 377
pathway of growth in brook trout (Côté et al. 2007). Here, such a modification by the environment was 378
17 more important in the L♀D♂ hybrid, which expressed heterosis only in the constant temperature
379
environment. Therefore, heterosis expression in this hybrid seemed to be phenotypically plastic. Other 380
studies have reported the occurrence of heterosis modified by environment in rainbow trout 381
(Oncorhynchus mykiss; Ayles and Baker 1983), Nile tilapia (Bentsen et al. 1998) and common carp 382
(Wohlfarth 1993). It should be emphasized that the three environmentals used in this study differed in 383
many other ways, including temperature regime, indoor/outdoor environment, flow-384
through/recirculation, and tank size and type. Moreover, the limited number of samplings at the fish 385
farm may have limited our capacity to obtain detailed information about hybrid performances at this 386
site, although highly significant heterosis was also detected at this site. Also, it is difficult to identify 387
the specific rearing factors that most influence fish performances. Nevertheless, our primary objective 388
was to assess of different rearing conditions (more than deciphering the precise role of specific 389
environmental parameters) to test if some hybrids would always outperform parental strains 390
independently of the conditions. 391
392
In our study, environmental interactions were not observed for all hybrid crosses, suggesting that 393
different genomes are not influenced the same way by environmental variability and therefore revealed 394
the occurrence of genotype (strain combination) by environment interaction. Because of such 395
interactions, the phenotypes of laboratory-reared animals may not reflect the phenotypes that would 396
develop heterosis in other rearing or natural environments (Wohlfarth 1993; Fishback et al. 2002; 397
Sundstrom et al. 2007; Tymchuk et al. 2007). In the absence of an interaction between additive genetic 398
effect and environment, a given breeding program can combine the best strains into a synthetic 399
population (Eknath et al. 1993; Maluwa and Gjerde 2006; Maluwa et al. 2006). An analogous approach 400
could potentially be used in breeding programs related to heterosis expression using hybrids that 401
express heterosis in all environments tested. For example, the L♀R♂ hybrid could be a good candidate 402
18 for the application of such an approach in brook trout as it expressed heterosis in the three tested
403
rearing environments. On the other hand, in the presence of genotype–environment interactions, the 404
response to selection will be less predictable; it may then be desirable to develop strains for 405
crossbreeding that are specific to each particular environment (Gjedrem 1992). Such an approach could 406
also be adjusted in the presence of heterosis by environment interactions to take full advantage of 407
heterosis expression in aquaculture production. In our study, heterosis expression observed for the 408
L♀D♂ hybrid was sensitive to environmental conditions, and the use of such hybrids in production may 409
require that the test and the farm environments be very similar (Bentsen et al. 1998). 410
411
Variation with ontogeny 412
We observed that heterosis expression in some hybrid crosses varied over time and was influenced by 413
age or developmental stage in addition to genomic and environmental components. During ontogeny, 414
genes associated with different biological processes can be expressed differentially, and gene 415
expression can also be modified by interactions with other genes (Perry et al. 2005; Wang et al. 2006a; 416
Darias et al. 2008; Nolte et al. 2009) that would affect heterosis expression. Heterosis expression later 417
in development may also result from a larger differentiation among strains with increasing age (Klupp 418
1979; Wang et al. 2006a; Nolte et al. 2009). 419
420
The genetic basis of heterosis 421
Even though estimates of the different components of genetic variance were used in a qualitative 422
manner, they provide potential explanatory genetic mechanisms underlying the expression of heterosis. 423
For instance, these estimates point to the importance of dominance effects in the expression of heterosis 424
rather than additive or epistasis effects. This is in accordance with the dominance hypothesis of 425
heterosis expression (Hochholdinger and Hoecker 2007). A previous study of gene expression during 426
19 early growth, which used the same hybrid crosses as in this study, revealed that gene expression in 427
hybrid crosses was highly dependent on the specific genetic architecture of parental lines with a 428
prevalence of dominance in heterosis expression. Thus, Bougas et al. (2010) compared transcription 429
profiles among the same three populations of brook charr and their hybrids using microarrays to assess 430
the influence of hybrid origin on modes of transcription regulation inheritance and on the mechanisms 431
underlying growth. They found that hybrids exhibited strikingly different patterns of mode of 432
transcription regulation, being mostly additive (94%) for domestic, and nonadditive for the Laval 433
(45.7%) and Rupert-Laval hybrids (37.5%). Their results also indicated that prevalence of dominance 434
in transcription regulation was related to growth heterosis. In fact, the study of Bougas et al. (2010) 435
clearly showed, for the first time in vertebrates, that the consequences of hybridization on both the 436
transcriptome level and the phenotype are highly dependent on the specific genetic architectures of 437
crossed populations and therefore hardly predictable. As such the parallelism in patterns of heterosis 438
observed here for growth and in Bougas et al. (2010) at the transcriptome level is quite striking. 439
440 441
Conclusion 442
Intra-specific heterosis is present in brook trout. However, its expression seems complex and difficult 443
to predict, being influenced by a variety of biotic and abiotic factors, including genetic distance 444
between parental lines, strain combination, cross direction, and developmental stage as well as rearing 445
environment. However, one hybrid cross, L♀R♂, stood out as the best candidate for using heterosis to 446
enhance brook trout production in various types of environments. Further studies combining the 447
analysis of gene expression and quantitative genetics performed in both F1 hybrids and backcrosses 448
should provide a better understanding of the mechanisms underlying heterosis in fish. 449
20 Acknowledgements
451
The authors would like to thank D. Lavallée, S. Higgins and his staff at LARSA, J.C. Therrien, N. 452
Morin, S. Granier, B. Bougas, J. St-Laurent, F. Lamaze, A. Picard, and A. Mainguy for their help with 453
sampling and technical assistance. Many thanks to Pisciculture de la Jacques Cartier and P. East for 454
fish rearing and help with fish capture. This work was supported by a strategic research grant from the 455
Natural Science and Engineering Research Council (NSERC) of Canada and by funding from the 456
Réseau Aquaculture Québec (RAQ). 457 458 459 460 References 461
Ayles, G. B. and R. F. Baker. 1983. Genetic differences in growth and survival between strains and 462
hybrids of rainbow trout (Salmo gairdneri) stocked in aquaculture lakes in the Canadian 463
prairies. Aquaculture 33:269-280. 464
Bentsen, H. B., A. E. Eknath, M. S. Palada-de Vera, J. C. Danting, H. L. Bolivar, R. A. Reyes, E. E. 465
Dionisio, F. M. Longalong, A. V. Circa, M. M. Tayamen and B. Gjerde. 1998. Genetic 466
improvement of farmed tilapias: growth performance in a complete diallel cross experiment 467
with eight strains of Oreochromis niloticus. Aquaculture 160:145-173. 468
Birchler, J. A., D. L. Auger and N. C. Riddle. 2003. In search of the molecular basis of heterosis. The 469
Plant Cell 15:2236-2239. 470
Bougas, B., S. Granier, C. Audet and L. Bernatchez. 2010. The transcriptional landscape of cross-471
specific hybrids and its possible link with growth in brook charr (Salvelinus fontinalis Mitchill). 472
Genetics 186:97-107. 473
21 Bryden, C. A., J. W. Heath and D. D. Heath. 2004. Performance and heterosis in farmed and wild 474
Chinook salmon (Oncorhynchus tshawyacha) hybrid and purebred crosses. Aquaculture 475
235:249-261. 476
Cheng, K. M., I. M. McCallum, R. I. McKay and B. E. March. 1987. A comparison of survival and 477
growth of two strains of chinook salmon (Oncorhynchus tshawytscha) and their crosses reared 478
in confinement. Aquaculture 67:301-311. 479
Clayton, G. M. and D. J. Price. 1994. Heterosis in resistance to Ichthyophthirius multifiliis infections in 480
poeciliid fish. Journal of Fish Biology 44:59-66. 481
Comings, D. E. and J. P. MacMurray. 2000. Molecular heterosis: A review. Molecular Genetics and 482
Metabolism 71:19-31. 483
Cooke, S. J., T. W. Kassler and D. P. Phillipp. 2001. Physiological performance of largemouth bass 484
related to local adaptation and interstock hybridization: implications for conservation and 485
management. Journal of Fish Biology 59:248-268. 486
Côté, G., G. Perry, P. Blier and L. Bernatchez. 2007. The influence of gene-environment interactions 487
on GHR and IGF-I expression and their association with growth in brook charr, Salvelinus 488
fontinalis (Mitchill). BMC Genetics 8:87. 489
Darias, M. J., J. L. Zambonino-Infante, K. Hugot, C. L. Cahu and D. Mazurais. 2008. Gene expression 490
patterns during the larval development of European sea bass (dicentrarchus labrax) by 491
microarray analysis. Marine Biotechnology (NY) 10:416-28. 492
Derome, N., B. Bougas, S. M. Rogers, A. R. Whiteley, A. Labbe, J. Laroche and L. Bernatchez. 2008. 493
Pervasive sex-linked effects on transcription regulation as revealed by expression quantitative 494
trait loci mapping in lake whitefish species pairs (Coregonus sp., Salmonidae). Genetics 495
179:1903-1917. 496
22 Edmands, S. 2007. Between a rock and a hard place: evaluating the relative risks of inbreeding and 497
outbreeding for conservation and management. Molecular Ecology 16:463-475. 498
Einum, S. and I. A. Fleming. 1997. Genetic divergence and interactions in the wild among native, 499
farmed and hybrid Atlantic salmon. Journal of Fish Biology 50:634-651. 500
Eknath, A. E., M. M. Tayamen, M. S. Paladadevera, J. C. Danting, R. A. Reyes, E. E. Dionisio, J. B. 501
Capili, H. L. Bolivar, T. A. Abella, A. V. Circa, H. B. Bentsen, B. Gjerde, T. Gjedrem and R. S. 502
V. Pullin. 1993. Genetic-improvement of farmed tilapias - the growth-performance of 8 strains 503
of Oreochromis niloticus tested in different farm environments. Aquaculture 111:171-188. 504
Ellegren, H. and J. Parsch. 2007. The evolution of sex-biased genes and sex-biased gene expression. 505
Nature Reviews Genetics 8:689-698. 506
Falconer, D. S. and T. F. C. Mackay. 1996. Introduction to quantitative genetics, 4th edition. Longman 507
Group, Essex, UK. 508
Fishback, A. G., R. G. Danzmann, M. M. Ferguson and J. P. Gibson. 2002. Estimates of genetic 509
parameters and genotype by environment interactions for growth traits of rainbow trout 510
(Oncorhynchus mykiss) as inferred using molecular pedigrees. Aquaculture 206:137-150. 511
Fraser, J. M. 1981. Comparative survival and growth of planted wild, hybrid, and domestic strains of 512
brook trout (Salvelinus fontinalis) in Ontario lakes. Canadian Journal of Fisheries and Aquatic 513
Sciences 38:1672-1684. 514
Garcia de Leaniz, C., I. A. Fleming, S. Einum, E. Verspoor, W. C. Jordan, S. Consuegra, N. Aubin-515
Horth, D. Lajus, B. H. Letcher, A. F. Youngson, J. H. Webb, L. A. Vollestad, B. Villanueva, A. 516
Ferguson and T. P. Quinn. 2007. A critical review of adaptive genetic variation in Atlantic 517
salmon: implications for conservation. Biological Reviews 82:173-211. 518
Gharrett, A. J., W. W. Smoker, R. R. Reisenbichler and S. G. Taylor. 1999. Outbreeding depression in 519
hybrids between odd- and even-broodyear pink salmon. Aquaculture 173:117-129. 520
23 Gjedrem, T. 1992. Breeding plans for rainbow trout. Aquaculture 100:73-83.
521
Gjerde, B., P. V. G. K. Reddy, K. D. Mahapatra, J. N. Saha, R. K. Jana, P. K. Meher, M. Sahoo, S. 522
Lenka, P. Govindassamy and M. Rye. 2002. Growth and survival in two complete diallele 523
crosses with five stocks of Rohu carp (Labeo rohita). Aquaculture 209:103-115. 524
Gjerde, B. and T. Refstie. 1984. Complete diallel cross between five strains of Atlantic salmon. 525
Livestock Production Science 11:207-226. 526
Glover, K. A., O. Bergh, H. Rudra and O. Skaala. 2006. Juvenile growth and susceptibility to 527
Aeromonas salmonicida subsp salmonicida in Atlantic salmon (Salmo salar L.) of farmed, 528
hybrid and wild parentage. Aquaculture 254:72-81. 529
Heath, D. D., C. W. Fox and J. W. Heath. 1999. Maternal effects on offspring size: variation through 530
early development of chinook salmon. Evolution 53:1605-1611. 531
Hochholdinger, F. and N. Hoecker. 2007. Towards the molecular basis of heterosis. Trends in Plant 532
Science 12:427-432. 533
Hoffmann, A. A. and J. Merilä. 1999. Heritable variation and evolution under favourable and 534
unfavourable conditions. Trends in Ecology & Evolution 14:96-101. 535
Hulata, G. 1995. A review of genetic improvement of the common carp (Cyprinus carpio L) and other 536
cyprinids by crossbreeding, hybridization and selection. Aquaculture 129:143-155. 537
Klupp, R. 1979. Genetic variance for growth in rainbow trout (Salmo gairdneri) Aquaculture 18:123-538
134. 539
Linhart, O., D. Gela, M. Rodina, V. Slechtova and V. Slechta. 2002. Top-crossing with paternal 540
inheritance testing of common carp (Cyprinus carpio L.) progeny under two altitude conditions. 541
Aquaculture 204:481-491. 542
Lippman, Z. B. and D. Zamir. 2007. Heterosis: revisiting the magic. Trends in Genetics 23:60-66. 543
24 Maluwa, A. O. and B. Gjerde. 2006. Genetic evaluation of four strains of Oreochromis shiranus for 544
harvest body weight in a diallel cross. Aquaculture 259:28-37. 545
Maluwa, A. O., B. Gjerde and R. W. Ponzoni. 2006. Genetic parameters and genotype by environment 546
interaction for body weight of Oreochromis shiranus. Aquaculture 259:47-55. 547
Marengoni, N. G., Y. Onoue and T. Oyama. 1998. Offspring growth in a diallel crossbreeding with 548
three strains of Nile tilapia Oreochromis niloticus. Journal of the World Aquaculture Society 549
29:114-119. 550
Martin, S., J.-Y. Savaria, C. Audet and L. Bernatchez. 1997. Microsatellites reveal no evidence for 551
inbreeding effects but low inter-stock genetic diversity among brook charr stocks used for 552
production in Quebec. Bulletin of the Aquaculture Association of Canada 97:21-23. 553
McClelland, E. K. and K. A. Naish. 2007. What is the fitness outcome of crossing unrelated fish 554
populations? A meta-analysis and an evaluation of future research directions. Conservation 555
Genetics 8:397-416. 556
Moav, R. and G. W. Wohlfarth. 1976. Two-way selection for growth rate in the common carp 557
(Cyprinus carpio L.). Genetics 82:83-101. 558
Nakadate, M., T. Shikano and N. Taniguchi. 2003. Inbreeding depression and heterosis in various 559
quantitative traits of the guppy, Poecilia reticulata. Aquaculture 220:219-226. 560
Nielsen, H. M., J. Odegard, I. Olesen, B. Gjerde, L. Ardo, G. Jeney and Z. Jeney. 2010. Genetic 561
analysis of common carp (Cyprinus carpio) strains. I: Genetis parameters and heterosis for 562
growth traits and survival. Aquaculture 304:7-13. 563
Nilsson, J. 1993. Arctic charr strain crosses - effects on growth and sexual maturity. Journal of Fish 564
Biology 43:163-171. 565
25 Nolte, A. W., S. Renaut and L. Bernatchez. 2009. Divergence in gene regulation at young life history 566
stages of whitefish (Coregonus sp.) and the emergence of genomic isolation. BMC 567
Evolutionary Biology 9:59. 568
Perry, G. M. L., C. Audet and L. Bernatchez. 2005. Maternal genetic effects on adaptive divergence 569
between anadromous and resident brook charr during early life history. Journal of Evolutionary 570
Biology 18:1348-1361. 571
Perry, G. M. L., C. Audet, B. Laplatte and L. Bernatchez. 2004. Shifting patterns in genetic control at 572
the embryo-alevin boundary in brook charr. Evolution 58:2002-2012. 573
Shikano, T., M. Nakadate and Y. Fujio. 2000. An experimental study on strain combinations in 574
heterosis in salinity tolerance of the guppy Poecilia reticulata. Fisheries Science 66:625-632. 575
Shikano, T. and N. Taniguchi. 2002a. Heterosis for neonatal survival in the guppy. Journal of Fish 576
Biology 60:715-725. 577
Shikano, T. and N. Taniguchi. 2002b. Using microsatellite and RAPD markers to estimate the amount 578
of heterosis in various strain combinations in the guppy (Poecilia reticulata) as a fish model. 579
Aquaculture 204:271-281. 580
Sogard, S. M. 1997. Size-selective mortality in the juvenile stage of teleost fishes: a review. Bulletin of 581
Marine Science 60:1129-1157. 582
Sokal, R. R. and F. J. Rohlf. 1981. Biometry: the principles and practice of statistics in biological 583
research, 2nd edition. W H Freeman, San francisco, USA. 584
Stelkens, R. B., C. Schmid, O. Selz and O. Seehausen. 2009. Phenotypic novelty in experimental 585
hybrids is predicted by the genetic distance between species of cichlid fish. BMC Evolutionary 586
Biology 9:283. 587
26 Sundstrom, L. F., M. Lohmuis, W. E. Tymchuk and R. H. Devlin. 2007. Gene-environment interactions 588
influence ecological consequences of transgenic animals. Proceedings of the National Academy 589
of Sciences of the United States of America 104:3889-3894. 590
Thériault, V., D. Garant, L. Bernatchez and J. J. Dodson. 2007. Heritability of life-history tactics and 591
genetic correlation with body size in a natural population of brook charr (Salvelinus fontinalis). 592
Journal of Evolutionary Biology 20:2266-2277. 593
Tymchuk, W. E., L. F. Sundstrom and R. H. Devlin. 2007. Growth and survival trade-offs and 594
outbreeding depression in rainbow trout (Oncorhynchus mykiss). Evolution 61:1225-1237. 595
Wang, C. H., S. F. Li, Z. G. Liu, S. P. Xiang, J. Wang, Z. Y. Pang and J. P. Duan. 2006a. 596
Developmental quantitative genetic analysis of body weight and morphological traits in red 597
common carp, Cyprinus carpio L. Aquaculture 251:219-230. 598
Wang, I. A., S. E. Gilk, W. W. Smoker and A. J. Gharrett. 2007. Outbreeding effect on embryo 599
development in hybrids of allopatric pink salmon (Oncorhynchus gorbuscha) populations, a 600
potential consequence of stock translocation. Aquaculture 272:S152-S160. 601
Wang, J. and D. Xia. 2002. Studies on fish heterosis with DNA fingerprinting. Aquaculture Research 602
33:941-947. 603
Wang, X. X., K. E. Ross, E. Saillant, D. M. Gatlin and J. R. Gold. 2006b. Quantitative genetics and 604
heritability of growth-related traits in hybrid striped bass (Morone chrysops female x Morone 605
saxatilis male). Aquaculture 261:535-545. 606
Wangila, B. C. C. and T. A. Dick. 1996. Genetic effects and growth performance in pure and hybrid 607
strains of rainbow trout, Oncorhynchus mykiss (Walbaum) (Order: Salmoniformes, Family: 608
Salmonidae). Aquaculture Research 27:35-41. 609
27 Webster, D. A. and W. A. Flick. 1981. Performance of indigenous, exotic, and hybrid strains of brook 610
trout (Salvelinus fontinalis) in waters of the Adirondack Mountains, New York. Canadian 611
Journal of Fisheries and Aquatic Sciences 38:1701-1707. 612
Wilson, A. J., J. A. Hutchings and M. M. Ferguson. 2003. Selective and genetic constraints on the 613
evolution of body size in a stream-dwelling salmonid fish. Journal of Evolutionary Biology 614
16:584-594. 615
Wohlfarth, G. W. 1993. Heterosis for growth-rate in common carp. Aquaculture 113:31-46. 616
Wu, Z. X. and M. D. Li. 2002. Analysis of heterosis by a direct method using the concept of 617
heritability. Genetica 114:163-170. 618
619 620
28 Figure Caption
621 622
Fig. 1: Early maturation in the three purebred strains and their hybrids. No environment effect was 623
observed, so data from the three study sites were pooled. The first letter of the cross-type indicates the 624
dam and the second letter the sire. Solid bars are for females and open bars for males. Statistical 625
analyses were done on arcsin-transformed data but results are presented as arithmetical means ± SE. 626
Number of families (n) is indicated in parenthesis. Cross-types with different letters are significantly 627
different (P < 0.05). 628
Table 1: Number of fish per family in the different rearing environments (indoor, running freshwater, seasonal temperature variations 1
[ISMER]; indoor, recirculating water, constant 10°C temperature conditions [LARSA]) for each age stage. Percentages refer to the 2
reduction in fish number compared to the initial number. 3
Environment 7 months 9 months 11 months 13 months 15 months 17 months 18 months 21 months ISMER 230 230 190 (-17%) 120(-48%) 120 (-48%) 110(-52%) 60 (-74%) 60 (-74%) LARSA 150 150 150 150 100 (-33%) 100 (-33%) 50 (-67%) 50 (-67%) 4
Table 2: Summary of statistical analyses for body mass. Model A includes two environments (indoor, running freshwater, seasonal 1
temperature variations [ISMER]; indoor, recirculating water, constant 10°C temperature conditions [LARSA]) at each age stage; 2
Model B includes the three environments (ISMER; LARSA; outdoor, seasonal temperature variations, fish farm pond [Farm]) at the 3
two age stages (17 and 21 months) measured at the farm. 4 Model A Model B df mean squares F P-value df mean squares F P-value Age stage 6 444.18 12,635.9 < 0.001 1 135.91 3,320.5 < 0.001 Environment 1 591.98 16,840.5 < 0.001 2 102.24 2,497.9 < 0.001 Cross-type 7 92.20 34.4 < 0.001 7 14.29 349.2 < 0.001
Age stage × Environment 6 21.28 605.4 < 0.001 2 16.74 409.0 < 0.001 Age stage × Cross-type 42 0.49 13.9 < 0.001 7 0.05 1.2 0.28 Environment × Cross-type 7 6.48 184.4 < 0.001 14 2.21 54.0 < 0.001 Age stage × Environment × Cross-type 42 0.33 9.5 < 0.001 14 0.18 4.3 < 0.001 Family (nested in Cross-type), random 64 2.93 83.3 < 0.001
Error 28,022 0.04 11,587 0.04
Model R2 0.82 0.64
R2 adjusted 0.82 0.64
Table 3: Growth performance measured as body mass (g) in the purebred strains (bold) and their hybrids in the three different 1
environments (indoor, running freshwater, seasonal temperature variations [ISMER]; indoor, recirculating water, constant 10°C 2
temperature conditions [LARSA]; outdoor, seasonal temperature variations, fish farm pond [Farm]) for each age stage. Statistical 3
analyses were done on log-transformed data, and post-hoc analyses on least square means, but results are presented as arithmetical 4
means ± SE (n [number of families] = 10 for D♀D♂, L♀L♂, and L♀R♂; 9 for R♀R♂, D♀R♂, and L♀D♂; 8 for R♀L♂; and 7 for D♀L♂).
5
Different letters indicate significant differences among cross-types for one environment and one age stage (P < 0.05). Grey highlights 6
indicate hybrids that are significantly higher than both of their parental lines (heterosis). 7
Cross 9 months 11 months 13 months 15 months 17 months 18 months 21 months ISMER D♀R♂ 18.4 ± 1.2 w 25.1 ± 1.7 w 25.8 ± 2.2 w 34.2 ± 3.0 x 42.5 ± 4.2 v 58.7 ± 4.3 x 121.7 ± 6.7 x D♀D♂ 23.6 ± 2.2 v 39.7 ± 3.7 v 34.6 ± 3.6 v 45.2 ± 4.6 w 65.1 ± 6.7 u 100.5 ± 8.2 w 197.6 ± 11.9 w D♀L♂ 16.7 ± 1.0 w 24.5 ± 1.4 w 25.3 ± 1.7 w 29.6 ± 2.2 x 41.0 ± 1.9 v 60.6 ± 3.5 x 124.3 ± 6.4 x L♀D♂ 16.4 ± 1.1 w 25.6 ± 1.9 w 25.2 ± 1.8 w 32.3± 2.6 x 46.2 ± 3.5 v 66.9 ± 4.5 x 128.8 ± 5.2 x L♀L♂ 6.8 ± 0.2 z 9.1 ± 0.4 z 7.9 ± 0.3 z 8.4 ± 0.3 z 16.2 ± 0.5 z 35.3 ± 1.4 z 68.8 ± 2.1 z L♀R♂ 11.9 ± 0.9 x 16.7 ± 1.7 x 16.2 ± 1.8 x 19.2 ± 2.2 x 29.2 ± 2.3 w 41.6 ± 2.7 y 83.2 ± 4.2 y R♀L♂ 9.3 ± 0.6 y 15.0 ± 0.9 yx 14.2 ± 1.2 y 16.1 ± 1.4 y 23.9 ± 2.1 x 36.8 ± 3.7 zy 71.8 ± 6.0 z R♀R♂ 9.5 ± 0.6 y 12.6 ± 0.8 y 12.6 ± 0.8 y 14.8 ± 0.8 y 20.1 ± 1.3 y 31.5 ± 2.0 z 66.9 ± 4.5 z LARSA
D♀R♂ 23.5 ± 1.8 wv 43.0 ± 4.0 wv 69.0 ± 7.2 v 88.9 ± 11.0 w 103.7 ± 11.9 x 123.4 ± 13.5 x 183.8 ± 20.1 w D♀D♂ 29.0 ± 3.0 v 50.1 ± 4.7 v 82.4 ± 6.4 vu 109.6 ± 10.8 v 121.5 ± 10.2 w 148.0 ± 12.5 w 217.6 ± 15.5 v D♀L♂ 20.7 ± 1.4 w 33.4 ± 2.2 x 47.5 ± 3.4 xw 62.6 ± 4.1 yx 68.7 ± 3.3 y 83.3 ± 4.0 y 134.1 ± 7.4 y L♀D♂ 24.3 ± 1.9 wv 50.3 ± 4.9 v 86.0 ± 9.9 u 114.9 ± 14.3 u 133.6 ± 16.1 v 165.1 ± 21.4 v 241.1 ± 27.3 u L♀L♂ 9.4 ± 0.5 z 18.8 ± 1.4 z 30.4 ± 2.7 z 43.1 ± 3.0 z 54.8 ± 4.1 z 67.1 ± 4.6 z 106.3 ± 6.4 z L♀R♂ 15.3 ± 0.9 x 30.5 ± 2.6 x 56.2 ± 5.4 w 70.5 ± 4.6 x 85.5 ± 7.8 x 107.1 ± 9.2 x 155.7 ± 9.7 x R♀L♂ 13.2 ± 0.9 yx 23.0 ± 2.1 y 39.1 ± 4.3 y 56.6 ± 5.8 y 73.5 ± 7.6 yx 79.9 ± 7.5 zy 129.7 ± 12.9 y R♀R♂ 11.8 ± 0.8 y 23.6 ± 1.3 y 41.9 ± 2.2 yx 54.7 ± 2.0 y 72.1 ± 3.2 y 82.3 ± 4.5 y 126.9 ± 7.7 y Farm D♀R♂ 46.0 ± 3.0 w 125.6 ± 4.8 v D♀D♂ 87.4 ± 7.4 v 199.8 ± 13.1 wv D♀L♂ 43.7 ± 1.8 xw 117.9 ± 3.9 xw L♀D♂ 35.8 ± 2.3 xw 97.8 ± 2.6 w L♀L♂ 16.6 ± 0.8 z 39.4 ± 2.2 z L♀R♂ 29.8 ± 3.4 y 67.6 ± 4.7 y R♀L♂ 36.6 ± 5.3 yx 97.8 ± 4.4 yx R♀R♂ 16.0 ± 1.4 z 35.1 ± 8.6 z 8
Table 4: Heterosis intensity for each cross presenting a trait performance significantly higher than the performance of its two parental 1
lines in the three environments (indoor, running freshwater, seasonal temperature variations [ISMER]; indoor, recirculating water, 2
constant 10°C temperature conditions [LARSA]; outdoor, seasonal temperature variations, fish farm pond [Farm]), and for each age 3
stage. Heterosis intensity was calculated as [(f1/m) - 1] × 100, where f1 is the mean performance of the F1 hybrids and m the mean
4
performance of parental strains. Mean ± SE. 5
9 months 11 months 13 months 15 months 17 months 18 months 21 months Cross ISMER L♀R♂ 18.5 ± 3.9 17.0 ± 4.5 19.0 ± 5.3 20.3 ± 5.0 16.1 ± 2.7 6.1 ± 1.8 4.9 ± 1.1 R♀L♂ 9.2 ± 3.0 LARSA L♀D♂ 11.7± 2.7 10.7 ± 2.6 10.3 ± 2.7 8.7 ± 2.1 L♀R♂ 16.4 ± 2.5 11.8 ± 3.0 12.3 ± 3.1 9.6 ± 1.8 7.0 ± 2.4 8.2 ± 2.1 6.2 ± 1.4 Farm L♀R♂ 18.1 ± 3.7 16.5± 1.8 R♀L♂ 23.8 ± 4.2 22.8 ± 1.2 6
Table 5: Dominance ratio (d/a) at each age stage and contribution of the different genetic components (VA: additive variance; VD:
1
dominance variance; VI: epistasis variance) to the phenotypic variance (Wu et al. 2002) expressed in each cross-type and in two
2
different environments (indoor, running freshwater, seasonal temperature variations [ISMER]; indoor, recirculating water, constant 3
10°C temperature conditions [LARSA]). Negative values were defined to be equal to zero. 4
9 months 11 months 13 months 15 months 17 months 18 months 21 months Pooled sampling times
Cross d/a d/a d/a d/a d/a d/a d/a d/a VA VD VI
ISMER D♀R♂ 0.26 0.08 0.21 0.27 0.01 0.22 0.18 0.07 1248.8 3.2 0 D♀L♂ 0.18 0.00 0.31 0.15 0.01 0.22 0.13 0.04 1338.3 1.0 0 L♀D♂ 0.15 0.08 0.30 0.30 0.23 0.03 0.07 0.07 1388.3 3.1 0 L♀R♂ 2.81 3.36 2.58 2.36 5.61 4.56 28.92 6.04 472.0 8611.6 0 R♀L♂ 0.97 2.40 1.70 1.40 2.90 1.79 4.86 2.70 409.6 1494.7 0 LARSA D♀R♂ 0.36 0.46 0.34 0.25 0.28 0.25 0.51 0.36 2466.1 155.5 129.0 D♀L♂ 0.15 0.07 0.34 0.42 0.59 0.60 0.47 0.43 1520.0 140.2 0 L♀D♂ 0.52 1.01 1.14 1.16 1.36 1.45 1.56 1.31 3055.4 2606.7 0 L♀R♂ 3.83 3.81 3.51 3.91 2.56 4.28 3.62 3.56 1448.2 9188.0 0 R♀L♂ 2.08 0.74 0.52 1.41 1.16 0.69 1.62 1.15 1243.4 817.1 0 5
DD DL DR LD LL LR RL RR Cross-type 0 5 10 15 20 25 30 35 40 45 50 P er cen tag e of early matu ratio n y zy zy zy z zy zy x (38) (32) (42) (40) (38) (34) (30) (38)