HAL Id: hal-02318394
https://hal.archives-ouvertes.fr/hal-02318394
Preprint submitted on 17 Oct 2019HAL is a multi-disciplinary open access archive for the deposit and dissemination of sci-entific research documents, whether they are pub-lished or not. The documents may come from teaching and research institutions in France or abroad, or from public or private research centers.
L’archive ouverte pluridisciplinaire HAL, est destinée au dépôt et à la diffusion de documents scientifiques de niveau recherche, publiés ou non, émanant des établissements d’enseignement et de recherche français ou étrangers, des laboratoires publics ou privés.
In Situ Magnetic Resonance Imaging of a Complete
Supercapacitor Giving Additional Insight on the Role of
Nanopores
Ghenima Oukali, Elodie Salager, Mohamed Ammar, Charles-Emmanuel
Dutoit, Vincent Sarou-Kanian, Patrice Simon, Raymundo-Piñero
Encarnacion, Michaël Deschamps
To cite this version:
Ghenima Oukali, Elodie Salager, Mohamed Ammar, Charles-Emmanuel Dutoit, Vincent Sarou-Kanian, et al.. In Situ Magnetic Resonance Imaging of a Complete Supercapacitor Giving Additional Insight on the Role of Nanopores. 2019. �hal-02318394�
In Situ Magnetic Resonance Imaging of a Complete
Supercapacitor Giving Additional Insight on the
Role of Nanopores
Ghenima Oukali,†,‡ Elodie Salager,†,‡,* Mohamed Ramzi Ammar,‡ Charles-Emmanuel Dutoit,†,‡
Vincent Sarou-Kanian,†,‡ Patrice Simon,†,|| Encarnacion Raymundo-Piñero,†,‡,* Michaël
Deschamps†,‡,*
† Réseau sur le Stockage Électrochimique de l’Énergie (RS2E), CNRS FR3459, 33 rue Saint Leu,
80039 Amiens, France
‡ CNRS, CEMHTI UPR3079, Orléans University, 1D avenue de la recherche scientifique, 45071
Orléans Cedex 2, France
|| Université Paul Sabatier, CIRIMAT UMR CNRS 5085, 118 route de Narbonne, 31062
Abstract
Nuclear Magnetic Resonance (NMR) is one of the rare techniques able to probe selectively the
ions inside the nanoporous network in supercapacitor devices. With a magnetic resonance imaging
method able to detect all ions (adsorbed and non-adsorbed), we record one-dimensional
concentration profiles of the active ions in supercapacitors with an electrode configuration close
to that used in industry. Larger anionic concentration changes are probed upon charge and
discharge in a Carbide-Derived Carbon (CDC) with micropores below 1 nm compared to a
conventional nanoporous carbon (CC) with a larger distribution of pore sizes, up to 2 nm. They
highlight the increased interaction of the anions with CDC and provide a better understanding of
the enhanced capacitance in CDC-based supercapacitors.
Keywords: supercapacitor, nanopore, carbon, nuclear magnetic resonance, magnetic resonance
The progression towards all-electric devices calls for ever-improving energy storage systems.
Among them, carbon-based supercapacitors (Electrochemical Double Layer Capacitors) with
organic electrolytes are emerging as powerful energy-saving devices with their extremely long
cycle life and large specific powers.1 The supercapacitor’s energy storage mechanism relies on the
electrostatic attraction between the electronic charges stored on a nanoporous material and the
counter-ions of opposite charge in the electrolyte. The observation2,3 of a large anomalous increase
of the capacity for pore sizes smaller than 1 nm raised a lot of questions about the interactions
between electronic charges, ions and solvent molecules inside the nanoporous network, but also
about the influence of the active material structure in the adsorption and accommodation of ions
and electronic charges. The full understanding of the electrolyte structure at the
electrode/electrolyte interface is essential to achieve optimal performances.
Few experimental techniques are suitable for the characterization of a full supercapacitor device,
such as those used on a commercial scale. Among them, electrochemical Quartz Crystal
Microbalance measurements provide in situ ionic fluxes and dynamics in electrodes under
polarization.4,5 Nuclear Magnetic Resonance spectroscopy (NMR) is one of the rare techniques
capable of detecting selectively one species in the electrolyte to provide relative concentrations of
adsorbed species, information on the local environment or self-diffusion coefficients.6–9
Results and discussion
Ex situ solid-state NMR and exchange experiments10 on nanoporous carbon electrodes charged
in tetraethylammonium tetrafluoroborate in acetonitrile showed that the charging mechanism is
based on ion exchanges at the positive and negative electrodes, where the counter-ion
supercapacitor disassembly before each measurement leads to partial evaporation, which could
distort the electrolyte structure. In situ experiments are needed to probe the functioning device, but
the signal of the two electrodes are overlapping in conventional NMR spectra. Spectra of
individual electrodes can be recorded in situ using a shifted bagcell design with overlaid current
collectors, so that a single electrode is inside the detection coil.11,12 However, this design leads to
degraded electrochemical performances mainly due to ohmic losses and transport issues (Figure
S1 and S2).
Figure 1. (a) In situ electrochemical cell containing the supercapacitor (5 mm diameter, 600 µm
thickness once assembled). (b) Vertical 19F spin density profile obtained from the 19F NMR
signal of the electrolyte.
The combination of NMR spectroscopy and Magnetic Resonance Imaging (MRI) techniques
with the classical Chemical Shift Imaging (CSI) experiment appears as desirable to monitor
changes operando in each electrode of a supercapacitor while maintaining good electrochemical
performances.13 The main issue with CSI experiments lies in the long echo time (> 1 ms) which
Current collector
Current collector Positive electrode Negative electrodeseparator
Supercapacitor O-ring Al current collector O-rings Al current collector z B0 Bgrad a b Δν Δz Concentration profile
leads to signal loss from fast transverse relaxation. In this communication, we opt for a MRI
method dedicated to ultra-short transverse relaxation times for the in situ study of a fully
functioning supercapacitor, and we explore the effects of the carbon texture at the nanometer scale
on the ion flux and charging mechanism by comparing a conventional nanoporous carbon and a
Carbide-Derived Carbon (CDC). The 1D concentration profiles along the vertical axis are recorded
and the relative variations in the concentration of the electrolyte ions can be compared, as the only
experimental parameters that are changed are the carbon nature and the applied voltage (Figure 1).
It must be noted that quantitative measurements are difficult to achieve in NMR, as fast relaxation
issues with paramagnetic centers, internal gradients, changes in dielectric properties may lead to
signal losses.
The better approach to overcome the signal loss due to short transverse relaxation (T2 < 100’s
µs) consists in acquiring points in the k-space as soon as possible, i.e. just after magnetization has
been flipped in the transverse plane.14–16 Experimentally, a short excitation pulse is applied with
the gradient already switched on (Figure S5). The 1H and 19F NMR spectra spread over 5 kHz, so
that strong magnetic pulsed field gradients are needed to achieve a relevant spatial resolution. The
1D concentration profile of the electrolyte in the supercapacitor is recorded with a spatial
resolution of 70 µm using commercially available strong uniaxial pulsed magnetic field gradient
systems (180 G/cm). However, the presence of the strong gradient does not allow us to distinguish
adsorbed versus non adsorbed species from the chemical shifts. We assume that far away from the
electronic charges carried by the porous carbon, outside the porosity, the concentration should
remain stable and homogeneous after a few minutes and over the duration of our experiments (i.e.
are observing results from the charge compensation phenomena inside the porosity, modifying the
electrolyte structure at the nanometer scale.
Supercapacitors were tested with two carbons: the first, (CC), is a commercially available
nanoporous carbon and the second one (CDC) is a carbon derived from titanium carbide.2 The
structural organization of the CC is slightly higher than CDC from Raman spectroscopy (Figure
S3). Importantly, the micropore size distribution is reaching 2 nm for CC, whereas CDC features
mainly micropores under 1 nm (Figure S4 and Table S1). As expected, the supercapacitor made
with CDC displays a capacitance of about 125 F/g (25% increase from CC).
All electrodes are prepared by spreading a paste of nanoporous carbon powder (85 w%),
polytetrafluoroethylene (PTFE) binder (10 w%) and carbon black (5 w%). The 5 mm diameter,
170 µm-thick electrodes are punched out and assembled with two 200 µm-thick glass fiber
separators in an electrochemical cell suitable for NMR measurements17 and soaked with organic
electrolyte: a 1 mol.L-1 solution of tetraethylammonium tetrafluoroborate (TEA+;BF 4-) in
deuterated acetonitrile. We followed the modifications of the cationic (1H) and anionic (19F)
concentration profiles during charge and discharge. In both cases, a concentration profile was
recorded with no applied voltage (open-circuit voltage -OCV- conditions) for an overview of the
initial distribution of ions. Then, the supercapacitor was charged to 2.5 V and maintained at that
voltage for the duration of a second measurement of the concentration profile (2-3 hours). The
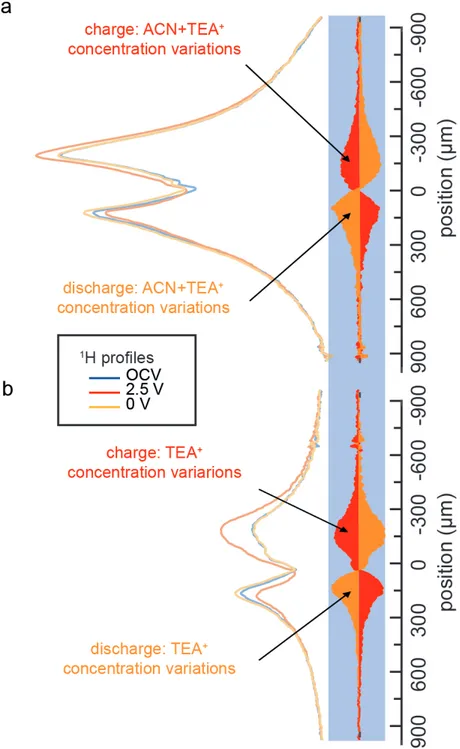
Figure 2. 1H (a,c) and 19F (b,d) 1D concentration profiles of a supercapacitor made of a
conventional carbon (CC) (a,b) and CDC (c,d), during OCV before charging and at 2.5 V. The
profiles of the concentration changes on charge (between 2.5 V and OCV) are displayed on the
right of the profiles as filled red curves.
The concentration profiles for OCV and 2.5 V (Figure 2) contain contributions from the
electrolyte species (TEA+ or BF
4-) inside the electrodes and the separator and from residues on the
cell walls and the current collectors. There is also a small broad signal from the PTFE binder and
the Kel-F polymer (PCTFE or polychlorotrifluoroethylene) of the cell in 19F profiles, or from
solvent was never detected in these 1H profiles. The variations in TEA+ and BF
4- concentrations
are visualized by subtracting the profiles and are displayed as filled red curves on the right of each
profile in Figure 2, using the same scale (see SI for the definition of the scale). This procedure also
removes the undesired contributions, which are expected to remain unchanged during the
experiments. Note that the increase in the shift of the adsorbed species observed upon charging,
and alignment issues between the supercapacitor axis and the z-pulsed field gradient, may result
in partial overlap of the contributions of the spins inside the electrodes and the separator.
We detected a reproducible and reversible increase in the total signal area at 2.5 V of about 6%
and 3% in the case of 1H and 19F, respectively. We could not assign them to changes in transverse
or longitudinal relaxation times; they are probably due to a conductivity decrease upon charging,
which results in an improvement of the probe quality factor and an increase of the overall signal.18
To account for this small effect, we adjusted the intensity of the whole profile to keep the total
signal identical for the three states of charge (Figure S6).
In CC (Figure 2a-b), the 1H and 19F relative concentration changes show ion exchange during
charge: upon charging, TEA+ migrate towards the negative electrode and are ejected from the
positive electrode. At the same time, the BF4- population at the negative electrode decreases
slightly, while it increases in similar proportions into the positive electrode.
Those experiments evidence some ion exchange at both electrodes (counter ions, co-ions out),
in agreement with previous reports.10,19 However, compared to the flow of cations, the flux of
anions is reduced. The mechanism at the negative electrode is therefore counter-ion adsorption
with a small contribution from anion desorption (i.e. from ion exchange), which also confirms
previous results.19 At the positive electrode, there is co-ion desorption (TEA+) and a small influx
On discharge, the relative concentration changes (filled orange in Figure S7) displays the reverse
behavior. In addition, the similar concentration profiles (at 0 V and OCV) indicate a good
reversibility of the charge of the supercapacitor. This is in agreement with the previous
observations by ex situ NMR experiments.10
The carbide-derived carbon was then studied with in situ 1H and 19F 1D-MRI. The relative ionic
concentration profiles, normalized to the same area, are reported in Figure 2c-d. Interestingly, the
relative concentration changes in TEA+ and BF
4- are of similar shape in both carbons, but we detect
an increased interaction with the anions in CDC (Figure 2d) compared to CC. The
charge-discharge mechanism is therefore more tilted towards ion exchange with now an increase flux of
Figure 3. (a,b) Open circuit contents of the pores for (left) CC and (right) CDC. The conventional
carbon (CC) has both small and large nanopores, while the CDC has a majority of small nanopores,
positive electrode and (e,f) for the green negative electrode, showing the observed anion and cation
flux in the carbon electrode upon charging.
These differences can be rationalized with the carbon texture. The ions located in the small or
sub-nanometer micropores are considered as the key players for the anomalous increase of
capacitance in nanoporous carbon electrodes2,3 and we provide here an experimental probe for this
behavior.
In conventional activated carbons (like CC), before any charge, the TEA+ are spontaneously in
excess inside the small micropores while the anions are rather located nearby, in the connected
larger micropores, i.e. 1-2 nm (Figure 3a). This is clearly seen from previously published 13C and 11B NMR spectra of the same carbon soaked with a similar electrolyte solution: there are three
times more TEA+ than BF
4- adsorbed in micropores (without any voltage being applied), which are
both identified from their signals shifted by -6 to -8 ppm in the NMR spectrum. 10 This preferential
adsorption of TEA+ may result from their hydrophobic ethyl groups, and explain the dissymmetric
behavior of these electrodes. This localized violation of electroneutrality has also been observed
by NMR in aqueous electrolytes.20 As there is less BF
4- adsorbed in the smallest micropores, these
anions are less likely to be repelled by electronic negative charges (Figure 3e), and the anion flux
is therefore limited (Figure 3c). This is possible because the BF4- anions can reside in the large
micropores close the small ones to maintain electroneutrality at the nanometer scale, and while
staying slightly away from the carbon surface, as seen from their unshifted NMR signal in soaked
electrodes. This may be also linked to a stronger affinity for the acetonitrile molecules, which may
prevent them from entering the smallest micropores. All in all, the longer distance to the carbon
we cannot exclude a reorganization of the anions inside the positive electrode, where previously
free anions can then enter the pores, replacing the exiting cations. However, we expect the quantity
of incoming anions to be limited to what is available in nearby large nanopores and what is
expelled from the negative electrode.
In CDC, the large proportion of small micropores is considered as the driving force behind
increased capacitance.21,22 It favors the joint adsorption of cations and anions, and we infer this
from the similar 19F and 1H ex situ NMR spectra of a very similar CDC carbon soaked with TEABF 4
in deuterated acetonitrile in Ref. 23 (Figure 3b). These previously published NMR spectra clearly
show a very close proportion of adsorbed species for cations and anions, which hints towards a
symmetric behavior for anions and cations upon charging/discharging this CDC based
supercapacitor. This might be expected in CDC, as the narrower pore size distribution will force
anions to also come close to the carbon surface, as larger micropores are not available. Therefore,
BF4- anions are now attracted/repelled by the electronic charge in the same proportions as TEA+
cations (Figure 3b and 3d). Therefore, in both electrodes, the ion exchange mechanism dominates
with similar contributions from the cations and anions.
We also recorded the 1H profile for a supercapacitor made with CC and a 1 mol.L-1 solution of
TEABF4 in non-deuterated acetonitrile to probe the solvent’s part in the process (Figure 4a). As
expected, the 1H concentration profile contains a contribution from the solvent. The 1H
concentration changes are, however, of the same order of magnitude as those observed for TEA+
alone (Figure 4b). Although we cannot rule out a rearrangement of the solvent at the nanometer
scale, nor that small changes in solvent concentrations are harder to detect, we can safely assume
that no significant macroscopic change in the solvent concentration occurs in the electrodes, which
measurements.5 This also implies that we do not see a flux of solvents molecules resulting from
desolvation. Although desolvation was inferred from the relative size of pores and
solvated/desolvated ions,2 and confirmed with the decrease of the adsorbed NMR solvent signal at
the negative electrode in previous experiments,10 our results indicate that the solvent molecules
Figure 4. Charge/discharge 1D TEA+ concentration profiles (left) during OCV, at 2.5 V and 0 V,
and the corresponding changes on the same scale (right: red for charge and orange for discharge)
observed for a supercapacitor made with CC with (a) non-deuterated and (b) deuterated
Conclusions
As a conclusion, we managed with a 1D-MRI analysis to follow the ionic concentration changes
in supercapacitors with an electrode configuration close to that used in industry and with good
electrochemical performances. The strong magnetic field gradient (180 G/cm) allows for the
monitoring of the flux of ions in and out of each electrode. In a microporous carbon with a large
pore size distribution from 0.5 to 2.0 nm as in a conventional carbon, our MRI measurements
indicate TEA+ adsorption at the negative electrode, and desorption at the positive electrode, while
the BF4- opposite flux is observed in lesser proportions. In a microporous carbon with a narrow
pore size distribution around 0.7 nm (CDC), we see an increased interaction with the anions, which
tilts the charge mechanism, in both electrodes, towards ion exchange, with counter-ions entering
and co-ions leaving each electrode.
We explain this phenomenon by the porous texture of CDC: cations and anions are now in equal
concentration in the small micropores, because of the absence of large micropores, which leads to
a more symmetrical behavior of the ions during charge and discharge and an increased capacitance.
The present method is applicable to the operando studies of various devices (batteries, fuel cells,
electrochemical cells…) by magnetic resonance imaging.
Methods
Electrode preparation
The electrodes are prepared by spreading the paste of nanoporous carbon powder (85 w%) mixed
with a PTFE binder (10 w%, Aldrich) and carbon black (5 w%, Pure Black, Superior Graphite Co.,
measurements17 and soaked with an organic electrolyte: a 1 mol.L-1 solution of
tetraethylammonium (TEA+)-tetrafluoroborate (BF
4-) in deuterated acetonitrile - all purchased
from Sigma-Aldrich and used without further purification.
Electrochemical cycling
The supercapacitors are preconditioned before the NMR experiments: the cells are cycled 5 times
at a rate of 2 mV.s-1 be-tween 0.9 V and 1.1 V then 5 times between 0.9 V and 1.3 V and so on
until reaching 2.5 V. The first NMR profile measurement is carried out in open circuit voltage
(OCV) conditions for an overview of the species distribution (cations or anions) before charging.
The supercapacitor is then charged with a rate of 2 mV.s-1 to 2.5 V and held in floating at this
voltage to perform the second NMR profile measurement (supercapacitor in charge) for
approximatively 3 hours. The supercapacitor is then discharged at the same rate (2 mV.s-1) and
held in floating at 0 V for approximatively 3 hours during the third NMR profile measurement
corresponding to the discharged state.
To that end, we set up a potentiostat and NMR spectrometer synchronization. A cable connects
the potentiostat with the NMR spectrometer (IPSO card). The potentiostat sends a TTL pulse once
the desired voltage is reached. The NMR pulse sequence is modified to include a waiting time for
this TTL pulse before the measurement starts.
1D concentration profile recording
Experimentally, a short excitation pulse is applied with the gradient already switched on (see
Figure S5). This MRI experiment is identical to that originally proposed by Lauterbur,14 later
renamed BLAST15 or ZTE.16 The name only differs because of the data processing (2D or 3D
obtained from a simple Fourier transform of the data. The missing points (= 2) in the center of the
k-space due to the dead-time of the probe are not numerically calculated. The pulse sequence
allows for a significant reduction of the delay between excitation and acquisition. Yet the short
dead time (TE) still creates a first-order phase shift and has a significant effect on the concentration
profiles and their differences. The concentration profiles were therefore processed in magnitude
mode. The 1D concentration profiles were measured with the pulse sequence shown in Figure S5
on a Bruker 200 MHz Wide Bore Avance III spectrometer equipped with a Bruker Diff30 probe
(1H and 19F 10 mm inner diameter saddle coils) and a GREAT60 (60 G.A-1cm-1) gradient amplifier.
The strength of the pulsed magnetic field gradient was ramped up to 180 G.cm-1 in 500 µs and
stabilized for 1 ms before a 30° hard pulse excitation of duration 3.5 µs (25 W). The probe
deadtime (TE) is set to 6.5 µs and the signal is recorded for 2 ms. For the 1H concentration profiles,
a recovery delay of 5 s was sufficient to ensure the complete relaxation of the spin system and
2048 scans were used for each concentration profile. For the 19F concentration profiles, a recovery
delay of 10 s was necessary and 1024 scans per concentration profile were recorded. The spin
density profiles for 1H and 19F spread over a frequency of around 46 kHz. The resolution is limited
by the width of the spectrum under no gradient (5 kHz), corresponding to around 70 µm in 1H and 19F.
ASSOCIATED CONTENT
Supporting Information. Electrochemical and ex situ NMR characterization of the
supercapacitor designs, structural characterization of the carbons, details on experimental and
AUTHOR INFORMATION
Corresponding Author
michael.deschamps@univ-orleans.fr; raymundo@cnrs-orleans.fr; elodie.salager@cnrs-orleans.fr
Author Contributions
The manuscript was written through contributions of all authors. All authors have given approval
to the final version of the manuscript.
Funding Sources
No competing financial interests have been declared. The authors acknowledge financial support
from the French national network “Réseau sur le Stockage Electrochimique de l’Energie” (RS2E)
FR CNRS 3459, and from Laboratory of Excellence program STORE-EX (ANR 10-LABX-0076).
ACKNOWLEDGMENT
G.O. thanks the Agence Nationale de la Recherche (ANR) with the LABEX STORE-EX
REFERENCES
(1) Miller, J. R.; Burke, A. F. Electrochemical Capacitors: Challenges and Opportunities for
Real-World Applications. Electrochem. Soc. Interface 2008, 17, 53-57.
(2) Chmiola, J.; Yushin, G.; Gogotsi, Y.; Portet, C.; Simon, P.; Taberna, P. L. Anomalous
Increase in Carbon Capacitance at Pore Sizes Less Than 1 Nanometer. Science 2006, 313 (5794),
1760–1763.
(3) Raymundo-Piñero, E.; Kierzek, K.; Machnikowski, J.; Béguin, F. Relationship between
the Nanoporous Texture of Activated Carbons and Their Capacitance Properties in Different
Electrolytes. Carbon 2006, 44, 2498–2507.
(4) Levi, M. D.; Levy, N.; Sigalov, S.; Salitra, G.; Aurbach, D.; Maier, J. Electrochemical
Quartz Crystal Microbalance (EQCM) Studies of Ions and Solvents Insertion into Highly Porous
Activated Carbons. J. Am. Chem. Soc. 2010, 132, 13220–13222.
(5) Tsai, W.-Y.; Taberna, P.-L.; Simon, P. Electrochemical Quartz Crystal Microbalance
(EQCM) Study of Ion Dynamics in Nanoporous Carbons. J. Am. Chem. Soc. 2014, 136, 8722–
8728.
(6) Lee, S.-I.; Saito, K.; Kanehashi, K.; Hatakeyama, M.; Mitani, S.; Yoon, S.-H.; Korai, Y.;
Mochida, I. 11B NMR Study of the BF4- Anion in Activated Carbons at Various Stages of
Charge of EDLCs in Organic Electrolyte. Carbon 2006, 44, 2578–2586.
(7) Borchardt, L.; Oschatz, M.; Paasch, S.; Kaskel, S.; Brunner, E. Interaction of Electrolyte
(8) Forse, A. C.; Griffin, J. M.; Presser, V.; Gogotsi, Y.; Grey, C. P. Ring Current Effects:
Factors Affecting the NMR Chemical Shift of Molecules Adsorbed on Porous Carbons. J. Phys.
Chem. C 2014, 118, 7508–7514.
(9) Forse, A. C.; Griffin, J. M.; Merlet, C.; Carretero-Gonzalez, J.; Raji, A.-R. O.; Trease, N.
M.; Grey, C. P. Direct Observation of Ion Dynamics in Supercapacitor Electrodes Using in Situ
Diffusion NMR Spectroscopy. Nat. Energy 2017, 2, 16216.
(10) Deschamps, M.; Gilbert, E.; Azais, P.; Raymundo-Piñero, E.; Ammar, M. R.; Simon, P.;
Massiot, D.; Béguin, F. Exploring Electrolyte Organization in Supercapacitor Electrodes with
Solid-State NMR. Nat. Mater. 2013, 12, 351–358.
(11) Wang, H.; Köster, T. K.-J.; Trease, N. M.; Ségalini, J.; Taberna, P.-L.; Simon, P.;
Gogotsi, Y.; Grey, C. P. Real-Time NMR Studies of Electrochemical Double-Layer Capacitors.
J. Am. Chem. Soc. 2011, 133, 19270–19273.
(12) Wang, H.; Forse, A. C.; Griffin, J. M.; Trease, N. M.; Trognko, L.; Taberna, P.-L.;
Simon, P.; Grey, C. P. In Situ NMR Spectroscopy of Supercapacitors: Insight into the Charge
Storage Mechanism. J. Am. Chem. Soc. 2013, 135, 18968–18980.
(13) Ilott, A. J.; Trease, N. M.; Grey, C. P.; Jerschow, A. Multinuclear in Situ Magnetic
Resonance Imaging of Electrochemical Double-Layer Capacitors. Nat. Commun. 2014, 5, 4536.
(14) Lauterbur, P. C. Image Formation by Induced Local Interactions: Examples Employing
(15) Hafner, S. Fast Imaging in Liquids and Solids with the Back-Projection Low Angle ShoT
(BLAST) Technique. Magn. Reson. Imaging 1994, 12, 1047–1051.
(16) Weiger, M.; Pruessmann, K. P.; Hennel, F. MRI with Zero Echo Time: Hard versus
Sweep Pulse Excitation. Magn. Reson. Med. 2011, 66, 379–389.
(17) Salager, E.; Sarou-Kanian, V.; Sathiya, M.; Tang, M.; Leriche, J.-B.; Melin, P.; Wang,
Z.; Vezin, H.; Bessada, C.; Deschamps, M.; Tarascon, J.-M. Solid-State NMR of the Family of
Positive Electrode Materials Li2Ru1–YSnYO3 for Lithium-Ion Batteries. Chem. Mater. 2014, 26,
7009–7019.
(18) Houlleberghs, M.; Hoffmann, A.; Dom, D.; Kirschhock, C. E. A.; Taulelle, F.; Martens,
J. A.; Breynaert, E. Absolute Quantification of Water in Microporous Solids with 1H Magic
Angle Spinning NMR and Standard Addition. Anal. Chem. 2017, 89, 6940–6943.
(19) Griffin, J. M.; Forse, A. C.; Tsai, W.-Y.; Taberna, P.-L.; Simon, P.; Grey, C. P. In Situ
NMR and Electrochemical Quartz Crystal Microbalance Techniques Reveal the Structure of the
Electrical Double Layer in Supercapacitors. Nat. Mater. 2015, 14, 812–819.
(20) Luo, Z.-X.; Xing, Y.-Z.; Ling, Y.-C.; Kleinhammes, A.; Wu, Y. Electroneutrality
breakdown and specific ion effects in nanoconfined aqueous electrolytes observed by NMR. Nat.
(21) Futamura, R.; Iiyama, T.; Takasaki, Y.; Gogotsi, Y.; Biggs, M. J.; Salanne, M.; Ségalini,
J.; Simon, P.; Kaneko, K. Partial Breaking of the Coulombic Ordering of Ionic Liquids Confined
in Carbon Nanopores. Nat. Mater. 2017, 16, 1225–1232.
(22) Salanne, M.; Rotenberg, B.; Naoi, K.; Kaneko, K.; Taberna, P.-L.; Grey, C. P.; Dunn, B.;
Simon, P. Efficient Storage Mechanisms for Building Better Supercapacitors. Nat. Energy 2016,
1, 16070.
(23) Forse, A. C.; Griffin, J. M.; Wang, H.; Trease, N. M.; Presser, V.; Gogotsi, Y.; Simon, P.;
Grey, C. P. Nuclear Magnetic Resonance Study of Ion Adsorption on Microporous