Development of an Eddy Current Inversion Algorithm for
Characterization of Surface Defects
by
Ehsan MOHSENI
MANUSCRIPT-BASED THESIS PRESENTED TO ÉCOLE DE
TECHNOLOGIE SUPÉRIEURE IN PARTIAL FULFILLMENT FOR THE
DEGREE OF DOCTOR OF PHILOSOPHY
Ph.D.
MONTREAL, AUGUST 20
TH, 2018
ÉCOLE DE TECHNOLOGIE SUPÉRIEURE
UNIVERSITÉ DU QUÉBEC
It is forbidden to reproduce, save or share the content of this document either in whole or in parts. The reader who wishes to print or save this document on any media must first get the permission of the author.
BOARD OF EXAMINERS THIS THESIS HAS BEEN EVALUATED BY THE FOLLOWING BOARD OF EXAMINERS
Mr. Martin Viens, Thesis Supervisor
Departement of Mechanical Engineering at École de technologie supérieure
Ms. Wen-Fang Xie, Thesis Co-supervisor
Departement of Mechanical Engineering at Concordia university
Mr. Guy Gauthier, Chair, Board of Examiners
Departement of Automated Manufacturing Engineering at École de technologie supérieure
Mr. Mohammad Jahazi, Member of the jury
Departement of Mechanical Engineering at École de technologie supérieure
Mr. Catalin Mandache, External Evaluator
Aerospace Research Center National Research Council Canada (NRC)
THIS THESIS WAS PRENSENTED AND DEFENDED
IN THE PRESENCE OF A BOARD OF EXAMINERS AND THE PUBLIC <AUGUST 8TH, 2018 >
ACKNOWLEDGMENTS
The past years of my Ph.D. studies at École de technologie supérieure have brought me new experiences, friends and mentors. As any other life chapter, this journey also reaches its end however, taking the journey was not possible in first place without having the constant support of friends, family and university staff.
First, I owe this opportunity to my supportive and kind supervisor Professor Martin Viens who benevolently showed me the path of progression through difficult stages of my Ph.D. studies and he never stopped assisting me in fulfilling my duties as a researcher. His professional acts, manners and attitude toward others was the most precious inspiration to me and I am sincerely grateful to him for this noble lesson.
I would like to express my gratitude for the helps and supports of Professor Wen-Fang Xie who has always provided me with invaluable advises throughout my studies. Her kindness besides her mentorship has a great influence on me and I cannot thank her enough for that. I would like to thank Dr. Demartonne Ramos França whose leadership and friendship lessons would last forever with me. He provided me with new perspectives toward my project and I deeply appreciate his devotion to being a teacher.
In addition, I am deeply grateful to the president of jury, Professor Guy Gauthier and jury members, Professor Mohammad Jahazi and Dr. Catalin Mandache for taking the time to read this dissertation despite being very occupied. I also really appreciate their comments and suggestions concerning this thesis since it would help me to make modifications towards the improvement.
I would like to extend my thanks to Natural Sciences and Engineering Research Council of Canada (NSERC), Consortium de recherche et d'innovation en aérospatiale au Québec (CRIAQ), École de technologie supérieure (ÉTS), National Research Council of Canada (CNRC-NRC), Pratt and Witney Canada, L-3 Mas Communications, Heroux-Devtek, Bell
Helicopter, and Safran for their financial supports and making it possible to carry out these research activities. Besides, special thanks to CMC Microsystems for providing convenient access to the license of the software used in this study. Additionally, I appreciate the efforts and directions provided by all the members of the companies and other universities, who were actively involved in the projects. I am also very thankful to Professor Lionel Birglen for his devotion in direction and organisation of the project CRIAQ MANU-418 activities.
I extend my gratitude to my best friends Dr. Behzad Ghafarizadeh, Dr. Sheida Sarafan, Mr. Vahid Talei, Ms. Roja Mirheidari, Ms. Sorour Davoodi and Mr. Baoguang Xu for their sincere companionship and helps with regard to settling in Canada, starting my studies, and getting through hardships of my daily life as an international student. In addition, I am very grateful to my very special colleague Dr. Hamid Habibzadeh for helping me from the first day of my Ph.D., accompanying me during my studies, and being a kind, amazing friend.
Finally, in every moment of my life, I had the selfless support and love of my family members who are my main inspirational characters leading me in my endeavours. I feel privileged to have very compassionate, diligent and amazing parents, Houshang and Soghra, who both taught life and science lessons as teachers not only to me but also to thousands others. I appreciate the love of my siblings, Azadeh and Iman, who always backed me up in every chapter of my life.
DÉVELOPPENT D’UN ALGORITHME D’INVERSION DES COURANTS DE FOUCAULT POUR LA CARACTÉRISATION DES DÉFAUTS DE SURFACE
Ehsan MOHSENI RÉSUMÉ
L'industrie aérospatiale est de plus en plus préoccupée par l'intégrité et la performance des structures métalliques vieillissantes dans les aéronefs qui ont été en service durant plusieurs années. Les charges cycliques appliquées à ces structures pendant la circulation au sol, la pressurisation, le décollage, la dépressurisation et l'atterrissage favorisent l’amorçage et la propagation de nombreuses fissures de fatigue dans les zones de concentration de contrainte. Ces fissures doivent être détectées et dimensionnées avec fiabilité par des méthodes de contrôle non destructif (CND) avant qu'elles n'atteignent une taille critique qui pourrait entraîner la défaillance désastreuse de la composante. Non seulement les inspections en service bénéficient d'un système de CND fiable, mais le rôle de ces systèmes devient vital lors des phases de conception. De nos jours, il est possible d'estimer la durée de vie d'une composante critique en se basant sur des modèles élaborés à partir de la mécanique de la rupture. Ces modèles permettent d’estimer, pour une durée de vie planifiée, la taille maximale d'un défaut acceptable dans une zone donnée. Par ailleurs, la taille maximale des défauts acceptables et la limite de détection fiable d'une technique de contrôle sont les intrants de modèles d'évaluation des risques utilisés pour planifier les inspections périodiques en service. En gardant cela à l'esprit, il est évident que la détection des défauts n'est plus la seule préoccupation des études sur les CND. Par conséquent, les études récentes tentent de se concentrer sur le dimensionnement des défauts et la fiabilité d'un tel dimensionnement.
Les essais par courants de Foucault (ECF) constituent une méthode électromagnétique de CND bien établie. Depuis plusieurs années, elle est utilisée pour inspecter les composants du fuselage, du moteur et des roues d'un aéronef à la recherche de légers défauts de surface. Dans ce contexte, les sondes de surface différentielles en réflexion (noyau en forme de D inversé) sont parmi les meilleures candidates puisqu'elles fournissent un rapport signal sur bruit élevé. La complexité de la théorie électromagnétique régissant les ECF, additionnée à la finesse des détails géométriques de ces sondes ont ralenti le développement de modèles analytiques et semi-analytiques portant sur l'interaction entre ces sondes et des défauts de surface. Par conséquent, le développement de modèles pouvant fournir des mesures quantitatives des défauts inspectés s'est accompagné de difficultés. Cependant, au cours des dernières décennies, avec le développement de l'informatique, la modélisation de ce type de problèmes est devenue plus facile grâce à des méthodes numériques telles que la modélisation par éléments finis (MEF). De plus, les techniques de calcul souple sont devenues suffisamment sophistiquées pour imiter efficacement la reconnaissance des formes et les capacités décisionnelles du cerveau humain. Ces nouvelles possibilités, issues de l'ère technologique, peuvent être intégrées afin de développer de nouvelles méthodologies d'interprétation des signaux ECF et de dimensionnement des défauts détectés.
La présente recherche vise à développer un algorithme d'inversion des courants de Foucault pour caractériser des défauts de surface. Ce travail de recherche consiste en deux parties. La première vise à développer un outil MEF pour simuler le balayage des encoches de surface avec une sonde ECF. Dans ce contexte, la capacité de Comsol Multiphysics à modéliser l'interaction entre une sonde de surface différentielle et différentes encoches de surface a été étudiée et le modèle a été validé par des résultats expérimentaux. Par la suite, un système d'inférence adaptatif neuro-flou, conçu pour l'estimation de la longueur d'entailles, a été entraîné en utilisant les signaux de diverses encoches générées par simulation. De plus, le système de dimensionnement a été testé et sa performance a été évaluée. Concernant la deuxième partie de cette recherche, la fiabilité d'un système ECF manuel et automatisé a été étudiée en comparant les courbes de probabilité de détection obtenues en testant des composants en acier ferromagnétique comportant des fissures de fatigue. L'étude a porté sur une sonde de surface différentielle, différents inspecteurs et une variation de paramètres d'essai influents. Le concept de dimensionnement proposé dans cette recherche peut être utilisé pour tout type de sonde ECF, de matériau et de défaut.
Mots-clés: Contrôle non destructifs (CND), Essai par courants de Foucault (ECF), Sonde différentielle en réflexion, Évaluation non destructive quantitative (ENDQ), Dimensionnement de fissures, Étude par modélisation, Méthodes numériques, Méthode par éléments finis (MEF), Système d'inférence adaptatif neuro-flou (SIANF), Fiabilité de l'inspection, Probabilité de détection (PD), Balayage manuel par courants de Foucault, Courants de Foucault automatisés, Simulation, Fissures.
DEVELOPMENT OF AN EDDY CURRENT INVERSION ALGORITHM FOR CHARACTERIZATION OF SURFACE DEFECTS
Ehsan MOHSENI ABSTRACT
There is an increasing concern in aerospace industry regarding the integrity and performance of ageing metallic structures in aircraft that have been in service for several years. Cyclic loads applied to these structures during taxiing, pressurization, taking off, depressurization, and landing promote the nucleation and growth of many fatigue cracks from the locations of stress concentration. These cracks shall be detected and sized reliably by non-destructive evaluation (NDE) methods before they reach a critical size, which may lead to disastrous failure of components. Not only the in-service inspections benefit from a reliable NDE system, but also the role of such systems is becoming vital during design stages. Nowadays, it is possible to use life estimation models developed based on fracture mechanics to estimate the maximum allowable defect size located in critical components for an anticipated life span. Moreover, risk assessment models take the estimated maximum allowable flaw size and the flaw size that can be reliably detected as inputs to plan periodical inspections. Bearing these in mind, it is evident that defect detection is not the only concern of NDE studies anymore. Hence, the recent studies try to focus on defect sizing and the reliability of the sizing as well.
Eddy current testing (ECT) is a well-established electromagnetic method of NDE. For several years, it has been employed to inspect the fuselage, wings, engine and wheel components of aircraft for tiny surface flaws. For these purposes, ECT split-D reflection differential surface probes are one of the best nominees since they provide a high signal-to-noise ratio. The complexity of electromagnetic theory governing ECT along with the very delicate geometrical details of such probes have slowed down the advances in analytical/semi-analytical modelling of the interaction between such probes and surface defects. Therefore, development of models that could provide quantitative measures of inspected defects has been accompanied with difficulties. However, with the growth of computer science and resources in recent decades, modelling of these kinds of problems using numerical methods such as finite element modelling has become faster than before. Furthermore, the soft computing techniques have become sophisticated enough to effectively imitate the pattern recognition and decision making abilities of human brain. These offerings, brought by the new technology era, can be integrated in order to develop new methodologies for interpretation of ECT signals and sizing of detected defects.
The present research aims at developing an eddy current inversion algorithm for characterization of surface defects. The research work consists of two main parts. The first part aims to develop a FEM tool to simulate scanning of surface notches with ECT probe. In this context, the capability of Comsol Multiphysics in modelling the interaction between a split-D probe and various surface notches was investigated and the model was validated by
experimental results. Subsequently, an adaptive neuro-fuzzy inference system was designed and trained, using model-generated signals of various notches, for notch length estimation. Furthermore, the sizing system was tested and its performance was assessed. As a second part to this research, reliability of the manual and automated ECT system was investigated through comparing probability of detection curves obtained by testing defective ferromagnetic steel components. The study involved a split-D surface probe, different inspectors and variation of influential test parameters. The sizing concept proposed in this research can be used for any type of ECT probe, material and defect.
Keywords: Non-destructive testing (NDT), Eddy current testing (ECT), Split-D reflection differential probe, Quantitative non-destructive evaluation (QNDE), Crack sizing, Model-based study, Numerical methods, Finite element method (FEM), Adaptive neuro-fuzzy inference system (ANFIS), Inspection reliability, Probability of detection (POD), Manual eddy current scan, Automated eddy current, Simulation, Cracks.
TABLE OF CONTENTS
Page
INTRODUCTION ...1
CHAPTER 1 LITERATURE REVIEW ...11
1.1 Eddy current testing ...11
1.1.1 Electromagnetic induction ... 12
1.1.2 Eddy current testing and influential parameters ... 15
1.1.3 Modelling in eddy current testing ... 18
1.1.4 Finite element modelling of eddy current probes ... 21
1.1.5 Model-based studies of split-D differential eddy current probe ... 25
1.2 Soft computing ...32
1.2.1 Soft computing in eddy current testing ... 35
1.3 Probability of detection ...37
1.3.1 Probability of detection for eddy current testing ... 41
CHAPTER 2 FINITE ELEMENT BASED MODELLING OF SURFACE CRACKS SCANNING USING A REFLECTION DIFFERENTIAL SPLIT-D EDDY CURRENT PROBE ...47
2.1 Introduction ...48
2.2 Impedance measurement of a commercial split-D coil ...52
2.3 Refinement of finite element modelling parameters using an absolute coil ...54
2.3.1 Governing electromagnetic equations ... 56
2.3.2 Extent of the simulation domain ... 58
2.3.3 Mesh assignment ... 59
2.3.4 Conductivity of the air domain ... 63
2.3.5 Computed impedance with the optimized model parameters ... 65
2.4 FEM analysis of a split-D differential coil ...66
2.4.1 Extent of the simulation domain ... 68
2.4.2 Mesh size ... 69
2.4.3 Conductivity of the air domain ... 71
2.4.4 Simulation results and discussion ... 72
2.5 Summary and conclusions ...78
CHAPTER 3 ADAPTIVE NEURO-FUZZY INFERENCE SYSTEM TRAINED FOR SIZING SEMI-ELLIPTICAL NOTCHES SCANNED BY EDDY CURRENTS ...81
3.1 Introduction ...81
3.2 Experiments and modelling ...85
3.2.1 Lift-off and tilt studies ... 91
3.2.2 Size dependent signals for ANFIS training ... 96
3.3 Adaptive neuro-fuzzy inference system ...97
CHAPTER 4 A RELIABILITY STUDY ON AUTOMATED AND MANUAL
EDDY CURRENT TESTING ...103
4.1 Introduction ...104
4.2 ECT POD variables...107
4.3 Experimental procedure ...109
4.4 Noise Treatment ...112
4.5 Numerical modeling for orientation study ...116
4.6 Effect of crack orientation on signal amplitude ...118
4.7 POD of automated and manual tests ...122
4.8 Conclusions ...126
CONCLUSION ...129
RECOMMENDATIONS ...135
APPENDIX I A MODEL-BASED STUDY OF THE EFFECT OF SEMI-ELLIPTICAL SURFACE NOTCH GEOMETRY ON THE SIGNAL OF A SPLIT-D EDDY CURRENT PROBE ...147
APPENDIX II SENSITIVITY OF EDDY CURRENT SIGNALS TO PROBE’S TILT AND LIFT-OFF WHILE SCANNING SEMI-ELLIPTICAL SURFACE NOTCHES - A FINITE ELEMENT MODELING APPROACH ...149
LIST OF TABLES
Page
Table 2.1 Dimensions and material properties of the commercial split-D
probe’s components. ...52
Table 3.1 Geometry of semi-elliptical EDM notches. ...87
Table 3.2 Dimensions of semi-elliptical EDM notches used in the simulations. ...90
Table 3.3 Set of inputs and output that are used in the form of a vector to train a grid type ANFIS. ...97
Table 3.4 Nominal length and the length estimated by the trained FIS for 3 calibration and 5 model-based EDM notches. ...99
Table 4.1 List of parameters causing variations in ECT signals during automated and hand scans ...108
Table 4.2 List of parameters examined in this work for monitoring their effect on the distribution of ECT response ...109
Table 4.3 The length interval studied through modelling for each specific orientation ...118
Table 4.4 POD parameters for automated scans ...124
Table 4.5 POD parameters concerning the manual scans at different frequencies ...125
LIST OF FIGURES
Page Figure 1.1 (a) Self-induction for a current carrying coil (Hellier, 2013) and, (b) interaction
between the coil’s electromagnetic field and the conductor leading to formation of ECs (Hellier, 2013) ...13 Figure 1.2 Transformation from (a) an impedance plane to (b) a normalized impedance
plane (Hellier, 2013). ...14 Figure 1.3 (a) Current density versus the penetration depth (Hellier, 2013), (b) changes in
ECs’ phase versus their depth of penetration (Hellier, 2013) ...16 Figure 1.4 (a) Absolute and (b) reflection differential configurations of ECT probes
(García-Martín et al., 2011) ...17 Figure 1.5 (a) 3-D model of a split-D probe reconstructed by X-ray tomography and
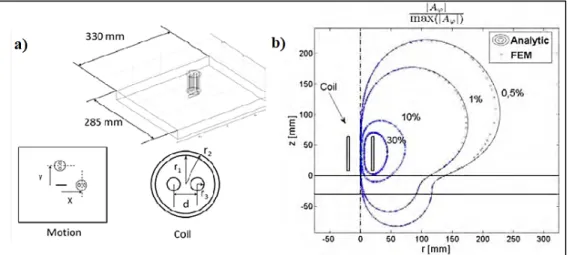
sectioned in half, and (b) microscopic image taken from the split-D probe’s tip. ...18 Figure 1.6 (a) 3-D assembly model for TEAM problem 8. Scan directions modelled
through FEM and the structure of the reflection differential surface probe used in simulations (Rosell & Persson, 2011), and (b) four different levels of the vector potential’s amplitude/maximum amplitude
ratio and the truncation box defined on that basis (Rosell & Persson, 2011) ...22
Figure 1.7 (a) Simplified closed fatigue crack model containing non-zero conductivity region proposed by (Rosell & Persson, 2012a), and (b) relevant input parameters that were accounted for in signal response POD by (Rosell & Persson, 2012b) ...24 Figure 1.8 Experimental peak-to-peak voltage versus the notch opening for two types of
rectangular and semi-circular notches, each having two different dimensions. Extrapolated model-based curves for the larger notches were superimposed on the experimental curves. Tests were carried out at frequency of 2 MHz on samples of Ti-6246 (Norio Nakagawa et al., 2009) ...26 Figure 1.9 Comparison between the impedance data measured by impedance spectroscopy
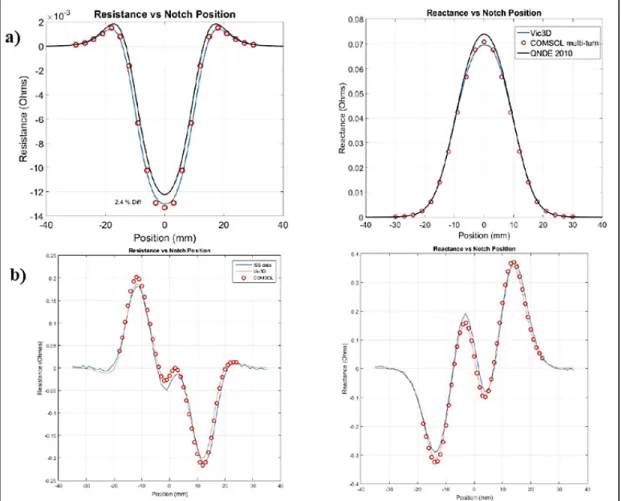
and those obtained from VIC 3D® and COMSOL modelling for a rectangular notch with 12.6 mm in length, 5 mm in depth, and 0.28 mm in width. The results for (a) an absolute air-cored probe, (b) a split-D air-cored differential probe scanning rectangular surface notches(Brown & Eviston, 2017) ...27
Figure 1.10 Comparison between the impedance data measured by IA, UniWest ECT unit, and those obtained from VIC 3D® and COMSOL modelling for a rectangular notch with 12.6 mm in length, 5 mm in depth, and 0.28 mm in width. The results for (a) an air-cored (R. D. Mooers & Aldrin,
2016a) and (b) a ferrite cored split-D probe (R. D. Mooers & Aldrin, 2016a) ...28
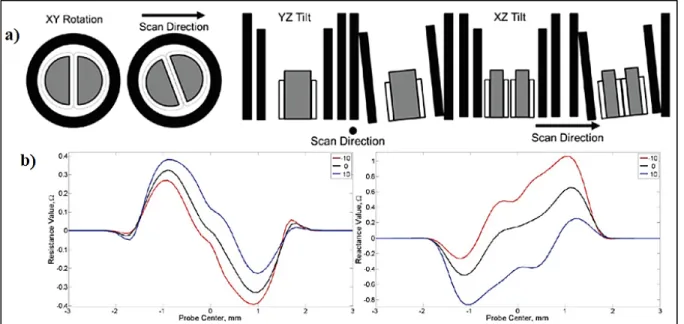
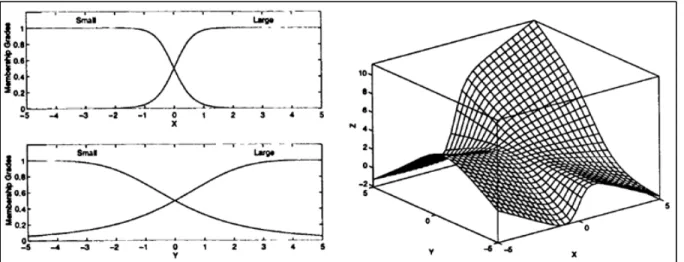
Figure 1.11 (a) D-coils’ assembly rotation about Z axis and tilt in two different planes (R. D. Mooers & Aldrin, 2016b), and (b) variations of the real and imaginary parts of the probe’s impedance with its D-coil assembly tilted by -10° and 10° in XZ plane (R. D. Mooers & Aldrin, 2016b) ...30 Figure 1.12 Membership functions of X and Y as the two inputs of a Sugeno system, and
the surface output of the inference system (Jang et al., 1997) ...34 Figure 1.13 (a) Regression line along with the upper and lower confidence bonds forˆavs.
log( )a data (Annis, 2009), and (b) POD curve and 95% confidence
bonds (Annis, 2009) ...40 Figure 1.14 Two-point normalization applied to raw data and the resulting POD curve is
compared to the POD curve plotted for raw data for (a) EDM (Lemire et al., 2010), and (b) fatigue cracks (Lemire et al., 2010) ...42
Figure 1.15 POD parameters for (a) different test frequencies and crack locations (P. Underhill & T. Krause, 2011a), and (b) different probes and
frequencies (P. R. Underhill & T. W. Krause, 2011) ...43 Figure 1.16 POD parameters are compared for mid-bore and corner cracks grown in
drilled holes as well as the actual bolt holes of in-service components (P. R. Underhill & Krause, 2016) ...44 Figure 2.1 (a) 3-D model of the split-D probe showing coils, cores and magnetic shielding
(b) zoom on the probe’s tip taken with a confocal optical microscope. The outer driver coil and the inner receiver coils are green and red, respectively ...53 Figure 2.2 (a) Experimental setup for measuring the split-D probe’s differential
impedance as the probe scans three reference notches with different depths in aluminum (b) schematic of the split-D probe’s orientation and scan direction with respect to an EDM notch ...54 Figure 2.3 The 3D-half model developed in Comsol to reproduce the results presented in
(Burke, 1988) for an absolute coil EC probe. A circular coil, a defective plate and the encompassing air domain are shown ...55
Figure 2.4 Contour of the ϕ component of the magnetic vector potential A given by a 2D-axisymmetric model of an absolute coil located over an extremely large (500 mm×500 mm×12 mm) un-defective sample. r and z values are in mm. According to (Burke, 1988), simulation is performed with an operating frequency of 900 Hz ...59 Figure 2.5 Effect of the element size on the normalized computed absolute coil’s (a)
resistance and (b) inductive reactance as it scans an aluminum block containing a notch, (c) Schematic of the coil position with respect to the notch location. Results are normalized by the magnitude of impedance variation in the Burke’s measurements (Burke, 1988) ...62 Figure 2.6 Effect of the number of boundary layers applied in the first three eddy current
penetration depths on the normalized computed absolute coil’s (a) resistance and (b) inductive reactance as the coil scans an aluminum block containing a notch. Results are normalized by the magnitude of impedance variation in the Burke’s measurement (Burke, 1988) ...63 Figure 2.7 Effect of air conductivity on the normalized computed absolute coil’s (a)
resistance and (b) inductive reactance as the absolute coil scans an aluminum block containing a notch. Results are normalized by the magnitude of impedance variation in the Burke’s measurements (Burke, 1988) ...64 Figure 2.8 Calculated values of the absolute coil’s (a) resistance and, (b) inductive
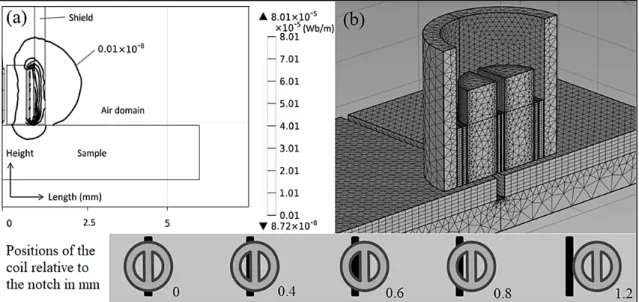
reactance as the coil scans over a notch. Comparison with impedance measurements extracted from Burke's work (Burke, 1988) ...66 Figure 2.9 (a) Contour map of the magnetic vector potential component perpendicular to
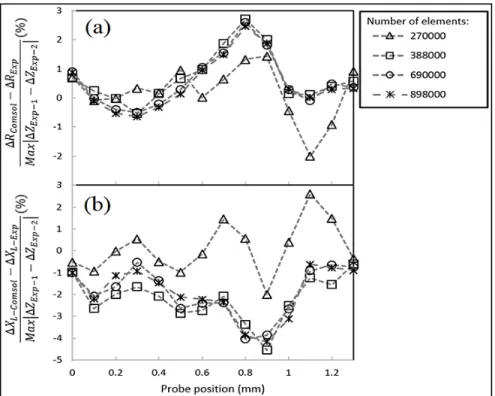
the symmetry plane at 500 kHz for a split-D probe over an un-defective aluminum block, (b) model’s mesh distribution for a split-D probe scanning an aluminum block with a 0.503 mm deep notch ...69 Figure 2.10 Effect of the element size on the normalized computed (a) real and (b)
imaginary parts of the differential impedance for a 0.188 mm deep notch in an aluminum block. Simulations are performed using four different numbers of volumetric tetrahedral elements ...70 Figure 2.11 Effect of the element size on the normalized computed (a) real and (b)
imaginary parts of the differential impedance for 1.008 mm deep notch in an aluminum block. Numerical simulations are performed using four different numbers of volumetric tetrahedral elements ...71
Figure 2.12 Effect of air conductivity on the normalized computed (a) real and (b) imaginary parts of the differential impedance for 1.008 mm deep notch in an aluminum block. Numerical simulations are performed for three different values of the air conductivity ...72 Figure 2.13 Imaginary (a) and real (b) parts of the differential impedance obtained through
numerical calculation and measurement with the Nortec-500 flaw detector for a 1.008 mm deep notch in an aluminum block ...73 Figure 2.14 Imaginary (a) and real (b) parts of the differential impedance obtained through
numerical calculation and measurement with the Nortec-500 flaw detector for a 0.503 mm deep notch in an aluminum block ...74 Figure 2.15 (a) Imaginary and (b) real parts of the differential impedance obtained through
numerical calculation and measurement with the Nortec-500 flaw detector for a 0.188 mm deep notch in an aluminum block ...75 Figure 2.16 Single loop of the 8-shaped signals obtained by plotting the imaginary and
real parts of the probe’s impedance (Figures 2.13, 2.14 and 2.15) directly on the impedance plane. (a) 1.008 mm , (b) 0.503 mm and (c) 0.188 mm deep notch ...76 Figure 2.17 Distribution of the z and x components of the induced current density,
represented by a vector field, in the vicinity of the 0.188 mm deep notch as the probe is displaced by (a) 0 mm, (b) 0.6 mm and (c) 1.2 mm. Side view of the scan shows the distribution of the x and y components of the magnetic field intensity ...78 Figure 3.1 Geometrical features of a semi-elliptical notch ...87 Figure 3.2 (a) Setup for measuring the probe’s impedance as it scans the notches, (b)
direction of the raster scan relative to the notch length, and (c) representation of the lift-off distance and tilt angle applied to the probe ..87 Figure 3.3 (a) Cut in half 3D reconstruction of X-Ray tomography images of the split-D
probe, (b) the probe and sample assembly model prepared within Comsol showing a small meshed region in close proximity to the notch geometry ...88 Figure 3.4 Comparison between the measured and simulated signals of (a) notch A, (b)
notch B, and (c) notch C at two different lift-offs of 100 and 140 µm ...92 Figure 3.5 Effect of lift-off variations on the ECT signal of (a) notch A, (b) notch B,
and (c) notch C ...93 Figure 3.6 Comparison between the measured and simulated signals of (a) notch A, (b)
Figure 3.7 Effect of the probe’s tilt angle variations on the signal of (a) notch A, (b) notch B, and (c) notch C ...94 Figure 3.8 Variations of the probe’s signal amplitude as it scans three notches A, B and C
versus the probe’s (a) lift-off, and (b) tilt angle ...95 Figure 3.9 (a) Variations of the form of the probe’s signal as it scans 6 different notches
with different dimensions and (b) three signal shape categories used for training ANFIS ...97 Figure 3.10 (a) Maximum signal amplitude and width shown on a simulated signal of
notch A and (b) structure of a three inputs/single output ANFIS (Jang et al., 1997) ...98 Figure 3.11 Percentage of additional error introduced into the length estimation of notch A
and C because of the probe’s (a) lift-off and (b) tilt angle variations ...100 Figure 3.12 Variations of the normalized maximum amplitude of three notches A, B and C
as the probe’s (a) lift-off and (b) tilt angle change ...100 Figure 4.1 Experimental setup for performing automated ECT scans ...111 Figure 4.2 (a) relative orientation represented by the angle Ɵ, which is defined by the
crack line and scan direction, and (b) peak-to-peak amplitude of an 8-shape ECT signal ...111 Figure 4.3 Typical noise recorded during manual scan and the windows selected
for processing ...113 Figure 4.4 Variations of the percentage of noise level normalized by the calibration signal
amplitude as angle between the probe scan direction and machining tool marks orientation changes. Results are presented for 3 frequencies for both manual and automated scans ...115 Figure 4.5 Optical laser microscope images and samples of the surface roughness profile
for (a) 0°, (b) 45°, and (c) 90° angles that the probe’s scan direction makes with the orientation of tool marks on surface. (d) orientation of tool marks versus Ra ...115 Figure 4.6 Comparison between the measured signal from a crack and simulated signal for
a notch for a (a) 2.92 mm and (b) 1.5 mm long crack/notch oriented at 0° ...117 Figure 4.7 Normalized signal amplitudes versus L/D ratio for orientations of 0°, 45° and
Figure 4.8 Simulated and measured normalized signal amplitudes versus L/D ratio for orientations of 0°, 45° and 90° at 1 MHz ...120 Figure 4.9 Contours of current density norm distribution on the surface of a sample. The
probe center is located 0.3 mm away from the notch center. Notches with lengths of (a) 2 mm, (b) 4 mm, and (c) 6 mm are investigated ...122 Figure 4.10 Regression lines found for
ˆa
vs.a
data and related POD curves plotted forautomated scans with indexes of (a) 0.5 mm, (b) 1.25 mm and (c) 2.5 mm ...124 Figure 6.1 Screen of Nortec 500S showing (a) the effect of test frequency on lift-off traces
for three samples of I, E and A, (b) rotated horizontally lift-off traces at 200 kHz for three samples I, E and A, (c) overlapping of the lift-off traces of samples I and A recorded collectively from different spots on their surface ...141 Figure 6.2 (a) 3-D model reconstructed from CT-scan image stack of the reflection
absolute surface probe showing coils and cores, and (b) X-ray image of the probe along with its axis of symmetry ...143 Figure 6.3 (a) Axisymmetric 2-D model for assembly of probe, sample and air domain
prepared in Comsol and, (b) 3-D model of magnetizer’s assembly and SAE 4340 sample ...144 Figure 6.4 Magnetic field density (a) inside different domains of the assembly including
the SAE 4340 sample, and (b) inside the SAE 4340 sample after applying 1.6 T high pass filter ...145
LIST OF ABREVIATIONS
2-D Two Dimensional
3-D Three Dimensional
AC Alternating Current
AI Artificial Intelligence
AMS Aerospace Material Specification ANFIS Adaptive Neuro-Fuzzy Inference System ASTM American Society for Testing and Material
AWG American Wire Gauge
BEM Boundary Element Method
CNRC-NRC National Research Council Canada
CRIAQ Consortium de Recherche et d'Innovation en Aérospatiale au Québec
DC Direct Current
DPHM Diagnosis, Prognosis, and Health Monitoring
DT Damage Tolerance
EC Eddy Current
ECT Eddy Current Testing
EDM Electrical Discharge Machined
EMF Electromotive Force
ETS École de Technologie Supérieure FAA Federal Aviation Administration FDM Finite Difference Method
FIS Fuzzy Inference System
FL Fuzzy Logic
HE Hydrogen Embrittlement
IA Impedance Analyzer
LSE Least-Squares Estimator
MANU Manufacturing
MAPOD Model-Assisted Probability of Detection
MF Membership Function
NASA National Astronautics and Space Administration
NDE Non-Destructive Evaluation
NDT Non-Destructive Testing
NLSE Nonlinear Least-Squares Estimator
NN Neural Networks
PDE Partial Differential Equation POD Probability of Detection POFI Probability of False Indication
QNDE Quantitative Non-Destructive Evaluation
SC Soft Computing
LIST OF SYMBOLS AND UNITS OF MEASUREMENTS
δ Standard Penetration Depth of Eddy Currents
ε
Electrical Permittivityμ Permeability
0
μ Permeability of Free Space
r μ Relative Permeability ρ Charge Density
σ
Electrical Conductivityω
Angular Frequency ∆R Variations of Resistance∆X Variations of Inductive Reactance
∆Z Impedance Variations Ω Ohm
°C Celsius Degree
a Flaw Size
50
a Average flaw size that is detected 50% of the times
90
a Average flaw size that is detected 90% of the times
90/95
a Flaw Size that is detected 90% of the times with 95% of confidence
â Signal Amplitude
dec
â Signal amplitude that discriminates rejected from accepted parts
sat
th
â Noise amplitude level A Ampere
A Electromagnetic Vector Potential
B Magnetic Field Density
D Electrical Field Density
E Electrical Field Intensity
f
Test FrequencyH Henry
H Magnetic Field Intensity Hz Hertz
0
J Electrical Current Density on Surface of Material
e
J Externally Applied Electrical Current Density ksi Kilopound per Square Inch
l Length of Magnetic Path
L Inductance
L Scan Line Parallel to the Notch Length
0
L Inductance of the Coil Placed in Air
N Number of Coil Turns
R Resistance
0
R Resistance of Wires S Siemens
X Inductive Reactance
INTRODUCTION Problem statement
Why quantitative non-destructive evaluation is important?
Manufacturing high quality systems and ensuring their integrity throughout their expected service life has been the concern of many industries for years. Different non-destructive testing (NDT) methods are developed/evolved to meet the industrial needs for quality control during the past century and it was not long after the World War II when their importance was rocketed. Following a catastrophic failure of an aircraft fuselage from Aloha airlines in 1987, the safety measures became tighter in aerospace industry. This incident thrusted the growth of public awareness about airworthiness. Following this accident, many conferences and meetings were held regarding this matter in order to gather NDT experts and collect their recommendations. As the outcome of these meetings, many research projects were put in place to develop new techniques for inspection of ageing aircraft, and to expand the knowledge and practice of quantitative non-destructive evaluation (QNDE) (Achenbach & Thompson, 1991). Since 1978, many fatigue/fracture-critical components of aircraft structures have been mandated by Federal Aviation Administration of US (FAA) to be designed based on the damage tolerance (DT) design principles (Pitt & Jones, 1997). The lifing philosophy strongly depends on the reliable defect detection and sizing results provided by QNDE methods. DT approaches use fracture mechanic models to analyze and predict the integrity of designed components. Based on these models, it is possible to estimate the largest defect size that can be tolerated by taking into account the material properties, loading conditions and the location of stress concentration in the critical crack site. Accordingly, the defect size that can be reliably detected by the NDT system, and would not grow larger than the critical size until the next scheduled inspection, shall be repaired and kept in service. Therefore, based on life-assessment procedures, the planning for periodical non-destructive inspection can be determined by the defect size that is reliably detected. The possibility of sizing these defects using the selected NDT method stands as a guide to such plannings. This
fact highlights the importance of QNDE in the safety maintenance of aircraft structures (Achenbach & Thompson, 1991).
Why eddy current split-D differential surface probes?
As the first step in inspection, it is essential to select the NDT method to best fit the intended applications, meaning that the capability of NDT system in detection of the flaw type of interest should be determined in advance. Fatigue failure of metallic aircraft components has resulted in many devastating accidents in the industry (Schijve, 1994). Fatigue cracks frequently form and grow within aircraft fuselage and engine components exposed to cyclic loads during their service life. If such cracks are open to surface, NDT methods such as visual testing, liquid penetrant inspection, and eddy current testing (ECT) are preferred for inspection. However, due to tight opening and small size of fatigue cracks, sometimes they can be detected neither by visual inspection nor by liquid penetrant method. ECT offers high sensitivity and detection reliability in dealing with such tiny cracks. Additionally, ECT method has gained a high acceptance in industries owing to factors such as the ease of application, minimum surface preparations and possibility of inspection over paint layers. Therefore, a number of ECT surface probes dedicated to detection of small narrow surface discontinuities have been developed and employed in past years. From this category, the split-D reflection differential surface pencil probes are best suited for detecting fatigue cracks for which the opening is very tight and the dimensions are small at the early stages of their growth. The probe is comprised of a circular driver and two D-shaped receiver coils. The differential configuration of oppositely wound receiver coils renders the probe insensitive to gradual variations of conductivity and permeability of test subject. Furthermore, their small sizes as well as the exceptional spatial stacking of the coils and ferrite cores inside them provide high sensitivity to abrupt changes of the surface features such as a breaking.
How to characterize defects using split-D probe’s signal (inversion)?
For defect characterization and sizing, it is essential to develop a forward model based on the underlying physical principles of the chosen NDT method, which is ECT in the present research. Forward models are used to predict the response of a testing method for a given material containing defects of known nature. These models are mainly developed analytically/semi-analytically based on the set of Maxwell’s equations for relatively simple problem assemblies involving the geometry of the ECT probe and the defect. Additionally, these models can be used as the core of inversion algorithms for characterization of an unknown defect based on the response of ECT system. In general, many of these algorithms aim to minimize the difference between predictions of the forward model and response of ECT system by readjusting model parameters iteratively. Therefore, forward models incorporated within the inversion algorithms should be computationally efficient since numerous iterations might be required for a model to minimize the difference between its response and that of ECT. Moreover, coupling these inversion algorithms with time-consuming conventional numerical methods, as a forward model, makes it impossible to perform real-time inversion.
Fortunately, owing to rapid advances in the field of soft computing (SC), nowadays, it is a more common practice to employ new SC strategies in inversion of NDT responses. In contrast to hard computing techniques based on solid binary logic that signifies precision and categoricity, SC engines provide tolerance of approximation since they have the human mind as their role model. To form SC engines, one would be able to integrate two or more different artificial intelligence (AI) techniques such as fuzzy logic (FL), neural networks (NN) and genetic algorithms. In this context, NN and FL are more frequently used together either in series or as an integration to form hybrid systems, in which the reasoning and inference power of FL can be complemented by adaptive learning nature of NN. These systems are great alternatives to the other complex inversion algorithms because of their high adaptability to changes, learning capability, simplicity of use, and low complexity of the theory. In case of ECT inversion, neuro-fuzzy hybrid systems could be directly trained using known
geometrical characteristics of defects and features of the corresponding signals as outputs and inputs, respectively. To obtain the input/output data, one method is to prepare a large set of samples containing defects of known geometries although; such experiments could be very costly. As an alternative, one could use the outcome of the numerical discretization techniques such as finite element modelling (FEM) to produce such data to train SC engines.
FEM is a diverse numerical method capable of dealing with complex geometries and modelling of inhomogeneous media. FEM simulations of low frequency ECT are mainly carried out based on a differential equation in frequency domain derived from the quasi-static approximation of Maxwell’s equations. The solver time for frequency domain formulation is markedly lower than that of time transient solutions. FEM has been previously used to model the interaction of eddy currents (EC) with different types of flaws. However, related studies devoted to differential probes are limited in number and thus, the competency of such tools to model these probe types requires further research. Additionally, EC signal predictions by FEM for arbitrarily sized defects could provide a foundation for many inexpensive model-based QNDE studies such as reliability assessment and defect characterization.
How to determine the reliability of inspection?
As another crucial step in QNDE, the reliability of the NDT method shall be assessed. It is well known in the field of NDT that different inspectors report different results for inspection of the same flaw. Such discrepancies are not only a matter of human error, but also could occur due to changes in non-destructive evaluation (NDE) system parameters and environmental conditions. Statistical analysis of inspection results, which considers inspection uncertainties, provides useful information on the probability of false indication (POFI) and probability of detection (POD). In industry, POD curves are used as a measure to quantify the detection reliability affected by the inspection system parameters. As an advantage, POD and POFI enable us to compare the reliability of detection for different NDE systems used for the same application. As implied earlier, the detectable defect size plays an
important role in life assessment models used for planning inspections. In this context, the higher reliability of NDE system results in higher POD and longer inspection intervals.
Why automated eddy current testing?
Recent advances in robotics have allowed industrialists to integrate new automated systems with innovative inspection techniques. In contrast to traditional approaches, employing these systems provides advantages such as shorter inspection time and lower labor cost while gaining an increased repeatability for scans. However, automated systems still need further improvements. In automated ECT, the imprecisions associated with the positioning and handling of probe during robotic scans can result in acquisition of erroneous signals. This in turn could give rise to misinterpretations of the signal and thus, taking wrong decision and actions. To address these issues, probe manipulation imprecisions, which are manifested by lift-off and tilt in ECT, are highly important and shall be investigated through modelling and experiments.
Summary
Nowadays, as the main challenge in NDT society, characterization and reliable sizing of defects are the subjects of a lot of ongoing research work. This is only achievable through development of reliable inversion algorithms. These algorithms are more frequently established in two ways; a) coupling an optimization algorithm with forward models developed according to physical principles of the NDT method, and b) developing SC algorithms using the AI methodologies and training them by input/output data. The first case requires development of either analytical or semi-analytical formulations, the derivation of which can be very awkward for complex problem geometries in electromagnetics. The second approach is less complicated and more flexible. To these algorithms, the input can be the characteristics of the NDT signal acquired for the defects while the output stands for the dimensions of the corresponding defect. Normally, to collect such input/output data, one needs to have access to a large set of defects with diverse geometries in order to provide
enough training for SC algorithms. Fortunately, this data could be generated through numerical modelling approaches, such as FEM. However, like the analytical approach, numerical models should also be validated through experiments. Apart from defect sizing, the reliability of detection should also be taken into account in QNDE studies. Regardless of the chosen NDT method, inspection responses are accompanied by variabilities. These variabilities are majorly introduced by parameters such as human, environment, and inspection system. To account for all the influential factors and provide a measure for the reliability of inspection, POD analyses can become handy statistical tools.
Research objectives
This research was conducted to fulfill the objectives of two projects titled as MANU-418 and DPHM-601, which were conceived by Consortium de Recherche et d'Innovation en
Aérospatiale au Quebec (CRIAQ). The first project started in 2011 and completed in 2015.
Three universities (École de technologie supérieure (ETS), Université Laval and Concordia University) as well as two industrial partners (Pratt and Whitney Canada, and L-3 MAS) were involved in this project. MANU-418 was mainly focused on performing automated NDT surface inspections of components using a 6-axis MOTOMAN robotic arm in order to locate and size the potential flaws. During this project, we had the support of National Research Council Canada (CNRC-NRC). The second ongoing project is defined by CRIAQ and started in 2015. Three universities (ETS, Université de Montréal, and École
Polytechnique de Montréal) were involved in this collaborative effort along with industrial
partners including Safran, Héroux-Devtek, and Bell Helicopter. The project aims to develop a NDT method to detect and evaluate hydrogen embrittlement in high strength steels.
Research Contributions
The present dissertation is a part of a larger study carried out in the framework of the aforementioned projects. The priority of the dissertation is to scrutinize and deliberate over the ECT of surface flaws through both experiments and numerical simulations in order to
satisfy the objectives of MANU-418 project. The followings stand for the original contributions of the present research in accordance to the MANU-418 project objectives. These contributions are presented in form of three journal papers embodied in chapters 2 to 4 of this dissertation and two conference presentations for which the abstracts are presented in APPENDIX I and II. The following provides a list of these publications in a chronological sequence:
• Ehsan Mohseni, Martin Viens, Demartonne Ramos França, « A Model-Based Study of The Effect of Semi-Elliptical Surface Notch Geometry on The Signal of a Split-D Eddy Current Probe » In NDT in Canada 2016 & 6th International CANDU
In-Service Inspection Workshop, November 15-17, 2016, Burlington, Ontario, Canada.
• Ehsan Mohseni, Martin Viens, « Sensitivity of Eddy Current Signals to Probe’s Tilt and Lift-Off While Scanning Semi-Elliptical Surface Notches - A Finite Element Modeling Approach ». In NDT in Canada 2017, June 6-8, Quebec City, Quebec, Canada.
• Ehsan Mohseni, Demartonne Ramos França, Martin Viens, Wen Fang Xie, Baoguang Xu, « Finite Element Based Modelling of Surface Cracks Scanning Using a Reflection Differential Split-D Eddy Current Probe ». Submitted to Journal of
Nondestructive Evaluation in June 2018.
• Ehsan Mohseni, Martin Viens, Wen-fang Xie, « Adaptive Neuro-Fuzzy Inference System Trained for Sizing Semi-Elliptical Notches Scanned by Eddy Currents ». Submitted to Journal of Nondestructive Evaluation in June 2018.
• Ehsan Mohseni, Hamid Habibzadeh Boukani, Demartonne Ramos França, Martin Viens, « A Reliability Study on Automated and Manual Eddy Current Testing ». Submitted to Journal of Nondestructive Evaluation in July 2018.
Paper #1, « Finite Element Based Modelling of Surface Cracks Scanning Using a Reflection Differential Split-D Eddy Current Probe », aims at evaluating the capacity and reliability of the FEM in simulation of absolute as well as differential ECT surface probes. The study covers the design and development of a FEM representing the interaction between a simple air-cored ECT probe and electrical discharge machined (EDM) surface notches. The design
of the probe and notches as well as the material properties were set to be identical to the ones used in a benchmark ECT study (Burke, 1988). Afterwards, the predictions of the model were compared to impedance measurements of the benchmark study. Moreover, the interaction between electromagnetic field of a split-D surface probe and rectangular through-width notches were simulated. Subsequently, to check the validity of the model, ECT signals generated by FEM simulations were compared with the experimental results. The simulations were carried out using COMSOL Multiphysics®, which is a commercially available FEM software.
Paper #2, « Adaptive Neuro-Fuzzy Inference System Trained for Sizing Semi-Elliptical Notches Scanned by Eddy Currents », considers the development of the FEM representing the interaction of the electromagnetic field of the split-D probe with semi-elliptical surface EDM notches. Subsequently, the validation of the model was carried out through comparing the model output with the outcomes of experiments. The sensitivity of ECT signals to common robotic positioning errors, emerging as probe’s lift-off and tilt during automated scans, were also studied and discussed. Followed by the model validation, semi-elliptical notches possessing different dimensions were modelled to constitute a size dependent table of ECT signals. Afterwards, the table of the model-generated ECT signals was utilized to train a SC algorithm for notch length estimation. Finally, the influence of variations in ECT signals, due to the robotic positioning errors, on the sizing results was studied.
Paper #3, « A Reliability Study on Automated and Manual Eddy Current Testing », holds a discussion regarding the assessment of the reliability of manual and automated inspections conducted by ECT split-D probe. In the study, the noise level connected to each scan technique is evaluated. The dependency of noise on surface roughness orientation as well as frequency is investigated. Additionally, the effect of crack orientation on variations of the signal amplitude for this probe is studied. Finally, POD curves were extracted by carrying out manual and automated inspections on several AISI 410 martensitic steel samples at three different frequencies. Consequently, the extracted noise levels and POD curves acquired for one technique were compared to that of the other.
Furthermore, as required by DPHM-601 project, the effect of hydrogen in martensitic SAE 4340 steel on the ECT probe’s impedance was investigated through FEM and experiments.
The results and observations are partly discussed in the recommendation section of this dissertation.
The structure of thesis
The present thesis is structured in 4 chapters. The first chapter is devoted to the review of previously published papers in the field of ECT. This chapter provides a better insight into the concepts of ECT modelling, reliability studies, and SC.
Second chapter encompasses the first submitted paper entitled “Finite Element Based Modelling of Surface Cracks Scanning Using a Reflection Differential Split-D Eddy Current Probe”. The chapter explores the possibility of developing FEM for ECT split-D probe and studies the interaction between its electromagnetic field and the surface notches.
The second paper submitted with the title of “Adaptive Neuro-Fuzzy Inference System Trained for Sizing Semi-Elliptical Notches Scanned by Eddy Currents” is presented in the third chapter. This chapter presents numerical studies regarding the ECT signal variations caused by the probe’s tilt and lift-off. Furthermore, details of using SC for inversion of ECT signals are discussed.
The final chapter presents the third submitted paper with the title of “A Reliability Study on Automated and Manual Eddy Current Testing”. In this chapter, the noise levels and PODs are extracted for both automated and manual inspections. Accordingly, the comparison between the two techniques is discussed in details.
CHAPTER 1 LITERATURE REVIEW
This chapter aims to review the concepts of ECT and its modelling as well as the application of AI and POD for ECT. Therefore, each of the following subsections is devoted to one of these subjects. Subsection one contains the physical principles of ECT, the main parameters affecting the signal of ECT and, different approaches that have been employed to model the ECT of surface notches with an emphasis on FEM. Subsection two provides a brief introduction to the basics of SC. In addition, a number of studies concentrated on classifying and sizing surface flaws by means of SC algorithms are reviewed there. In the last subsection, the statistical reliability study used for NDE systems is explained in summary. Furthermore, the application of such studies in ECT is described and the related published researches on this subject are presented.
1.1 Eddy current testing
Inspection of manufactured parts and systems during their service life is essential in order to ensure that they meet the design expectations and have a safe functionality during the specified period of service. These inspections shall be carried out in a proper way to not impair their properties and performance (Blitz, 2012). Non-destructive test methods used for such inspections have gained importance due to the rapid technological progress during the past 60 years in various industries such as transportation and energy, where the risks are high and strict precautions are required. In general, NDT name is assigned to a variety of methods and techniques concerned with quality, serviceability and integrity of a wide range of structures. Particularly in transportation industry, structures demand reliable, accurate and fast NDT solutions in order to avoid catastrophic accidents. ECT is one of the well-known electromagnetic NDT methods that is frequently used for these purposes. It is widely used to inspect conductive ferromagnetic and non-ferromagnetic materials since the method provides high sensitivity to surface and near surface flaws. ECT found its way to the aerospace industry in early years of its application when the aircraft structures were majorly made of
aluminum alloys. About 30 years into the service life of the first fleets, tragedies started to take place due to the fatigue failures. Ageing of airframes causes the material characteristics to degrade in components. In addition, all components are subjected to cyclic loads associated with taxing, pressurization, takeoff, landing, and depressurization. The changes in material characteristics along with the in-service cyclic loads in these structures mostly promote the formation of fatigue-induced cracks and stress corrosion cracks for which, very often, ECT is the preferred NDT method.
1.1.1 Electromagnetic induction
Placing a conductor loop in a time varying magnetic field brings about the electromagnetic induction process. In the process, an electromotive force (EMF) is induced in the conductor loop according to the Faraday’s induction law. EMF produces a current flow in the loop
where the induced voltage is proportional to the applied magnetic flux as shown in Equation 1.1.
ℰ = − Φ ( ) (1.1)
In this equation, the negative sign indicates the direction of EMF according to the Lenz’s law. As implied by this law, the current flowing in the loop is directed in a manner to generate a secondary field opposing the one that produced the current. In a more general case, when a solenoid is connected to an alternating current (AC) generator, as demonstrated in Figure 1.1(a), it is placed in its own electromagnetic field. The field alternates with the same frequency as the injected current does and therefore, a back-EMF is applied across the solenoid according to Equation 1.1. The potential difference across an ideal coil, with no ohmic resistance, is 90° out of phase relative to current flowing in it. Therefore, the out of phase voltage resists the changes of the current in the coil. This type of resistance formed by the coil self-inductance (L) is called inductive reactance (X). AC resistance of the coil, or so-called impedance (Z), is a complex value comprised of X as the imaginary part along with the
Ohmic resistance (R) of the wires as the real part. Equation 1.2 shows the impedance Z as a function of X and R.
= ( ) + ) (Ω) (1.2)
As shown in the Equation 1.2, X itself is a function of both L and angular frequency (ω). According to Equation 1.3, inductance of a long solenoid is directly proportional to relative permeability of the core inside the coil (μ), square of the coil turns (N) as well as the cross sectional area of the coil (A). Besides, it is inversely proportional to the length of the magnetic path.
= ( ) (1.3)
In Equation 1.3, μ0is the permeability of the free space, μris the relative permeability of the core, and l stands for the magnetic path (Hellier, 2013).
Figure 1.1 (a) Self-induction for a current carrying coil (Hellier, 2013) and, (b) interaction between the coil’s electromagnetic field and the
conductor leading to formation of ECs (Hellier, 2013)
As depicted in Figure 1.1(b), when a current carrying loop is brought near to a conductive component, the time varying electromagnetic field produced by the loop penetrates the component. Consequently, according to the Faraday’s law of induction, the induced EMF within the sample triggers the flow of circular and continuous currents called ECs. As stated
by Lenz’s law, the ECs flow in a direction to produce a secondary magnetic field that opposes the changes in primary one (García-Martín, Gómez-Gil, & Vázquez-Sánchez, 2011; Shull, 2016). The opposition of secondary field forms a reduced net flux in the loop in case of non-ferromagnetic conductors. As a result, the loop’s X would decrease as compared to the
X of the loop placed in air and thus, the loop’s impedance reduces. It is conventional to show
impedance variations on impedance plane as demonstrated in Figure 1.2.
Figure 1.2 Transformation from (a) an impedance plane to (b) a normalized impedance plane (Hellier, 2013).
Referring to Equation 1.2, one can notice that the change in the test frequency changes the X value and accordingly, the impedance. Due to this fact, the scale of impedance plane requires to be scaled every time the test frequency changes. To address that, impedance plane is used in normalized form. This transformation is depicted in Figure 1.2, where the figure at left represents an impedance plane and the right one shows the normalized axes. On the new plane, the values of inductive reactance and resistance for the isolated coil are at one and zero, respectively. Normalizing the vertical and horizontal axes are carried out according to Equations 1.4 and 1.5, respectively (García-Martín et al., 2011; Hellier, 2013).
= ⁄ (1.4)
ℎ = − (1.5)
In these equations, L and0 R are the inductance and the resistance of the inspection when it is 0
isolated in air, respectively. In the rest of this chapter, the impedance plane implies the normalized one.
1.1.2 Eddy current testing and influential parameters
EC penetration depth is limited by the test frequency as well as the permeability and the conductivity of test material. Skin depth of ECs is determined by the standard penetration depth which is a depth in the material at which the density of eddy currents reduces by 63% of the value at the surface. The standard penetration depth is commonly shown by δ. Its relation with frequency, conductivity (σ) and relative permeability is presented in Equation 1.6. The formulation is written based on, Equation 1.7, which is derived for the current density through solving Maxwell’s equations for electromagnetic plane waves
= 1 ( ) (1.6)
= (1.7)
In Equation 1.7, J is the current density at the material’s surface. The equation shows that 0
the EC penetration is not limited to one standard penetration depth however, as shown in Figure 1.3(a), the density of currents decreases exponentially as the currents develop deeper into the material. Furthermore, the phase of the currents flowing under the surface lags the phase of ones on surface. This phase variations are linearly related to the penetration depth according to Figure 1.3(b).
Figure 1.3 (a) Current density versus the penetration depth (Hellier, 2013), (b) changes in ECs’ phase versus their depth of penetration
(Hellier, 2013)
Although some parameters such as the coil configuration, size, and electromagnetic coupling between the test specimen and the coil do not affect the standard depth of penetration, but they change the absolute amplitude of eddy currents at any depth (Mix, 2005). The coupling of the coil and the test material is a function of the distance between the two. The distance is known as probe lift-off and fill factor in ECT for surface coils and encircling coils, respectively. Increasing the lift-off and decreasing the fill factor decrease the coupling and consequently, reduces the signal amplitude. Similarly, by tilting the EC coil with respect to the normal of the surface of the material the field reaching the material diminishes and as a result, the signal amplitude reduces. Aside from probe parameters, there are other parameters related to the test subject affecting the impedance of an ECT coil. In fact, any change in the characteristics of the material that affects the distribution of EC flow influences the coil’s impedance. Accordingly, ECT is advantageous in detecting and characterizing anomalies that have an effect on material properties. From this category, inhomogeneities in conductivity and permeability of the material, flaws located on surface or close to surface, as well as the variations in thickness when they are smaller than the sensing depth of ECs (i.e. 3δ) can be named. Each of these changes the probe’s impedance in a different manner and also provides a distinct signature on impedance plane.
Depending on the application, a wide variety of eddy current instruments and probes exists. In terms of the operation mode, EC probes can be divided into two main classes based on the configuration of their pickup coils; a) the absolute, and b) differential (Shull, 2016). As
demonstrated in Figure 1.4(a) and (b), absolute probes are comprised of a single receiver coil whereas differential probes possess two receiver coils, which are wound in opposite direction and connected differentially. As shown in Figure 1.4(b), EC probes can be configured to work in reflection (driver-pickup) mode, in which a primary coil is used for excitation while the secondary absolute or differential coils are meant for sensing. This type of configuration helps to avoid the temperature drift caused by the wire resistance since the current only flows in the driver coil whereas the current in receiver coils is very small; therefore, receivers do not experience heating (Cecco, Van Drunen, & Sharp, 1983). Furthermore, it would be possible to optimize the driver and receiving coils individually to achieve an enhanced probe’s flexibility and sensitivity (Burke & Ibrahim, 2004). Reflection probes have been exploited for diverse applications such as coating thickness and conductivity measurements, remote field ECT, and surface defect detection (Burke & Ibrahim, 2004).
Figure 1.4 (a) Absolute and (b) reflection
differential configurations of ECT probes (García-Martín et al., 2011)
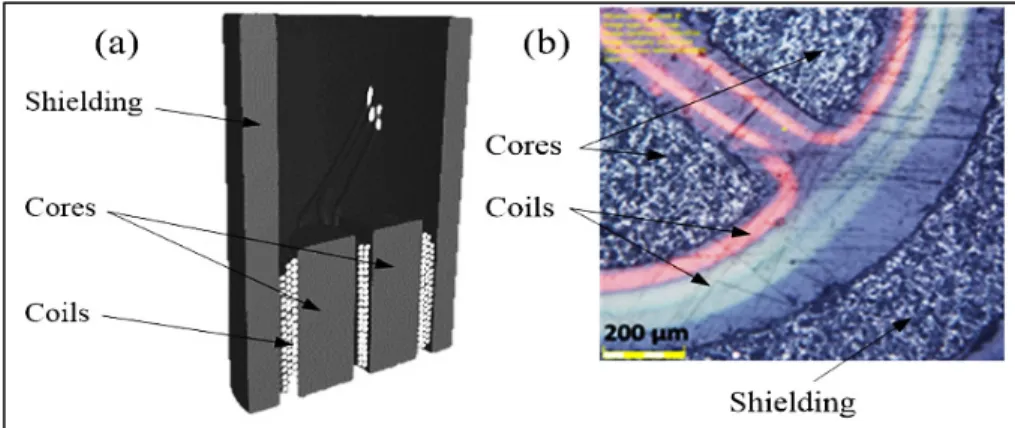
Split-D reflection differential surface probe which is comprised of one driver coil and two differentially wound D-shaped receiver coils is among the most sensitive ECT probes which, in particular, are used for the purpose of surface defects detection. Each of the receiver coils in this probe is filled with a D-shaped ferrite core and a cylindrical ferrite shield contains the assembly of the coils. A 3-D half model reconstructed by the X-ray tomography of the probe is depicted in Figure 1.5(a). The probe’s components are visible in a microscopic image that captures a quarter of the probe’s tip in Figure 1.5(b). A more detailed presentation of the
probe’s structure and geometry is provided later within chapters 2 and 3. The small footprint of the probe and its differential configuration makes it one of the most suitable choices for inspection of tiny surface breakings such as fatigue cracks.
Figure 1.5 (a) 3-D model of a split-D probe reconstructed by X-ray tomography and sectioned in half, and (b) microscopic image taken from the split-D probe’s tip.
1.1.3 Modelling in eddy current testing
In order to describe systems and to predict their response, analytical and numerical models are developed based on their governing equations. These models are called forward models, which are used to predict the measurement results by taking into account the given parameters describing the problem (Tarantola, 2005). Forward models have unique solutions for simple problem geometries and they could be expressed in entirely basic mathematical functions. This type of solution to a forward problem is called a closed-form solution. For instance, a partial differential equation (PDE) written based on the set of Maxwell’s equations can be derived for an ECT problem. Depending on the complexity of the ECT problem, one might be able to find a closed-form solution to infer the ECT probe’s field distribution and to evaluate the probe’s impedance, accordingly. Otherwise, it is very common to estimate the solution by means of semi-analytical methods as well as purely numerical calculations. Maxwell’s equations relating the material properties to electromagnetic fields in differential form are presented in Equations 1.8 to 1.11 (Shull, 2016).
∇ × = − ( − ) (1.8)
∇ × = + ( ) (1.9)
∇ ∙ = ( ) (1.10)
∇ ∙ = 0 ( ) (1.11)
where, E and H are electric and magnetic field intensities, respectively. D and B are electric and magnetic field densities, respectively. In addition, ρ is the charge density and J stands for the electrical current density. In Maxwell’s equations, the relation between field densities and intensities is specified by the constitutive equations presented in Equations 1.12 and 1.13, where ε symbolizes the electric permittivity of the material.
= (1.12)
= ⁄ (1.13)
A closed-form solution to the PDE derived for a single cylindrical air-cored coil placed over a semi-infinite conductor cladded with a conductor of a finite thickness was first suggested by Dodd et al. (C. Dodd & Deeds, 1968; C. V. Dodd, Luquire, Deeds, & Spoeri, 1969). Their forward model was a start to ECT modelling by providing the solution for electromagnetic vector potential (A) in the form of integrals of first-order Bessel functions. Their model made it possible to evaluate various electromagnetic quantities alongside the coil’s impedance using the vector potential. The model holds for linear, isotropic and homogenous materials and axisymmetric problem geometries. Their proposed solution exceeded earlier models in many aspects; it was more comprehensive as compared to the Hochschild’s model developed for an infinite coil (Hochschild, 1959), and more capable relative to the model proposed by Libby, based on transformer approach (Libby, 1971). The Dodd’s model was the foundation to many consecutive inversion studies, which are performed to determine the thickness and the conductivity of metal layers (J. R. Bowler & Norton, 1992; Moulder, Uzal, & Rose, 1992; Norton, Kahn, & Mester, 1989). Several semi-analytical models have been developed since the theory of Dodd et al. for different axisymmetric problem geometries. These