HAL Id: pastel-00563707
https://pastel.archives-ouvertes.fr/pastel-00563707
Submitted on 7 Feb 2011
HAL is a multi-disciplinary open access
archive for the deposit and dissemination of sci-entific research documents, whether they are pub-lished or not. The documents may come from teaching and research institutions in France or abroad, or from public or private research centers.
L’archive ouverte pluridisciplinaire HAL, est destinée au dépôt et à la diffusion de documents scientifiques de niveau recherche, publiés ou non, émanant des établissements d’enseignement et de recherche français ou étrangers, des laboratoires publics ou privés.
Anticipation of the access to the aggregate resource by
breaking present schemes in the long term
Mario-Luis Rodriguez Chavez
To cite this version:
Mario-Luis Rodriguez Chavez. Anticipation of the access to the aggregate resource by breaking present schemes in the long term. Applied geology. École Nationale Supérieure des Mines de Paris, 2010. English. �NNT : 2010ENMP0021�. �pastel-00563707�
MINES ParisTech Centre de Géosciences
35, Rue Saint Honoré, 77305 Fontainebleau CEDEX
présentée et soutenue publiquement par
Mario-Luis RODRIGUEZ CHAVEZ
le 8 septembre 2010
Anticipation of the access to the aggregate resource
by breaking present schemes in the long term
Doctorat ParisTech
T H È S E
pour obtenir le grade de docteur délivré par
l’École Nationale Supérieure des Mines de Paris
Spécialité “Technique et Economie de l’Exploitation du Sous-sol”
Directeur de thèse : Jacques SCHLEIFER
Jury
Peter MOSER, Professeur, Montanuniversität Leoben, Autriche Rapporteur Bert DE VRIES, Professeur, Universiteit Utrecht, Pays-Bas Rapporteur Isabelle CADORET, Professeur, Université de Rennes 1, France Examinateur
Patrick LEBRET, Docteur, BRGM, Orléans, France Examinateur
Arnaud COLSON, Ingénieur, UNICEM, Paris, France Examinateur Jacques SCHLEIFER, Docteur, MINES-ParisTech, Fontainebleau, France Examinateur
Ecole doctorale n° 398 : Géosciences et Ressources Naturelles
T
H
E
S
E
Abstract
The classic belief that construction minerals are available in virtually infinite quantities has been shattered in many European countries by the rising difficulties in gaining access to the resource. A growing demand in construction aggregates has to cope with growing social, political and environmental constraints. The fact that the aggregates market is mainly regulated by mechanisms on the scale of the local surroundings of a consumption centre makes macroeconomic predictions difficult.
Based on the French-Austrian research project ANTAG (Anticipation of the access to the
aggregate resource by breaking present schemes in the long term), a key issue of the
research work was the conception and building process of a macroeconomic top-down model representing the French aggregates market. It shows an approach of modelling macroeconomic mechanisms in order to simulate long-term scenarios and anticipate the effect of breaking actions. The model calibration of the baseline case is performed using the principle of System Dynamics. The submodels reflect the dynamics of demand, accessibility, production, transport and impacts upon the environment, and their interaction.
A supply-and-demand equilibrium for each macro-region had to be found for the competitive supply end, which has been achieved by introducing an innovative macroeconomic competition modelling approach. The production of each supply source follows from a mechanism which allocates parts of the whole market overcapacity to them. The monitoring of the overcapacity of the primary sources and the dynamics of niche markets and their interaction with the competitive market are important features of this work. Missing time series data has been reconstructed making strong hypotheses, so that the authorized reserves, the extraction capacity and the actual production of a supply source of a region could be linked to each other via feedback loops.
Since the average transport distances from the quarries to the consumption centres are permanently increasing, they are mainly responsible for the CO2 emissions within the construction minerals market. Modelling each mode of transportation allows comparative impact analyses of CO2, transport flows, land-use and energy consumption on the basis of scenario simulations.
Seven selected breaking scenarios are presented and their simulation results are compared to the base case. An economic slowdown will reduce civil engineering activities and consequently the impacts upon the environment. A substitution of aggregates and new technology and a reduction of demand would have the same effect. A significant increase of recycling capacity will result in a reduction of crushed rock and alluvial deposits production as well as impacts due to smaller transport distances. A move away from road transport towards alternative transport modes results in a poor CO2 reduction, since the secondary road transport now contributes to a larger extent and the waterway distances increase faster. A further scenario focuses on foreign aggregates penetrating the French market on a large scale and their transport. Local resources are being preserved at the cost of significantly higher transport flows. A shortfall of alluvial deposits due to a lack of social acceptability will result in a shortage of construction minerals. This lack of capacity can be balanced with an increase in hard rock capacity.
For the scenarios model feature extensions and implementations of secondary feedback mechanisms such as the transport capacity saturations or effects on the market equilibrium due to a new big player of the alternative modes were required. Uncertainty analysis using Monte Carlo method was performed for the base case and crucial submodel extensions.
Acknowledgements
In the first place I would like to express my deepest gratitude to Dr. Jacques Schleifer, deputy head of Centre de Géosciences at Ecole Nationale Supérieure des Mines de Paris, for giving me the great opportunity to write this thesis under his supervision. This study would not have been possible without his support, valuable hints and crucial contribution. I benefited a lot from his analytical approaches. I am grateful for his friendship.
As a member of the ANTAG-team, I would like to thank ANR for funding this research project. My thanks to our project partners UNICEM, in particular Mr. Jean-Louis
Dubus, for providing essential data and BRGM, in particular Dr. Patrick Lebret, for
their help in promoting this work.
I wish to record my gratitude to Univ.-Prof. Dipl.-Ing. Dr.mont. Peter Moser, Head of Department of Mineral Resources and Petroleum Engineering at the University of Leoben, who always generously makes his broad international relationships available for his students and introduced me to the responsible board of Ecole Nationale Supérieure des Mines de Paris.
It is a pleasure for me to thank Mr. Gilles Pelfrêne, Ph.D. student at Centre de Géosciences, whose stimulating suggestions and constructive comments, embedded in our friendship, very often provided a different perspective – even if our discussions sometimes veered off topic. My time as a Ph.D. student in France would not have been the same without him.
I am indebted to the secretaries of Centre de Géosciences in Fontainbleau, Mrs.
Catherine Le Caer, Mrs. Dominique Vassiliadis, Mrs. Catherine Quantin and to my
1
TABLE OF CONTENTS
PART I AGGREGATES – A FINITE AND INDISPENSABLE RESOURCE ... 8
1. Introduction... 9
1.1 State of affairs and challenges in the aggregates market... 9
1.2 The supply end ... 10
1.3 Social acceptability ... 10
1.4 Particular transport conditions ... 11
1.5 Price inelasticity... 11
2. ANTAG - a strategic project... 12
2.1 Aims and consortium ... 12
2.2 Breaking away from current practice... 13
PART II A MACROECONOMIC MODEL FOR AGGREGATES ... 15
3. Model specifications ... 16 3.1 Introduction... 16 3.2 Treating inhomogeneities... 16 3.3 Model structure ... 18 3.4 Modelling principle... 21 4. Model calibration ... 24 4.1 Demand of a macro-region... 24
4.1.1 Conception of the consumption submodel ... 24
4.1.2 Method of data reconstruction... 28
4.2 Calibration of a macroeconomic competitive market equilibrium... 29
4.2.1 Introduction ... 29
4.2.2 Early attempts to calibrate a market balance under strong simplifications... 30
4.2.3 Competition among actors... 31
4.2.4 Functioning during a simulation run and beyond the calibration period ... 34
4.2.5 Causal relations between reserves, capacity and production... 34
4.2.6 Data reconstruction of capacity and authorised reserves ... 36
4.2.7 Integration of social acceptability, industrial development, new authorisations .. 40
4.3 Characteristics and dynamics of niche markets ... 43
2
4.3.2 Mathematical modelling of the penetration of niche markets... 45
4.3.3 Niches markets data treatment... 46
4.4 Transport distance modelling... 47
4.4.1 Phenomena in aggregates transport... 47
4.4.2 Approach and choices made and in the modelling process ... 48
4.5 Computing cost development on a macro-economic scale ... 51
4.5.1 Difficulties in handling production costs... 51
4.5.2 Transport costs ... 53
4.6 Data summary and hypotheses for a base case model calibration ... 55
4.7 Robustness of mechanisms and calibration quality... 56
5. Base case simulation and uncertainty analysis ... 62
5.1 The baseline scenario ... 62
5.2 Computation of the impacts upon the environment ... 63
5.3 Sensitivity analysis... 64
5.3.1 Principles and simulation setup... 64
5.3.2 Parameters selection and testing ... 64
5.4 Model consolidation... 68
5.4.1 Calibration region per region... 68
5.4.2 Results of the base case consolidation... 69
6. Summary and closing remarks... 73
PART III SCENARIOS – BREAKING ACTIONS AND FEEDBACK... 75
7. Model feature extensions and add-ons... 76
7.1 Introduction... 76
7.2 Monitoring overcapacity ... 76
7.3 Creating additional capacity momentarily ... 79
7.4 Shift in market equilibrium due to penetration of a new primary source... 81
7.5 Multimodal transport split and saturation feedback... 83
7.5.1 Monte Carlo uncertainty analysis for the transport-split submodel extension... 87
8. Scenario simulation and assessment of results ... 89
8.1 Introduction... 89
8.2 Economic slowdown ... 90
8.2.1 Reasons of development and background... 90
8.2.2 Cross check by consolidation... 92
8.3 Increase in recycling capacity and an economic slowdown... 95
3
8.3.2 Consolidation and check-up on global repercussions ... 97
8.4 Substitution of aggregates and reduction of the demand ... 100
8.5 A move towards alternative transport in Rhône-Méditerranée ... 102
8.6 Imports become a primary supply source ... 106
8.7 Shortfall of alluvial deposits ... 108
8.7.1 Trigger and limitations ... 108
8.7.2 Consolidation on a national scale and limitations ... 111
8.8 Shortfall of alluvial deposits and a move towards hard rock ... 114
8.8.1 Implementation of additional capacity ... 114
8.8.2 Consolidation of six balanced regions... 115
9. Summary and closing remarks... 118
PART IV GENERAL CONCLUSIONS... 121
10. Model construction and application... 122
11. Limitations and potential sources of false interpretation ... 124
12. Future research and potential ... 126
REFERENCES ... 128
4
LIST OF FIGURES
Figure 1: Consumption of construction aggregates in France (UNICEM data basis) ... 9
Figure 2: France divided into six regions... 17
Figure 3: Linking the main submodels... 21
Figure 4: Stock-and-flow structure (excerpt of an ANTAG submodel) ... 22
Figure 5: Causal relations for the consumption submodel ... 24
Figure 6: Consumption submodel scheme ... 28
Figure 7: Market competition ... 31
Figure 8: Iterative distribution of overcapacity... 32
Figure 9: Turns as a function of overcapacity for the region Adour-Garonne ... 33
Figure 10: Consumption and sum of capacities of Adour-Garonne ... 33
Figure 11: Causal relations for the market submodel for the region Adour-Garonne ... 34
Figure 12: Causal loop diagram for the reserves-capacity-production interaction (balancing) ... 35
Figure 13: Causal loop diagram for the reserves-capacity-production interaction (reinforcing)... 36
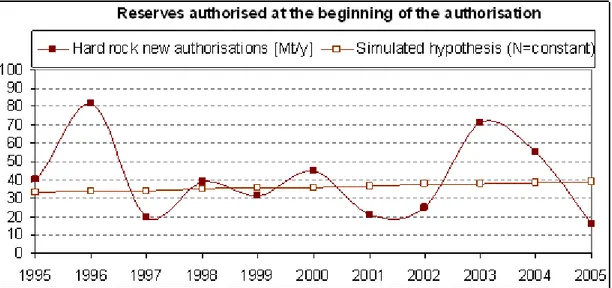
Figure 14: Authorisations of hard rock reserves (UNICEM data basis) and simulation results assuming a fixed N ... 40
Figure 15: Stock-and-flow structure for the supply end of a primary source interacting with the market competition mechanism... 43
Figure 16: Recycling capacity data points by UNICEM and forecast for Adour-Garonne ... 45
Figure 17: Public works and recycling capacity raw data treatment ... 46
Figure 18: Change of relative localisation of consumption centres and production sites... 48
Figure 19: Road transport distance model layout... 49
Figure 20: Rail transport distance model layout (identical for waterway) ... 50
Figure 21: Cost structure for hard and soft rock in 2005... 53
Figure 22: Model input and data for the population of Seine-Normandie... 57
Figure 23: Model input and data for the regional gross domestic product of Seine-Normandie ... 57
Figure 24: Model input and data for the substitution coefficient K of Seine-Normandie ... 58
Figure 25: Calibration results for the demand of new buildings of Seine-Normandie ... 58
Figure 26: Calibration results for the demand of public works of Seine-Normandie... 58
Figure 27: Calibration results for the total demand of Seine-Normandie... 59
Figure 28: Calibration results for the hard rock production of Seine-Normandie ... 59
Figure 29: Calibration results for the unconsolidated rock production of Seine-Normandie ... 59
Figure 30: Calibration results for the imports from other regions of Seine-Normandie... 60
Figure 31: Calibration results for recycling of Seine-Normandie ... 60
Figure 32: Calibration results for marine aggregates production of Seine-Normandie ... 60
5
Figure 34: Local demand uncertainty for Loire-Bretagne (sensitivity tested to local demand input parameters) -
starting time 1995... 66
Figure 35: Total CO2 uncertainty for Loire-Bretagne (sensitivity tested to local demand input parameters) - starting time 1995... 66
Figure 36: Recycling capacity uncertainty for Loire-Bretagne (sensitivity tested to recycling capacity limit) - starting time 1995... 67
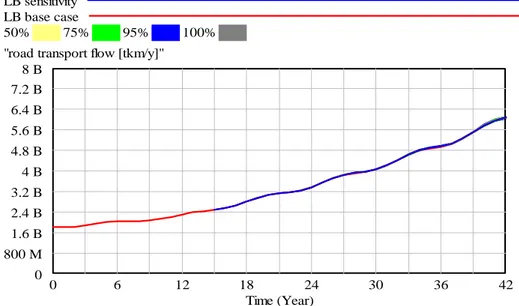
Figure 37: Road transport flow uncertainty for Loire-Bretagne (sensitivity tested to recycling capacity limit) - starting time 1995... 67
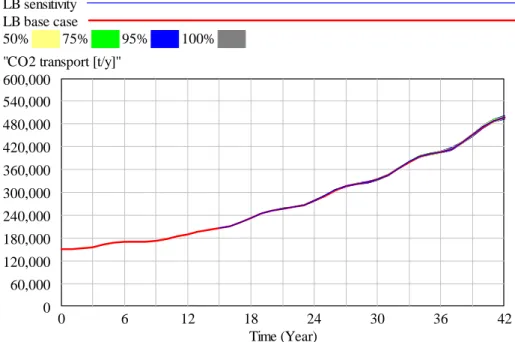
Figure 38: Transport -related CO2 uncertainty for Loire-Bretagne (sensitivity tested to recycling capacity limit) - starting time 1995... 68
Figure 39: Base case consolidation: consumption and capacity... 70
Figure 40: Base case consolidation: supply sources... 70
Figure 41: Base case consolidation: flow balance... 71
Figure 42: Base case consolidation: imports from other regions ... 71
Figure 43: Base case consolidation: impacts... 72
Figure 44: Monitoring overcapacity - causal loop diagram ... 77
Figure 45: Stock-and-flow structure for monitoring overcapacity (identical for hard and soft rock)... 78
Figure 46: Creating new capacity - causal loop diagram ... 79
Figure 47: Stock-and-flow structure for creating new capacity (e.g. hard rock balancing a shortfall of soft rock)... 80
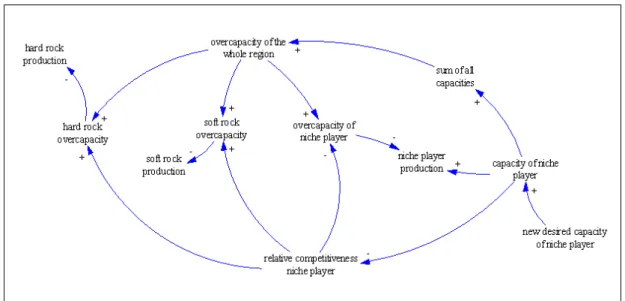
Figure 48: Causal relations for change in market balance due to a significant capacity increase of a niche player ... 81
Figure 49: Shift in market equilibrium due to penetration of a new big player... 82
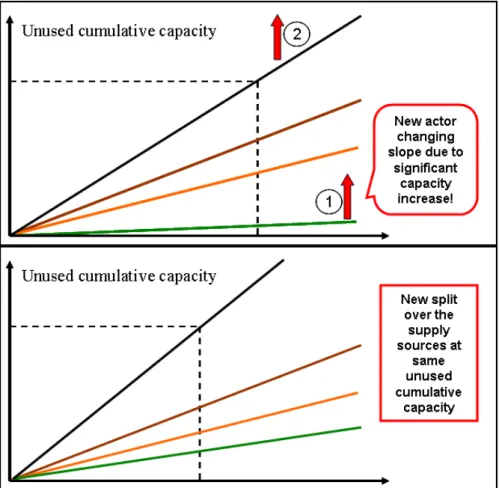
Figure 50: Causal loop diagram for the transport split (1) ... 83
Figure 51: Causal loop diagram for the transport split (2) ... 84
Figure 52: Stock-and-flow structure within the transport split submodel extension ... 86
Figure 53: Testing point of the model transport split extension (Vensim layout) ... 87
Figure 54: Waterway saturation uncertainty for Rhône-Méditerranée (sensitivity tested to waterway capacity) ... 88
Figure 55: Transport split between road and alternative modes uncertainty for Rhône-Méditerranée (sensitivity tested to waterway capacity)... 88
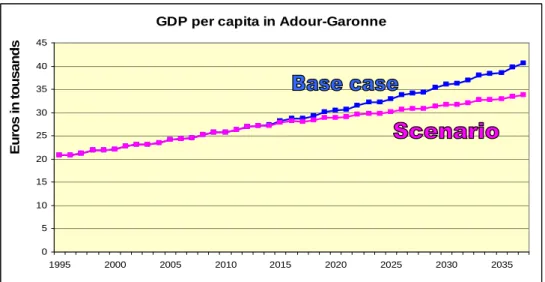
Figure 56: GDP per capita in the scenario of economic slowdown in Adour-Garonne ... 91
Figure 57: Local demand in the scenario of economic slowdown in Adour-Garonne ... 91
Figure 58: Hard and soft rock production in the scenario of economic slowdown in Adour-Garonne ... 91
Figure 59: Total CO2 emissions and total transport flow in the scenario of economic slowdown in Adour-Garonne... 92
Figure 60: Economic slowdown consolidation: consumption and capacity ... 93
Figure 61: Economic slowdown consolidation: supply sources... 93
Figure 62: Economic slowdown consolidation: flow balance... 94
Figure 63: Economic slowdown consolidation: imports from other regions... 94
Figure 64: Economic slowdown consolidation: impacts ... 95
Figure 65: Capacity in the scenario of recycling increase in Artois-Picardie... 96
Figure 66: Hard and soft rock production in the scenario of recycling increase in Artois-Picardie ... 97
6
Figure 68: Recycling and economic slowdown consolidation: consumption and capacity... 98
Figure 69: Recycling and economic slowdown consolidation: supply sources... 98
Figure 70: Recycling and economic slowdown consolidation: flow balance... 99
Figure 71: Recycling and economic slowdown consolidation: imports from other regions... 99
Figure 72: Recycling and economic slowdown consolidation: impacts... 100
Figure 73: Tonnes per square metres for buildings in Rhône-Méditerranée ... 101
Figure 74: Trend function for public works in Rhône-Méditerranée ... 101
Figure 75: Local demand and total CO2 in Rhône-Méditerranée ... 102
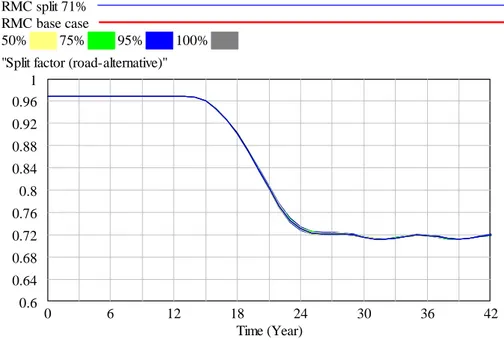
Figure 76: Transport split road-alternative transport modes and saturation of alternative transport modes in the scenario of alternative transport increase in Rhône-Méditerranée... 103
Figure 77: Transported freight by road and alternative transport modes in the scenario of alternative transport increase in Rhône-Méditerranée ... 104
Figure 78: Transport split between rail and waterway in the scenario of alternative transport increase in Rhône-Méditerranée... 104
Figure 79: Average transport distance for road, rail and waterway in the scenario of alternative transport increase in Rhône-Méditerranée... 105
Figure 80: Total CO2 and CO2 due to transport in 2035 (from top to bottom: waterway - rail - secondary road – road) in the scenario of alternative transport increase in Rhône-Méditerranée... 105
Figure 81: Imports capacity and unused capacity (right axis) in the scenario: imports increase in Rhône-Méditerranée107 Figure 82: Hard and soft rock production: scenario of imports increase in Rhône-Méditerranée... 107
Figure 83: Land-use of new authorisation: scenario of imports increase in Rhône-Méditerranée ... 107
Figure 84: Total CO2 and total transport flow in the scenario of imports increase in Rhône-Méditerranée ... 108
Figure 85: Unused capacity in the scenario of soft rock shortfall in Rhin-Meuse... 109
Figure 86: Soft rock production in the scenario of soft rock shortfall in Rhin-Meuse ... 110
Figure 87: Hard rock production in the scenario of soft rock shortfall in Rhin-Meuse... 110
Figure 88: Shortage of aggregates... 110
Figure 89: Shortfall of alluvial deposits consolidation: consumption and capacity ... 111
Figure 90: Shortfall of alluvial deposits consolidation: supply sources ... 112
Figure 91: Shortfall of alluvial deposits consolidation: flow balance ... 112
Figure 92: Shortfall of alluvial deposits consolidation: imports from other regions ... 113
Figure 93: Shortfall of alluvial deposits consolidation: impacts ... 113
Figure 94: Hard rock production in the scenario of soft rock shortfall and move towards hard rock ... 114
Figure 95: Unused capacity in the scenario of soft rock shortfall and move towards hard rock ... 115
Figure 96: Shortfall of alluvial deposits and move towards hard rock consolidation: consumption and capacity: ... 116
Figure 97: Shortfall of alluvial deposits and move towards hard rock consolidation: supply sources ... 116
Figure 98: Shortfall of alluvial deposits and move towards hard rock consolidation: flow balance ... 117
Figure 99: Shortfall of alluvial deposits and move towards hard rock consolidation: imports from other regions ... 117
Figure 100: Shortfall of alluvial deposits and move towards hard rock consolidation: impacts ... 117
8
PART I
AGGREGATES –
9
1.
Introduction
1.1
State of affairs and challenges in the aggregates market
Construction minerals are the second most exploited resource in France forming the basis of every infrastructure in the country. France consumes about 400 million tonnes of aggregates per year. The general trend of aggregates production in Metropolitan France in the last 30 years shows a clear increase in demand. The production history curve is cyclic, increasing by 0.8% on average per year (Figure 1). 93% of the current demand in aggregates is sourced locally and 95% of the aggregates are transported by road. The demand is satisfied by multiple types of supply sources, either of local origin or from abroad.
Producers, consumers, public authorities and society as a whole are currently confronted with a situation where future demand has to be satisfied under growing social, political and environmental constraints as well as rising difficulties in access. It is important to ask, therefore, how will the extraction profiles of the different supply sources evolve? And which transport modes will be used?
Figure 1: Consumption of construction aggregates in France (UNICEM data basis)
The characteristics considered specific for the aggregates market will be discussed as follows.
10
1.2
The supply end
The supply sources of aggregates are divided into different groups. Hard or crushed rock is extracted from quarries using explosives. In the last ten years crushed rock accounted for over 50% of national production. Alluvial deposits, unconsolidated or soft rock, are the second most exploited aggregate resource. They are extracted from streambeds and are usually of a better quality. Soft rock extraction has been continuously decreasing in the last years due to the fact that social acceptability has become a more and more important issue.
Marine aggregates and recycled material are regarded as secondary resources. Both together contribute to less than 10% of national demand. Marine aggregates which are extracted offshore resemble alluvial deposits in their nature, but since they are further away from most of the consumption centres, they are only used in particular regions of France today. Recycled minerals from building construction and public works are an alternative to classic mineral extraction, but their capacities seem limited at the moment. Imports from abroad are marginal, at the moment, but constantly increasing. In 2004 the national imports have exceeded the exports for the first time. Considering the fact that the demand is growing we have to ask how the production profiles could evolve in the next 30 years. Where are the limitations?
1.3
Social acceptability
Local aggregates extraction has important social impacts. Social acceptability is a determining factor in terms of reserves provision. This socio-political phenomenon is a result of stakeholders’ strategy, psychology and public debate. Aggregates, unlike other natural resources, are normally not exploited from underground mines, but from open-cast quarries. The most famous acronym in this respect is the so called NIMBY-effect (Not-In-My-BackYard) which expresses the attitude of people that there is a need for aggregates whilst simultaneously expressing the attitude of the same people against extraction from their own environment.
Campbell and Roberts (2003) reported in their case study of Michigan that people do not like industrial activity near their homes no matter how economically important they may be. There are several ongoing cases of conflicts, for example, even in places where
11
aggregates production is a key minerals industry accounting for 70% of direct employment. This opposition is due to negative externalities, especially of hard rock quarry extraction (Willis and Garrod, 1999). It is clear that social acceptability plays a key role in the aggregates market, but where exactly does it intervene and to what extent? Social acceptability is obviously different for cases of crushed and soft rock. The fact that this parameter and its evolution are difficult to measure made its handling a major challenge throughout this study.
1.4
Particular transport conditions
The construction aggregates market is a local market characterised by a short average transport distance. This is due to the low value-to-weight ratio of aggregates, which means that transport costs contribute a large amount to the overall costs. Global predictions are tricky because aggregates are usually available on a regional basis. Restrictive environmental policies make access to the resource close to consumption centres difficult. Furthermore, urbanisation and depletion of reserves near consumption areas result in increasing haul distances from the quarry to the consumption centre. 95% of the current aggregates are transported by road, and only 5% by rail and waterway. This makes road transport responsible for the bulk of CO2 emissions. A study covering the costs of relocating sand and gravel mines has been carried out by Jaeger (2006).
1.5
Price inelasticity
One surprising conclusion may be the fact that the demand of aggregates is not price-elastic (Nötstaller, 2003) with the exception of road construction and maintenance (Willis and Garrod, 1999). The reason for this could be that the low price of aggregates only contributes a few percent to the total of civil engineering costs. Another reason could be the need for great masses of aggregates combined with the difficulty of substitution.
12
2.
ANTAG - a strategic project
2.1
Aims and consortium
The thesis is based on the French-Austrian research project ANTAG (Anticipation of the access to the aggregate resource by breaking present schemes in the long-term; original title: “Anticipation de l’accès à la ressource granulats par rupture des schémas actuels à long terme”), which aims, first of all, at building a model representing the main mechanisms and principles which affect the access to aggregates in a realistic way. The model, once built, must allow simulating long-term evolutions of key economic and environmental parameters in the French aggregates market (Rodriguez Chavez et al., 2010a) over the next 30 years according to scenarios.
Issues currently discussed in the aggregates industry involve favouring alternative transport modes, in order to decrease road transport, which is the most pollutive transport mode; preserving of local resources by importing large quantities from abroad and/or increasing recycling capacities; repercussions on the shortfall of soft rock reserves and taking actions in order to balance the missing capacities. In this manner, the model must be flexible enough to allow the integration of new principles and mechanisms which could occur in the aggregates market. Its applications should not be limited to the current functioning of the aggregates industry and its mechanisms.
Environmental decision support systems have been built and applied in the past for different domains (Preface Environmental decision support systems, 2007) but not for the construction aggregates industry. The ANTAG-project targets the development of a System Dynamics model, which reflects the dynamics and interaction of demand, access, production, transport and allows an estimation of the future impact upon the environment on a national scale.
In this project, the actors in the French consortium are organised in a similar manner as described by Refsgaard et al. (2007). The organisations and their functions are:
13
– The Industry Partner - Union Nationale des Industries de Carrières et Matériaux de Construction (UNICEM);
– The Public Authority Partner - Bureau de Recherches Géologiques et Minières (BRGM);
– The International Partner - Montanuniversität Leoben - University of Leoben (MUL), also working on an equivalent project in Austria with two partners:
◊ Wirtschaftskammer Niederösterreich (Austrian Federal Economic Chamber); ◊ Wirtschaftsministerium (Austrian Ministry of Economics).
2.2
Breaking away from current practice
The strategy of the project is to reform the traditional approach, which treats the French aggregates market on the scale of its hundred départements. The aim is to offer a macroeconomic approach, which considers the aggregates market globally. The Schéma
Départemental des carrières (SDC) includes:
– an inventory of resources;
– the demand of construction minerals of each département; – a transport mode analysis;
– an investigation of the impacts of existing quarries; – an inventory of environmental data;
– an examination of targets aiming at reducing impacts upon the environment due to extraction and at favouring the rational use of construction material;
– an examination of targets for quarry rehabilitation after exploration.
The SDC covers the national economic interest, the demand of construction minerals of a département and of the neighbouring départements, protection of the environment, production sites and sensitive areas, and the need for balanced land management while promoting efficient use of natural resources.
Neither a geological nor a geographical inventory of resources will be considered within the ANTAG-project. The aim is to anticipate the macroeconomic effects of a trigger (a
14
“breaking action”), such the increase of alternative transport, on the aggregates market by simulating long-term evolutions of consumption, supply and transport and their impact upon the environment provoked by a trigger. The project follows the approach: model – apply – convince. An economic model representing the state of affairs is calibrated using historical data by the consortium of partners. The model is then applied by simulating different scenarios in order to study the repercussions upon the model. Finally the model and its applications are presented to external organisations in order to convince them of the long-term benefits the model and its applications can offer in the future.
15
PART II
16
3.
Model specifications
3.1
Introduction
The characteristics of the construction aggregates market show that predictions in this domain are a complex task. In order to build a decision support system tool, first choices regarding the model conception have to be made. The consortium of the ANTAG-project had to decide on a geographic subdivision of the French territory depending on the national inhomogeneities in production and consumption behaviour. Another decision which will be discussed concerns the general structure of the model for the access to aggregates. Furthermore the modelling principle and why it had been chosen will be explained. Those first choices will be explained in the following chapters.
3.2
Treating inhomogeneities
Since the ANTAG-project follows a macroeconomic approach, the first idea would be to treat France as one block. Building one single model for the whole French territory, however, would neglect geographical inhomogeneities in its consumption and production behaviour, geographical split of reserves and consequently in its transport flow pattern. In order to take into account those inhomogeneities a national subdivision is necessary. So the next step was to consider the market at a scale of the hundred French départements, the départements being the administrative units in France. This would have lead to the construction of one hundred models. Each model’s consumption, production and transport pattern would have had to be treated individually. The national consolidation of one hundred models would have been a tricky task, since at such a small scale, some regions might be importing 100% of their demand and others might be exporting 100% of their local production.
The Schéma Directeur d'Aménagement et de Gestion des Eaux (outline for the organization of the development and management of water resources) proposes a division into six distinctive macro-zones (Figure 2). The 100 départements are consolidated into:
17 – Adour-Garonne; – Artois-Picardie; – Rhône-Méditerranée; – Loire-Bretagne; – Seine-Normandie; – Rhin-Meuse.
The advantages are, on one hand, the fact that the division corresponds to a large extent to the consumption basins initially envisaged, and, on the other hand, the fact that it offers a good split between the supply sources, mainly for the soft rock reserves being in the hydrographical basins. Furthermore the model has to be applied to six regions. The sum of inter-regional flows in 2005 at this macro-scale is at about 10 million tonnes, which is less than 2,5% of the national consumption.
Figure 2: France divided into six regions
Adour-Garonne, for instance, is an autonomous region. The consumption of the whole region is produced within this zone. Loire-Bretagne exports construction aggregates to Seine-Normandie. Artois-Picardie is a transit region and a victim of the “domino-effect”. The region imports construction minerals from Belgium and exports to the region of Seine-Normandie. Seine-Normandie itself is a big consumer compared to its local production. Rhin-Meuse is a big exporter to foreign countries compared to its
18
consumption. Rhône-Méditerranée connects the Rhône to the Mediterranean Sea and can be served to a large extent by waterway.
The next step now is the construction of a general model outline and its application to each of the six macro-regions, each of them having a different behaviour and being defined by region-specific data. The subsequent consolidation of all the regions has to confirm that the sum of the transport flows into all zones equals the sum of the transport flows out of all zones. The difficulties in the construction of the model are obvious. The transfer of a microeconomic local market to a macroeconomic global scale will require optimistic hypotheses.
3.3
Model structure
The model is divided into submodels. This makes it easier to understand its structure. The submodels’ general structure is identical for each of the six regions in the base case model. The only exception is the market submodel, which varies from region to region due to differences in the production profiles of the supply sources and consequently in the market balance. The submodels are defined as:
– Consumption – Market
– Production hard rock
– Production unconsolidated rock – Multimodal transport split – Road transport
– Alternative transport – Energy
– Impacts upon the environment
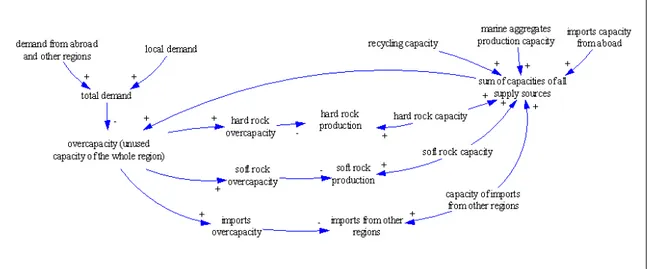
A simplified scheme linking the main submodels is presented below (Figure 3). The consumption submodel computes a local demand in aggregates for each year. The first decision made during its conception was to divide the local demand of a region into two
19
separate sectors: buildings and public works. The demand for each of the branches is driven by the input variables gross domestic product and population. The demand does not alter as a function of price, and the price has therefore been neglected in the consumption submodel. On the other hand the demand is mitigated by the substitution of aggregates by other material, and new technology reducing the quantity of aggregates needed in order to satisfy the same demand. The local demand is defined as the sum of the demand for buildings and public works. The total demand of a region is then defined as the sum of the local demand and the demand from other regions and abroad.
In the market submodel the total demand is satisfied by different supply sources. The submodels treating the two primary supply sources, hard rock and unconsolidated rock, basically function in the same way, but need to be separated for obvious reasons (different market development, different social acceptability, etc.). The secondary sources are handled in the market submodel.
The two production submodels are governed by mechanisms which allow the treatment of the following components:
– Production of the respective supply source; – The corresponding production capacity;
– The stock of authorised reserves at a given point in time;
– The new authorisations each year (which depend on the social acceptability of the respective supply sources);
– Average production costs per tonne for the respective supply source (depending on the energy consumption).
No data could be gathered for the accessible reserves, which are potential production volumes in regions where no authorisations have been given out, yet (and from which a certain volume of aggregates would have been transferred to the stock of authorised reserves).
20
The transport submodel focuses on how aggregates are transported from the production sites to the consumption centres. The three modes of transportation (road, rail and waterway) are modelled separately. Each one is considered specific in terms of:
– Average transport distance; – Transport volume;
– Transport flow (tonne-kilometres);
– Average transport costs per tonne kilometre for each of the modes;
The impacts upon the environment caused by production and transport volumes are gathered in the environmental-impacts submodel. The environmental impacts submodel stores the following parameters for the whole region:
– Energy consumed for all supply sources [l];
– Electricity consumed for all supply sources [kWh];
– Tonne-kilometres for all transport modes (transport flows); – CO2 emissions for all supply sources and transport modes; – Land-use [ha];
– Explosives used for hard rock production [t].
In order to perform a full analysis of these environmental parameters, the production of each supply source and the transport split must be determined on a macro-scale for each of the six regions. Comparative impact analyses on the basis of scenario simulations, however, require macroeconomic mechanisms, which adapt according to the scenario.
The main model structure of the constructed base case scenario, which represents the “business as usual” projected until 2037 (which corresponds to 30 years since the beginning of the ANTAG-project), is shown in Figure (3).
21 Figure 3: Linking the main submodels
This chain does not look like a classic supply chain known in standard economics. At the time of the basic conception of the model, feedback relationships to a submodel further upstream of the chain were not defined and other potential ones were not yet identified. Since in the current base case models, feedback relations already exist between the market- and the production submodels, this structure is not to be understood as a strict computational chain but rather as a logical sequence of submodels.
3.4
Modelling principle
It made sense to assume from the beginning of the study that, in principle, there are feedback relationships and interactions between variables from different submodels within each time step. A variable Y can be a function of X and Y might also influence X through a chain of cause and effect. However, it was not clear in the beginning where, how and under which circumstances these feedback relations might occur. It was clear, though, that it would make sense to introduce feedback at some point in the model and that there must be a possibility of doing so also at a later point in time. The modelling approach must thus allow the introduction of feedback not only in the early but also at the later stages of the model construction.
Judged from a long-term perspective, managing resources and environmental issues showed unexpected side-effects due to underestimation of the importance of feedback
22
effects (Pahl-Wostl, 2007). The introduction of System Dynamics software (U.S. Department of Energy’s, 1997) made sense, since it is specially designed to take feedback relationships into account. Even if some feedback loops, expected from the early stages of base case model construction, proved to be unrealistic throughout the study (as, for instance, the price effect on demand) System Dynamics has been kept as the modelling approach. The possibility of introducing (newly discovered) feedback relations at any stage of the model extension, as in scenario construction or refinement was crucial for this study.
Different System Dynamics packages have been used in related problems (van Vuuren et al., 1999; Salini and Karsky, 2003). The ANTAG-models have been built with the use of Vensim® Professional 5.4c. This icon-based programming language allows the introduction of endogenous variables. Therefore it uses stock-and-flow-structures. Stocks are defined by an initial level and are altered by possible flows into the stock and/or optional flows out of the stock. Stocks and flows can influence other variables and can also be a function of other variables and constants. Figure (4) shows a simplified excerpt of one of the submodels with a specific example of a stock-and-flow-structure in Vensim layout. System Dynamics computes the values of variables incrementally from one point in time to the next. The results are obtained in the form of time series.
23
In each time step the stock of authorised reserves is calculated as show in Equation (1).
t t t t
Ra
e
a
Ra
+1=
−
+
(1) Where 1 + tRa ... the level of authorised reserves in year t+1
t
Ra … the level of authorised reserves in year t
t
e … the aggregates extraction in year t (= production•waste factor)
t
a … the new authorisations in year t
The stock of authorised reserves is a quantity of reserves ready for extraction. Every time step the level is decreased by a flow of extraction (flow out) and increased by a flow of new authorisations (flow in). A simple feedback loop is introduced for the relationship between extraction and new authorisations: the new authorisations depend, among two other constant factors, on the extraction. Every feedback loop requires at least one stock.
In the ANTAG-models one time step has been defined to be a year. Due to data availability (see chapter 4.6) the starting time of the simulation will be 1995. Thus an initial value will have to be defined for each of the stocks in the model for the year 1995. A difficult part in the use of System Dynamics is the identification of stocks and flows. The challenge is the transfer from causal relations between variables to stock-and-flock structures as shown in Figure (4).
24
4.
Model calibration
4.1
Demand of a macro-region
4.1.1
Conception of the consumption submodel
The consumption submodel is aimed at computing the local demand per region. A separate handling and computation of the two sectors buildings and public works was necessary from the beginning due to the difficulty to directly linking the population to local demand. The demand is calculated for each of the branches before their tonnages are summed up (Figure 5). The main reason is that there is no constant ratio of tonnes consumed per inhabitant. This ratio is not only geographically dependent upon the zones but it also varies over time. Different modelling approaches have been proposed for the local demand of construction aggregates. An approach based on population projections has been performed by Jaeger (2006).
Before transferring the concept to stock-and-flow structures, we will first focus on the simple causal relations of this submodel. In the ANTAG-model the classic macroeconomic driver used is the gross domestic product per capita for each region. It drives both the demand of buildings and public works whereas both are mitigated by exogenous forces, one being the substitution and technology decreasing the demand in new aggregates, the other one being a demand-decreasing function at equal GDP for public works (Figure 5). This is not feedback within this submodel.
25
The population and the gross domestic product of each region have been modelled separately by expressing them as two different stocks. Even if the gross domestic product follows a flow concept, it has been decided to model it as a stock of which the value can easily be altered by a flow. The levels of the stocks are increased year by year by a flow each one describing their net increase. In order to introduce economic cycles the Time-function, which is automatically generated by Vensim, has been applied to the net increase of the gross domestic product. We can assume that the economic situation of country or a region will determine its construction activity, so introducing economic cycles in the model seems crucial, if we want to link GDP to the demand of aggregates.
t t
1
t
Population
NetIncreas
ePopulatio
n
Population
+=
+
(2) t tPopulation
CoeffPop
n
ePopulatio
NetIncreas
=
(3) Where 1 t+Population … population in year t+1
t
Population … population in year t
CoeffPop... calibrated constant
t t 1 t
DP
GDP
NetIncreas
eGDP
G
+=
+
(4)(
)
[
]
{
+ •cos + • •2π}
• • =GDP GrowthRate A B C D Time eGDP NetIncreas t t GDP (5) Where D C B A, , , … calibrated constantsTime… Vensim time function, starting with t=0 at the beginning of
26
The demand of construction aggregates is related to the change in building [m²/y] and the demand for public works [t/y]. We assume in the model that these two are related in a simple way to the change in GDP per capita. Initial attempts to relate GDP per capita to expenditures in the pubic works sector [€/year] and then convert the amount of euros into a demand of tonnes, failed due to a lack of data. Therefore, the demand of public works [t/year] is directly computed on the basis of GDP per capita.
The gross domestic product computes. In the buildings sector an impact delay of the gross domestic product per capita has been observed.
F
cap
ta
GDPperCapi
E
y
m
Buildings
t t+
•
=
+€
²
1 (6) Where F E, … calibrated constantsA peak in year t in the GDP per capita, for instance, will have a qualitative influence on the profile of the demand for buildings construction in year t+1. The fact that for this sector consumption data was available in square metres of new buildings per year and in tonnes of building construction and maintenance per year allowed a separate calibration of the substitution of aggregates by other materials and new technology for building construction. The meaning of this function is twofold:
– The use of a substituting material decreasing the number of tonnes used for a square metre of building construction;
– The technological progress enabling a more efficient use of aggregates for the same number of square metres.
The substitution is considered a stock [m²/t] of which the level is increased by a net flow at a constant growth rate (usually around 0,5% in the ANTAG-model).
t t
1
t
&
&
&
Tech
Subst
Tech
NetIncreas
eSubst
Tech
27 Tech Subst GrowthRate Tech Subst Tech eSubst
NetIncreas & t = & t • & (8)
The reciprocal K [t/m²] has to have an asymptotic shape since substitution has a natural limit. This factor has been decreasing in the last 10 years but, however, can never become zero. By multiplying K [t/m²] by the demand of new buildings [m²/year], we obtain the demand of building construction and maintenance in [t/year].
Concerning the branch of public works an equivalent function named “trend function for public works” reducing the demand at equal wealth has been implemented. The function describes, in principle, a trend of dematerialisation equivalent to the energy intensity described by De Vries et al. (1999).
G
cap
ta
GDPperCapi
cap
y
T
orks
ionPublicW
TrendFunct
y
T
icWorks
DemandPubl
t t t−
•
•
=
€
€
K
K
(9) Where G… calibrated constantTime
I
H
orks
ionPublicW
TrendFunct
+
=
(10) Where I H , … calibrated constantsNo separate handling of the effective demand of civil engineering constructive works and the substitution by materials disposable on site was available. Figure (6) shows the stock-and flow structure for the consumption submodel. The consumption submodel can also be found in Vensim layout in Appendix A.
28 Figure 6: Consumption submodel scheme
4.1.2
Method of data reconstruction
For the two consumption sectors the square metres of new buildings and tonnes of building construction and maintenance per year and of annual turnover in euros for public works were known. For the latter one only six points were available which made a calibration impossible. The approach followed was thus to rebuild the primary data of demand of public works in tonnes. Since data series existed for the local demand in tonnes and the demand of building construction in tonnes for each of the six regions, the demand of public works has been estimated by subtraction. The calibration has then been performed using the gross domestic product per capita as a driver based on that created data series. However the calibration quality for the public works sector and furthermore of the local demand was not satisfactory. A different method of the reconstruction of public works data was required.
This time the data series of the demand of public works in tonnes per year is built half on the basis of simulation output values. The square metres of new building have been simulated based on the GDP per capita evolution. By applying the equally calibrated factor of substitution and technology, we obtain the demand of building construction and maintenance in tonnes per year. This simulated demand of one of the two branches is now subtracted from the local demand data series. By this means an alternative series of
29
historic consumption of public works in tonnes has been built. As in the previous attempt, the demand in public works is simulated as a function of the GDP per capita. By applying the trend function a better agreement of historic data and simulation output can be found. The calibration of a System Dynamics model, as shown in this chapter, is ambiguous. There are multiple ways in which data can be reproduced. The demand of aggregates is a non-observable quantity similar to the energy demand reported by De Vries et al. (1999). It is implicit in the production data of the different supply sources and the building construction in square metres, the hypothesis being that the market is in equilibrium and that there is no shortage in aggregates.
4.2
Calibration of a macroeconomic competitive market
equilibrium
4.2.1
Introduction
The challenge in handling locally produced primary sources occurs as a result of fact that there is a need for constraints in terms of production as a response to demand. These constraints will be the stock of producible reserves (authorised reserves) and the maximum possible extraction (capacity). In terms of data for the supply end only data for production/extraction for all supply sources and new authorisations for local supply sources were available. No data for reserves or capacities were available. The estimation of data concerning the capacity of installations on site is difficult on a micro-scale. On a macroeconomic scale the data gathering is even more unpromising.
Which data was available for each part of the calibration will be explained in the respective section. The calibration of the supply end part of the model facing the current data situation was a major challenge of this research work. A comprehensive summary of the data situation faced in the ANTAG-project will be given at the end of the calibration section (chapter 4.6).
30
4.2.2
Early attempts to calibrate a market balance under strong
simplifications
Adding the local demand to the demand from other regions within France and from abroad to the local demand, results in the total demand which has to be raised by the multiple supply sources of the respective region. The first assumption considers that extraction will always be near the capacity that can be extracted due to installations.
t t t t
Ra
c
a
Ra
+1=
−
+
(11) Where 1 + tRa ... the level of authorised reserves in year t+1
t
Ra … the level of authorised reserves in year t
t
c … the extraction capacity in year t
t
a … the new authorisations in year t
The new authorisations are driven by the gradual variation of the total demand from one year to the other. The four supply sources hard and soft rock, recycling and marine aggregates produce their capacities, and the imports from other regions balance the difference of the sum of the all capacities and the total demand. The results of the simulation compared to the production data series showed that this mechanism fails in following the most important trends. This is due to the fact that the two primary sources hard and soft rock are so different, that the overall market trend cannot be used as a driver for new authorisations of the primary sources.
The most cogent reason, however, why this approach was not used, is the fact that it lacks a real form of competition. The competitiveness of all the sectors (except the imports from other regions) is 100%, since they all produce their whole capacity. Every sector will satisfy its capacity according to a given hierarchy. The remaining imports from other regions act like a balancer in case the demand has not been covered, which may make sense in the zone Adour-Garonne because the quantity imported is negligible. In Artois-Picardie, however the imports from abroad and other regions make up to 30% of the total demand, which would make it illogical to let the imports act as a compensator.
31
4.2.3
Competition among actors
If the total demand of a region is inferior to the sum of all its sources’ capacities, at least one of the actors will not be able to produce all of its capacity. This competition assumes that we are not confronted with a shortage of aggregates (known as Hubbert Peak in the oil industry) and that the market is in equilibrium which means that demand equals consumption. In classic economics market competition would normally be solved by intersecting the supply and the demand functions at the market clearing price. Since the demand of aggregates is not price elastic (Nötstaller, 2003), it cannot be used as a criterion for competition. The reason might be that the low price of aggregates only contributes a few percent to the total civil engineering costs. Another reason could be the need for great masses of aggregates together with the difficulties in substitution.
In order to explain the principle of a market equilibrium among the actors on the supply end on a macroeconomic scale (the demand coming from the consumption submodel and being given at this point in time), we will imagine a poker table of players taking turns in giving away parts of their potential production into a common pot (Figure 7). How much of the potential production will be given away by each actor, in other words, the difference between capacity and extraction of each source, will depend on his competitiveness relative to the other actors.
32
The distribution of the whole market overcapacity on each of the sources is evaluated iteratively by introducing turns (Figure 8). In turn 16, for instance, hard rock loses 7 units. Once the overcapacity to be distributed reaches 0 (or a value closer to 0 than the one resulting from the next turn played), the process is stopped. Since the same number of turns might be necessary to distribute the overcapacity in more than one year (for instance 11 turns for year 1995 and 2005) errors can occur.
Figure 8: Iterative distribution of overcapacity
The exercise will then result in a relationship between the number of turns played and the potential production lost compared to capacity for each of the sources. The total quantity which has to be distributed corresponds to the number of turns played, which in turn corresponds to the distribution of the lost quantity of each sector. The number of lost units of an actor at a certain turn and the calibrated sequence in which the actors lose in their potential production must apply in each year (Rodriguez Chavez et al., 2010b). Figure (9) shows the lost units of potential production for the participating sources and the played turn. If the overcapacity is high, as in year 1998 in the example in Figure (10), 16 turns (or rounds) are played (Figure 9), if it is low, as in year 2003, only 3 two are played. In year 2003 there is no need for playing more than 3 turns, since the whole overcapacity is already distributed over the supply sources at round 3.
33 Figure 9: Turns as a function of overcapacity for the region Adour-Garonne
Figure 10: Consumption and sum of capacities of Adour-Garonne
The resulting relationships have been replaced by linear functions, so that controlling the relative competitiveness becomes simpler. The steeper its slope is, the less competitive the supply source. Thus, the competition curves of the niche markets, producing at their capacity, will lie at the turn-axis. A scenario aiming at an increase of capacity of a niche market, for instance, could consider changing slopes, dependent on the new capacity launched on the market.
Figure (11) shows the causal relations corresponding to the market competition in Figure (9). Note that only 3 actors take part in this competition example (recycling, marine
34
production and imports from abroad are defined as niche markets). How the niche players have been treated will be discussed in section 4.3).
Figure 11: Causal relations for the market submodel for the region Adour-Garonne
4.2.4
Functioning during a simulation run and beyond the calibration period
The sequence in which actors lose their potential production, in other words their relative competitiveness, is calibrated on the basis of each source’s production data. However, how many turns will be effectively played in a certain year is obviously dependent on the total overcapacity of a region. If it is low in a given year, only a few turns might be played, whereas in a year with a high overcapacity a couple of turns might be added, so the whole unused quantity can be distributed. The mechanism’s advantage is that it instantly distributes the overcapacity over all the supply sources once the total demand and the total market capacity of a region are known.
4.2.5
Causal relations between reserves, capacity and production
In order to find and understand the parameters that are crucial for the described mechanism, causal relations between the reserves, the capacity and the production have been elaborated. Also, it will help us to understand which data is necessary in order to transfer the causal relations into stock-and-flow structures. The description follows the causal loop diagram shown in Figure (12).
35
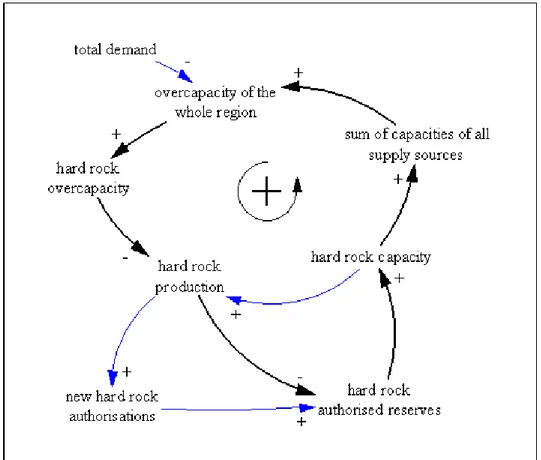
An increase in demand of a region will naturally cause a decrease in overcapacity, when subtracted from the sum of the capacities. A decreasing overcapacity of the region, ceteris paribus, causes a decrease in overcapacity of the supply sources (in this example hard rock). This will cause, ceteris paribus, an increase the hard rock production, which will cause an increase in new authorisations (if we assume that the more aggregates we produce, the more new authorisations we will get in order to maintain a high level of authorised reserves). A higher level in hard rock reserves causes an increase in hard rock capacity. We assume that these two are related to each other in a very simple way. A higher hard rock capacity will cause an increase in the overall capacity of the region which will then cause an increase in overcapacity. This loop is thus a negative or balancing loop. The small loop indicated in Figure (12) is also balancing. A decrease in hard rock reserves will cause a decrease in hard rock capacity. Consequently, the hard rock production is increased, ceteris paribus. An increase in hard rock production will cause a decrease in hard rock reserves, since the tonnage extracted is not available for production anymore. The two negative feedback loops already seem to give away at this stage that the model is stable.
36
However, one reinforcing feedback loop is traced within this causal loop diagram (Figure 13). A decrease in overall overcapacity causes a decrease in hard rock overcapacity, which, ceteris paribus, causes an increase in hard rock production. An increase in hard rock production causes a decrease in authorised reserves, which in turn causes a decrease in capacity. This causes, ceteris paribus, a decrease in the sum of capacities of the whole region. Consequently, the overall overcapacity decreases, as at the beginning of the loop. Balancing feedback loops generally stabilise the system whereas reinforcing or positive feedback loops generally destabilise them or can even make systems explode.
Figure 13: Causal loop diagram for the reserves-capacity-production interaction (reinforcing)
4.2.6
Data reconstruction of capacity and authorised reserves
The market balance mechanism and the causal relations described require the modelling of capacity. However, no data was available for the capacities of hard rock, unconsolidated rock or imports on a regional basis. Similar studies have confronted the same problem
37
(Giljum et al., 2008), whereas in our case the authorised reserves are indispensible. They have to be introduced, since they are a crucial constraining factor for production in the access to the resource.
Each quarry has a limited duration of authorisation and a maximum allowed extraction each year. By summing up the authorised tonnage of all quarries, we obtain a stock of reserves producible at a certain point in time. We decided to express this physical stock of authorised reserves for a huge number of quarries as a stock in System Dynamics.
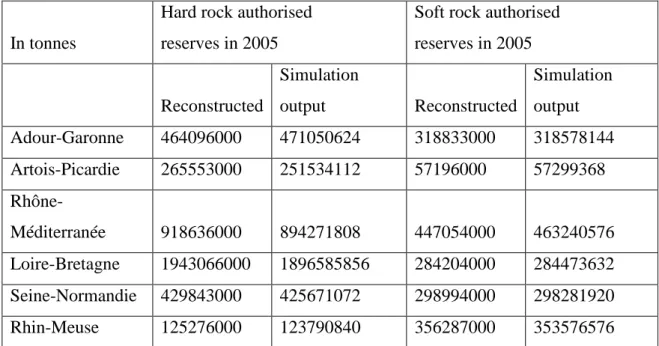
Available data allowed estimating only one data point for each of the two primary supply sources per region. This has been done by assuming that the authorised reserves of a quarry in 2005 equal the extraction in 2005 times the rest of the duration (number of remaining years) of its authorisation (Equation 12).
∑
• = 2005 REMAINING 2005 e N Ra (12) Where 2005Ra … stock of authorised reserves in year 2005
2005
e … extraction in year 2005
REMAINING
N … number of remaining years of authorisation
Having estimated a value for the authorised reserves of 2005, the next step was the reconstruction of what the initial value could have looked like. An initial value is required in order to allow the stock-and-flow structure starting to compute its incremental time series. Since production data were available back to the year 1982, an estimation of the stock of authorised reserves of the year 1982 was possible making a couple of hypotheses: First, the capacity of the year 2005, c*2005, was defined as the maximum extraction which occurred between the years 2000 and 2005. This hypothesis makes sense, since we can assume that an actor will not instantly reduce his capacity significantly from one year to the other, even if his capacity is not fully saturated. This would apply to the soft rock branch, since it is a declining sector. The same was applied for the growing hard rock branch. If in one year the production is higher than in the year before, the capacity itself has not necessarily been increased in that same year. The capacity adjusts to the market in the mid- or long-term, but not instantly. Thus this judging from a five-year perspective