N
O
.
48
T
AKING
A
DVANTAGE OF THE
D
EMOGRAPHIC
D
IVIDEND FOR
P
OVERTY
R
EDUCTION IN
S
UB
-S
AHARAN
A
FRICA
June 2016
Eva Medina, Sonia Chager
Universidad Autónoma de Madrid (UAM); eva.medina@uam.es; sonia.chager@uam.es
This policy brief examines how Sub-Saharan African countries could take advantage
of the demographic dividend in their fight against poverty.
The analysis of the different periods of the demographic transition can help in understanding how the changes in the age structure of a population can have an impact on the economic performance of a country in the form of “demographic dividend or bonus”. In other words, during the period in which a Demographic Window of Opportunity opens – that is, the late transition phase with declining birth rates and low death rates, thus the moment when the share of working age population increases and peaks – a country can benefit from the diversion of both public and household level expenditure (initially concentrated in the dependent children and elderly, i.e. health and education) towards investment in productive sectors, infrastructure and increase of savings.
From a geographical point of view, although a great deal of countries are already reaching later stages of the demographic window, some with major or minor success in terms of maximizing their demographic bonus, Africa, and more concretely Sub-Saharan Africa, is the only region that is still at an incipient state due to its late and slow demographic transition. Most Sub-Saharan African countries could follow the same principles and strategies as those of other successful countries, such as Asian countries, hence being able to realize a sizable demographic dividend. In this sense, the objective of this policy brief is to learn from Asia’s success in its demographic transition to identify the conditions under which the demographic dividend can materialize and be maximized in Sub-Saharan Africa. Therefore, by taking into account both the timing of their demographic transition and their socio-economic performance through different key indicators, it has been possible to target in strategic manner policy recommendations for each African country.
AFRICA ASIA
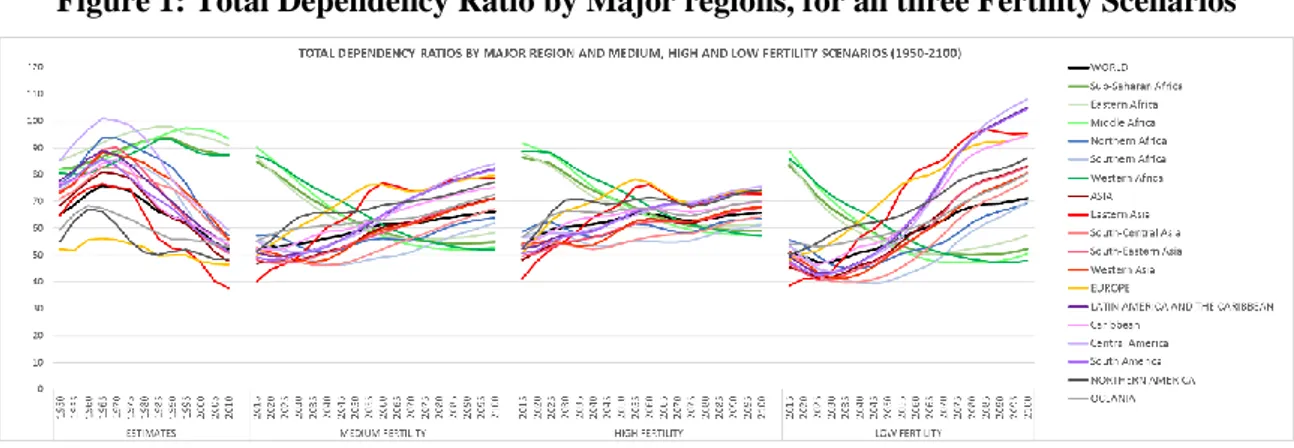
The main variable employed to illustrate the potential dependency burden that a country can face when advancing through its demographic transition has been the dependency ratio. In this regard, it is important to acknowledge the differences between Asia and Africa in their total dependency ratio trends (Figure 1). In particular, East Asia has had the fastest and most pronounced demographic transition, while Sub-Saharan Africa and its Western, Eastern and Middle regions are displaying an opposite trend to the rest of the world.
Figure 1: Total Dependency Ratio by Major regions, for all three Fertility Scenarios
Source: Own calculations from the United Nations World Population Prospects (2015)
The investigation distinguishes three stages. In the first stage the demographic dividend is quantify as the contribution1 of the dependency ratio to the change in the GDP per capita over time. The results reflect that, during 1960-2014, the demographic dividend has contributed in 0.7 percentage points (pp), every year, to the change in the growth of GDP per capita worldwide. By regions, demographic dividend has had a major impact in Asia when compared to the rest of the world, with Africa lagging behind (with the impact of the child dependency ratio on the growth of GDP per capita being almost half the size of Asia’s). Specifically, the contribution in Africa has been very low, less than 0.1 pp, due to the following reasons: the reduction of its child dependency ratio over this period has been much smaller (from 79.51 in 1960 to 74.92 in 2014 in Africa vs. from 70.45 to 37.61 for Asia in the same years); and the capitalization of this reduction has been less significant than in other geographic areas given its socio-economic characteristics. In the future, the evolution of demographic contributions for Africa on changes in the GDP per capita over time (Figure 2) will continue to be slow and longer in time, with a much lesser impact of dependency ratios with respect to Asia.
Figure 2: Evolution of the demographic contributions on changes in the GDP per capita over time
Source: Own calculations based on the econometric model estimates and the UN Medium Fertility Scenario
1
The contribution is calculated using an econometric model how the product between the estimated coefficient on the variable of interest and the value of the variable vary between time periods (Kelley & Schmidt, 2005).
EVIDENCE AND ANALYSIS
-0.6 -0.4 -0.2 0 0.2 0.4 0.6 0.8 1 1.2 1.4 196 5 197 0 197 5 198 0 198 5 199 0 199 5 200 0 200 5 201 0 201 5 202 0 202 5 203 0 203 5 204 0 204 5 205 0 205 5 206 0 206 5 207 0 207 5 208 0 208 5 209 0 209 5 210 0
Differences in the arithmetic effect Differences in log(D1) Differences in log(D2)
-0.6 -0.4 -0.2 0 0.2 0.4 0.6 0.8 1 1.2 1.4 196 5 197 0 197 5 198 0 198 5 199 0 199 5 200 0 200 5 201 0 201 5 202 0 202 5 203 0 203 5 204 0 204 5 205 0 205 5 206 0 206 5 207 0 207 5 208 0 208 5 209 0 209 5 210 0
However, these latter results describe an expected scenario for Africa without applying any policy action. In this regard, the situation could be improved if the region applied not only those economic policy actions oriented towards maximizing the gain from a demographic gift, but also demographic policies directed towards improving and accelerating the opening and widening of the window. Precisely, the second stage of the investigation aimed to identify the policy actions necessary to apply in those African countries that are yet to initiate their demographic window of opportunity, or are at a preliminary state. Regarding these policy actions, these were classified in terms of being either Demographic (allowing the demographic transition process to speed up, and reach levels in the dependency rates that are low enough to facilitate the opening of a demographic window of opportunity)2, or Socio-Economic (which permit to increase or maximize the benefits from the demographic dividend once it arrives)3.
The results obtained in the second stage of the investigation reflect that whereas Asia has had a general success in almost all the policy actions, Africa is still far behind. In particular, Asia can be regarded as an example of success, faring on both accounts – the demographic and socio-economic –, with the contribution of the economic factors being greater than the demographic ones. For the socio-economic variables, those policies that appear to be most relevant are those related to human capital, labour market, and gender; whilst for the demographic variables, the policies that stand out are those directly related to the opening of the demographic window of opportunity (the total fertility and infant mortality rates). It is also important to point out the relevance of the prevalence of HIV/AIDS for the African region, probably due to the high prevalence of the disease in the continent, which can be clear indication of the relationship between the existence of this epidemic and lesser gains from a demographic dividend.
Nevertheless, one cannot omit the reality that in Africa there is a great deal of heterogeneity. Not all African countries are following the same pattern in terms of the speed of the demographic transition and the socio-economic performance. In this sense, the third stage of the analysis was dedicated to targeting, in a strategic manner, policy recommendations for African countries depending on their shared similarities in terms of demographic and socio-economic performance. Thus, once the main key policy actions were identified in the second stage, the African countries were classified into four different groups that share similarities in terms of the policy prioritization. In more detail, when this latter clustering is combined with the timing and speed of each country’s demographic window of opportunity (Figure 3), the following groups of countries with similar policy strategies can be highlighted:
GROUP 1. Success is on the near horizon, but you face two problems: HIV/AIDS and total unemployment [all Southern Africa + Gabon]: These countries have had a relatively early opening of their windows of opportunity, although improvements are needed in their mortality rates (both infant and, especially adult). In fact, their greatest challenges are related to the hindrance of having amongst the highest mean prevalence of HIV/AIDS in the world, as well as suffering from equally high rates of total unemployment. On the positive side, they are succeeding on the human capital and female education fronts. Given their low total dependency ratios at the end of their windows, real and beneficial gains from a demographic dividend could be obtained. However, such an opportunity could be lost if they wait for too long in applying these measures.
GROUP 2. Very limited timing, focus on the labour market and, especially, in employing your female population [mainly Northern Africa + the islands + Djibouti]: This is the group that is thriving in the demographic domain, having the lowest averages in the total fertility rate, infant mortality rate, and prevalence of HIV/AIDS (except Djibouti). Additionally, on the educational sphere most of these countries are amongst the better educated in the total rankings, but their main challenge is to correct the gender issue in the labour market. Although Morocco, Tunisia, Mauritius, and Seychelles have already closed their windows of opportunity (or are about to do so), the remaining ones are still in time to introduce modifications in their policy strategy (correct the gender issue in the labour market), as the returns from the demographic dividend would be immediate.
2 Demographic Policies: Total Fertility Rate, Infant Mortality, Prevalence of HIV/AIDS, Contraceptive Prevalence,
Adolescent Fertility, Malnutrition, Migration, and Urbanization.
3
Socio-Economic Policies: Human Capital, Total Unemployment, Openness to Trade; Access to Water, Female Labour Force Participation, Female Unemployment, and Female Education.
Figure 3: African Demographic Windows of Opportunity according to the Total Dependency Ratios by the analysis cluster groups
Note: The opening of the window of opportunity has been established as the moment after the highest peak in the total dependency ratio that is leading towards a declining trend, whereas the closing of the window is the period in which the dependency reaches its minimum and is forecasted to increase. The colours highlighted in each country reflect the geographical region they belong to: blue is Northern Africa, black is Southern Africa, brown is Eastern Africa, green is Middle Africa, and red is Western Africa. Additionally, for each group cluster, the countries are organized from the earliest opening of their respective windows to the latest.
Source: Own calculations from the United Nations World Population Prospects (2015), and the World Bank (2015).
GROUP 3. Speed up the timing of the demographic window, you have good socio-economic tools in place [mostly Eastern Africa + a few Western/Middle region countries]: This is the set of countries who are front-runners in the labour market. The group has the lowest average total unemployment rate and the highest female labour force participation. Likewise, the level of education is relatively good for most, with a few being at the top of the ranking. However, the majority of these nations are laggards in terms of the demographic conditions (especially the total fertility rate). Therefore, the priorities in the policy implementation should be demographic related, working towards opening a real window of opportunity by decreasing the total fertility and infant mortality rates, as well as monitoring the
Legend: When 115 110 105 100 95 90 85 80 75 70 65 60 55 50 45 40 35 1960 1965 1970 1975 1980 1985 1990 1995 2000 2005 2010 2015 2020 2025 2030 2035 2040 2045 2050 2055 2060 2065 2070 2075 2080 2085 2090 2095 2100 Botswana South Africa Lesotho Namibia Swaziland Gabon Mauritius Algeria Tunisia Morocco Seychelles Cape Verde Djibouti Libya Egypt Ghana Zimbabwe Kenya Burkina Faso Cameroon Sao Tome and Principe
Ethiopia Togo Equatorial Guinea Guinea Madagascar Malawi Rwanda Uganda Angola Zambia Congo, Rep. Eritrea
United Republic of Tanzania
Sudan Senegal
Central African Republic
Comoros Mauritania Sierra Leone Guinea-Bissau Benin South Sudan Chad Côte d'Ivoire
Democratic Republic of the Congo
Somalia Gambia Liberia Mozambique Mali Nigeria Burundi Niger 4
TOTAL DEPENDENCY
RATIO:
signals the point in time in which there is a maximumreduction of the child dependency ratio. Thus, appropriate measures/policies ought to have been in place.
1
MEDIUM FERTILITY
2
3
HIV/AIDS epidemic. If such measures are not applied, it cannot be guaranteed that most of these countries will properly capitalize on the demographic dividend (given the forecasted high dependency ratios at the end of their windows).
GROUP 4. Watch out! Urgent action is required in three spheres: fertility, infant mortality and education [mostly Western/Eastern Africa + some in Middle Africa + Sudan]: Unfortunately, this is the group that will have to tackle more obstacles in order to secure a future demographic dividend. They are the weakest in terms of the demographic factors (except for the prevalence of HIV/AIDS), sharing the highest total fertility and infant mortality rates. Moreover, the least educated citizens are in this group, as all the main laggards in terms of human capital and female education are located in this cluster. Essentially these countries’ only advantages are labour market related (total unemployment rate and average female labour force participation). They will all have to apply greater efforts so as to further decrease their total dependency ratios and transform their current window projections in order to obtain fruitful benefits from a demographic dividend.
According to the results obtained in the present investigation in terms of the specific policies that guarantee to take advantage from the benefits of a demographic gift, Africa’s key challenges that merit special attention are the following:
1) Its High Fertility is a serious obstacle, markedly because the equally high infant mortality demands more children so as to guarantee a major number of survivors; thus, policies oriented towards the acceleration of the demographic transition (particularly the fertility decline) are required, which include improving the survival of infants, delaying the age at first union and at first birth (mainly reducing adolescent fertility), and major investments in family planning programs (with greater political commitment in providing modern methods) since unmet need for contraception is higher in Africa than elsewhere;
2) the region needs to improve its Human Capital and Employment necessities, given its shortage in terms of qualified and skilled labour, so increasing the educational level of African citizens and favouring job creation on a massive scale is rather urgent, with a special attention to gender equity; 3) a positive advantage is the Role of Women in Africa since the female labour force participation is
relatively high, therefore, strengthening and maximizing women’s participation in more qualified and better jobs, as well as keeping girls in schools, becomes imperative in order to avoid their inclusion in the dependent group, alongside children and the elderly;
4) all previous policy accomplishments could become futile if no action is done in the battle against HIV/AIDS, especially in the most affected countries in Sub-Saharan Africa, as it mostly threatens the working age population; henceforth, efforts in reducing Adult Mortality are a prerequisite, namely through a better control of the three big killers in Africa (malaria, HIV/AIDS, and tuberculosis), and avoiding as much as possible debilitating wars that destroy the foundation that the demographic gift offers;
5) it should be acknowledged that not all countries are expected to have a fatalist outcome (being front-runners in various demographic or socio-economic domains), which calls for strategic policy action through resources allocation adapted to each country’s context and characteristics;
6) It is crucial to recognize the Heterogeneity within countries in terms of socioeconomic factors since the leading groups will benefit more than the laggards, that is, the poor people with less access to information and job opportunities will not be able to gain as much from the demographic dividend than those that are better off.
Although all these measures would facilitate to increment the gains from a potential demographic dividend in Africa and, thus, boost its development, not all of them have the same priority according to each individual country. In this sense, given the great heterogeneity existent in the African continent, the policy recommendations are classified in four groups of countries (Table 1), each with specific implications.
Table 1: Policy implications and recommendations by groups of countries
GROUP
1:
Success is on the near horizon, but you face two problems: HIV/AIDS and total
unemployment
Countries: Botswana, Gabon, Lesotho, Namibia, South Africa, Swaziland
POLICY RECOMMENDATION:
Their priorities in terms of urgent policy action should be focused mainly on the AIDS epidemic and the total unemployment. To a lower extent, additional measures to further reduce infant mortality ought to be considered as well. Regarding the timing available to apply all these policy measures:
Botswana and South Africa should have already done their homework. In this sense, Botswana has already been slowly improving on these particular policy areas, yet greater efforts should be made in order to fully maximize the gains from the demographic dividend.
The remaining countries (Gabon, Namibia, Swaziland, and Lesotho) should apply all these critical policies before the year 2030-35 and, so far, they are faring negatively. Thus, if the right measures are not implemented, the opportunity from a demographic gift will be most definitely lost.
GROUP
2:
Very limited timing, focus on the labour market and employing your female
population immediately.
Countries: Tunisia , Libya, Algeria, Egypt, Morocco, Djibouti, Seychelles, Mauritius, Cape Verde
POLICY RECOMMENDATION:
The main problem these countries are facing is related to the participation of women in the labour market, as well the high total unemployment rate. Thus, the strategy in terms of policymaking should be focused on implementing greater efforts in this particular domain.
Limited timing to capitalize on the demographic dividend:
Some countries have already closed or are immediately about to close their demographic windows of opportunity (Tunisia, Seychelles, Mauritius, and Morocco).
Regarding the remaining countries, they should have already introduced modifications in their policy strategy during the decade of the 2000’s so as to maximize the reaping from the demographic gift. On this regard, some countries in this group are slowly headed towards this direction in terms of total unemployment (Algeria and Cape Verde), however, the picture for female labour force participation is somewhat worrisome (with the exception of Libya).
GROUP
3:
Speed up the timing of the demographic window, you have good socio-economic
tools in place
Countries: Angola, Burkina Faso, Cameroon, Congo Rep., Ethiopia, Equatorial Guinea, Eritrea,
Ghana, Guinea, Kenya, Madagascar, Malawi, Rwanda, Sao Tome and Principe, Tanzania, Togo,
Uganda, Zambia, Zimbabwe
POLICY RECOMMENDATION:
Taking into account that these countries fare well in the socio-economic conditions, their priorities in the policy implementation should be demographic related. In other words, they ought to actually work towards speeding up and procuring a real window of demographic opportunity by decreasing both the total fertility rate and the infant mortality rates, as well properly monitoring the HIV/AIDS epidemic. In this sense:
Some countries are already headed towards this direction: Eritrea, Madagascar, Rwanda, and Ethiopia have been impressively improving their positions in the rankings on both the fertility and infant mortality. Also, Tanzania, Uganda, and Malawi have succeeded in lowering their infant mortality rates.
However, Equatorial Guinea has been worsening on both the total fertility and the infant mortality rates; whereas Tanzania, Republic of Congo, and Zambia have worsened on the fertility rate yet have been improving on lowering their infant mortality.
Since the socio-economic factors are in their favour, a large capitalization of the demographic dividend is foreseeable if even greater improvements are achieved in the demographic area. Given that the maximum gain from a dividend is expected to be reached on the decade of 2020’s in the majority of these countries, the timing to apply any policy strategy ought to be before this time period.
GROUP
4:
Watch out! Urgent action is required in three spheres: fertility, infant mortality and
education
Countries: Benin, Burundi, Central African Republic, Chad, Comoros, Congo, Dem. Rep., Cote
d’Ivoire, Gambia, Guinea-Bissau, Mali, Mauritania, Mozambique, Niger, Nigeria, Liberia,
Senegal, Sierra Leone, Somalia, South Sudan, Sudan
POLICY RECOMMENDATION:
These countries ought to immediately implement measures directed towards increasing their overall level of human capital, with greater efforts in providing further education to their female population. By doing so, it will allow to trigger and complement the other important policy actions regarding the fight against infant mortality as well as the decrease of the total fertility rate. In a more detailed note:
On the positive side, three countries have been improving not only their positions in the educational front but also in the demographic domain (Benin, Sierra Leone, and Burundi);
On the negative side, a group of countries have dropped several positions in the education factors (Democratic Republic of the Congo, Liberia, Senegal, and to a lower extent, Sudan, Central African Republic, and Niger). Regarding the demographic conditions, a few countries have lost positions in both fertility and infant mortality indicators (Mauritania, Comoros, Côte d’Ivoire, and Nigeria); whereas others only in infant mortality (Somalia and Central African Republic); while others only in the fertility proxy (the Gambia and Mozambique).
Concerning the timing necessary to apply all these strategic policy actions, this particular cluster presents more heterogeneity in terms of the year projected to achieve maximum gains of the dividend. In any case, it is possible to observe two different schedules: a first group should not wait longer than the threshold years between 2020-2035 to apply their policy implementations; and a second group have slightly more time under the current projections (until 2040-2055).
The main objective of the present investigation has been to build a simulation model so as to design different policy actions towards poverty reduction in Africa. The analysis has been based on the premise that demographic changes in the age structure of a population can have an impact on the economic outcome. In this sense, analysing the different periods of the demographic transition in a country can help in understanding, anticipating, and identifying plausible scenarios that can either be threatening situations or windows of opportunity. Hence, in order to obtain a desirable future for the Sub-Saharan region in which the living conditions are substantially improved, a precise course of action that is adapted to each country’s characteristics and necessities is of the essence. In other words, the contribution in this study follows the line of analysis that consists of the evaluation of policies that facilitate the harnessing of a demographic dividend. By doing so, it will permit to shed light on those elements that ought to be prioritized in the present African political agendas so as to maximize the gains from a demographic gift and, therefore, contribute to the poverty decline.
Methodology
In order to provide empirical evidence on the subject matter, the present investigation has employed the econometric analysis. The estimations were done for the years 1960-2014, for a sample of 132 countries with the total sample of observations (742) being aggregated into five-year periods. In this regard, the estimations were first carried out using the Ordinary Least Square (OLS) method for panel data with country fixed effects. However due to the existence of endogeneity between population and economic growth, a Two Stage Least Square (2SLS) estimation method was applied, using as instrumental variables the lags in the demographic variables. The data was collected from the United Nations World Population Prospects 2015; the Penn World Tables (version 8.1); the Barro & Lee 2013 database; Freedom House (2015); and the World Development Indicators 2015 (World Bank database).
PROJECT NAME NOPOOR – Enhancing Knowledge for Renewed Policies against Poverty
COORDINATOR Institut de Recherche pour le Développement, Paris, France
CONSORTIUM CDD The Ghana Center for Democratic Development – Accra, Ghana
CDE Centre for Development Economics – Delhi, India
CNRS (India Unit) Centre de Sciences Humaines – New Delhi, India
CRES Consortium pour la Recherche Èconomique et Sociale – Dakar, Senegal GIGA German Institute of Global and Area Studies – Hamburg, Germany GRADE Grupo de Análisis para el Desarrollo – Lima, Peru
IfW Kiel Institute for the World Economy – Kiel, Germany IRD Institut de Recherche pour le Développement – Paris, France
ITESM Instituto Tecnológico y de Estudios Superiores de Monterrey – Monterrey, Mexico LISER Luxemburg Institute of Socio-Economic Research – Esch-sur-Alzette, Luxemburg OIKODROM - The Vienna Institute for Urban Sustainability – Vienna, Austria
UA-CEE Université d’Antananarivo – Antananarivo, Madagascar UAM Universidad Autónoma de Madrid – Madrid, Spain UCHILE Universidad de Chile – Santiago de Chile, Chile
UCT–SALDRU University of Cape Town – Cape Town, South Africa UFRJ Universidade Federal do Rio de Janeiro – Rio de Janeiro, Brazil UNAMUR Université de Namur – Namur, Belgium
UOXF-CSAE University of Oxford, Centre for the Study of African Economies – Oxford, United Kingdom
VASS Vietnamese Academy of Social Sciences – Hanoi, Vietnam
FUNDING SCHEME FP7 Framework Programme for Research of the European Union –SSH.2011.4.1-1:
Tackling poverty in a development context, Collaborative project/Specific International Cooperation Action. Grant Agreement No. 290752
DURATION April 2012 – September 2017 (66 months)
BUDGET EU contribution: 8 000 000 €
WEBSITE http://www.nopoor.eu/
FOR MORE
INFORMATION Xavier Oudin, Scientific coordinator, IRD-DIAL, Paris, France, Delia Visan, Manager, IRD-DIAL, Paris, France delia.visan@ird.fr oudin@dial.prd.fr Tel: +33 1 53 24 14 66 Contact email address: info@nopoor.eu
EDITORIAL TEAM
Edgar Aragon, Laura Valadez (ITESM) Heidi Dumreicher (OIKODROM) Anne-Sophie Robilliard (IRD-DIAL),
The views expressed in this paper are those of the authors and do not necessarily represent the views of the European Commission.

![[PDF] Cours d’initiation au langage Perl : les variables et fonctions | Cours informatique](data:image/gif;base64,R0lGODlhAQABAIAAAP///wAAACH5BAEAAAAALAAAAAABAAEAAAICRAEAOw==)