ARRU et al. Early-Warning System Perception
Early-Warning System Perception:
a Study on Fire Safety
Maude ARRU
LAMSADE CNRS UMR 7243
Paris-Dauphine University,
France
[email protected]
Brice MAYAG
LAMSADE CNRS UMR 7243
Paris-Dauphine University,
France
[email protected]
Elsa NEGRE
LAMSADE CNRS UMR 7243
Paris-Dauphine University,
France
[email protected]
ABSTRACTWarnings can help prevent damage and harm if they are issued timely and provide information helping responders and population to adequately prepare for the disaster to come. Today, there are many indicator and sensor systems that are designed to reduce disaster risks, or issue early warnings. In this paper we analyze the perception that people have from security management systems and we propose an indicator to measure Early-Warning System perception for people-oriented decision support. To illustrate our approach, we present a study of the fire safety system in our University.
Keywords
Early-warning systems, perception, people-centered systems, indicators, fire safety.
INTRODUCTION
In the year 2012 alone, the global community invested nearly 18 billion US$ to assist those affected by natural and man-made hazards (GHA, 2013). A growing number of professionals and volunteers strive to help (HHI, 2010), yet it seems that we do not learn to manage and mitigate disaster risks: the consequences of disasters in terms of number of lives lost, economic damages, or number of people affected do not stop to increase. Despite the growing number of publications on risk, vulnerability, resilience, and Early-Warning Systems (EWS), scientific knowledge has not resulted in changing practices of disaster management (Gaillard, Mercer, 2013). Both the preparation for and the response to disasters requires well aligned communication and information flows; decision processes; and coordination structures (Quarantelli, 1988).
Understanding and adequately reacting to early warning signs, before these become manifest and turn into acute needs is in many cases more effective and efficient than responding only after a disaster hit (Swithern, 2014). Ideally, early warning signals should trigger appropriate actions to prevent harm from the population, such as evacuation, or to get ready to respond, such as pre-positioning of goods and deployment of responders. Today, the world is suffering from violence and conflict; resource scarcity; epidemics; and natural hazards such as floods, storms, or earthquakes. Depending on the nature of the disaster, signals, and how to interpret them as well as the time for safe intervention (window of opportunity) will vary.
Early-warning systems are people-centered systems and, as such, the role and involvement of the population (persons into the risk area of a given disaster) are at the core of the system and have an impact on its
performances. Indeed, performances of EWS decrease if the population does not (re)act in the “good” way: does not understand the triggered warnings, does not implement the correct actions… This lack of “good”
ARRU et al. Early-Warning System Perception
(re)actions is sometimes due to the fact that the population has a “negative” image of the system, i.e. they see/perceive the system as useless, obsolete, incoherent, faulty… Take for example, bad weather and floods that occurred in South of France in October 2015. The Météo-France’s EWS1 has triggered an Orange alert (level 3 of 4), which implies an action plan (for example, to avoid walking in the streets, avoid driving…). It proves that the weather was worse than expected and there were many damages and human losses (some people for example, were trapped in underground car parks by going to save their car). The day after the event, the first question was: “Why the EWS of Météo-France did not trigger a Red alert (level 4 of 4)?” discrediting the system known to be effective (Gerard, 2013; Météo-France, 2014). This example illustrates the possible impacts of system perception; people can react inadequately because they have doubts about the system. In that sense, system perception is different from risk perception: in the example of Météo-France, risk perception refers to people feelings about meteorological hazards, contrary to system perception that refers to the ability and technical usefulness of an organizational system to protect people against risks, people who can be viewed as system end-users. On the eve of the COP21 held in Paris, it is unfortunate that the population has a negative perception of the vigilance system (EWS) of Météo-France. This could be certainly improved but it is still necessary to be aware of this “negative” system perception. Thus, from our point of view, an indicator measuring people's perception of EWS, as perception of security management system, is required to propose a people-oriented decision support.
This paper starts from a review of the state of the art in EWS, indicators and perception. From there, we propose a (generic) perception indicator for EWS and experiment it on a real study: the fire safety system of Paris-Dauphine University (France). The paper concludes with a discussion and some future works.
RELATEDWORK Early-Warning Systems
Early-warning is the provision of timely and effective information that allows organizations and individuals to take action to avoid or reduce their risk and prepare for effective response (Hyogo, 2005). According to the nature of disaster, Warning Systems (WS) or Early-Warning Systems (EWS) are provided, WS being limited to unpredictable disasters, in conditions where no signals can be interpreted in advance to assess disasters and prepare populations. In snowfall cases for example, conditions that lead to disasters are so complex and dependent of each other’s that experts can draw up risk maps or organize planned prevention actions and alert populations when event effectively occurs, but they cannot access events and evacuate the population in advance. This is the main difference with EWS which provide warnings with sufficient time ahead for people to act and evacuate.
According to the Public Entity Risk Institute (2010), a complete and effective EWS comprises four elements (Basher, 2006):
• Risk knowledge: knowledge of the relevant hazard and vulnerability;
• Monitoring and warning service: technical capacities to constantly monitoring hazard precursors, prediction of potential risks and warning issue;
• Dissemination and communication: diffusion of understandable warnings with prior preparedness information;
• Response capability: knowledge of risks, warning services plans and appropriate actions for persons at risk. In this sequential list, each element has direct two-linkage and interactions with each of the others elements, and failure of any part of the system will imply failure of the whole system. Human factor in particular plays a significant and transversal role in all steps (Sorensen, 2000; Twigg, 2003).
Before and during disasters, people often act according to their own interpretation schemas (Mileti, Sorensen, 1990) that are not always appropriate to risk situations and can lead to dangerous reactions. Communication technology is a key element in early-warning to improve behaviors proving common knowledge before disasters
1 Météo-France is the French meteorological agency, a public administrative institution, responsible for forecasting, studying weather and issuing weather vigilances. http://www.meteofrance.com
ARRU et al. Early-Warning System Perception
and orienting people in the interpretation of cues during events. Potential influence of communication can be under exploited, for example, warnings are often simplified and reduced to a simple “Red Alert”, instead of providing concrete advice and guidance (Comes, Mayag, Negre, 2015).
EWS are constantly evolving, reliability indicators and modelling methods such as Bayesian Networks
(Krzysztofowicz, Kelly, Long, 1994; Paté-Cornell, 1986; Sättele, Bründl, Straub, 2015) permit to evaluate their technical quality and performance. These indicators are objective and useful to have aware decision-makers, capable to take measures for improvement or reorganization of the system’s materials. They do not permit to evaluate human elements of EWS, especially response capability. Risk comprehension and interpretation of warnings is strongly subjective but they can have important consequences such as inappropriate responses to warnings delivered by Météo-France in October 2015 that have not been followed and conduced to dead of people trapped in their cars in tunnels or in underground car parks, as they were trying to get their cars out.
Perception
Perception is a general concept used in various domains such as philosophy, social studies, biology, art, and most of time with different meanings (Drottz-Sjöberg, 1991; Hochberg, 1956). It can refer to sensitive capacity, processes from the collect to the interpretation of signals or psychological realization. James (1884) and Ribot (1905) explained the term of perception in simple words and placed perception at the origin of intellect and body movement. The first proposes that “the bodily changes follow directly the perception of the existing fact” and the second that perception is a middle term connecting external “images and ideas” and muscular activities. In this paper, we consider the definition of perception as the process of collecting, organizing, and interpreting stimuli that can be information/knowledge coming from different sources, medias, discussions with other persons, sounds or visuals alerts. They are interpreted according to personal profiles, personality, knowledge and experience, and according to the risk and social context at the time of events with intervention of factors such as peer pressure or trust in signal producers.
Concerning information systems, models of people perception have been proposed through Technology Acceptance Model (TAM) and Unified Theory of Acceptance and Use of Technology (UTAUT) (Davis, 1989; Gefen, Straub, 1997; Legris, Ingham, Collerette, 2003). Researches do not include organizational and social factors, and studies are based on tests to measure individual characteristics of perception and to precise ways of use in already defined scenarios (Liker, Sindi, 1997; Foster, Franz, 1999). These kinds of methods permit objective evaluations but presuppose repeated investigations, difficult to organize in EWS related contexts.
Perception indicators
In the common understanding, we characterize a perception or evaluate the consistence of perception with reality. We usually do not associate a quantitative measure to this concept because perception is an aggregation of separate concepts. Nevertheless, using a “perception indicator” allows to keep in mind this aspect of
aggregation. We introduce in the following two examples of quantitative perception indicators that are recognize and used to improve systems in other fields than crisis management, proving that quantify perception can have concrete implications in decision support systems.
To the best of our knowledge, one of the more influent quantitative indicators of perception concerns corruption (Melgar, Rossi, Smith, 2010; Menon, Akers, 2011). Several indicators of corruption have been proposed but the most known is the Corruption Perceptions Index (CPI) (Andersson, Heywood, 2009), annually measuring levels of corruption perception in 180 countries. This index is based on various sources (Lambsdorff, 2007)
standardized and aggregated in a final note from 0 to 100, where 0 means an absence of corruption and 100 means a systematic corruption in public sector. This index has a concrete and important influence on academic research, political levels and economy (Wilhelm, 2002). It is also discussed and critiqued, notably on the admitted definition of corruption (Galtung, F, 2006) and the political impacts of the measure, subject to manipulations (Andersson, Heywood, 2009).
In economy, the well-known consumer confidence indexes can be considered as perception indicators. The
Michigan’s Consumer Sentiment Index and the Conference Broad Consumer Confidence Index are the most
widely used measures (Ludvigson, 2004). These indexes are constructed on responses to five multi-choices questions on a panel of respectively 500 and 5000 consumers. In papers about these two consumer confidence indexes, confidence and sentiment terms are often used indifferently (Dominitz, Manski, 2003; Golinelli, Parigi, 2004). These measures reflect concrete future participations in real economy, correlations between consumer
ARRU et al. Early-Warning System Perception
confidence indexes and consumer consumption has been largely studied and demonstrated. It is generally admitted that consumer confidence represent 10% to 30% of consumer consumption assessment (Ludvigson, 2004; Matsusaka, Sbordone, 1995).
Early-Warning Systems and Perception
People behaviors at the moment when warnings are triggered have a direct impact on warnings efficiency (Basher, 2006). Although a considerable part of EWS processes follows models and precise scenarios, human part is still not well understood. The ability of people to react efficiently according to the situation is difficult to assess. It varies according to complex interactions of psychological, social and environmental factors (Provitolo, Dubos-Paillard, Müller, 2011; Twigg, 2003). This problem could be considered as a quality issue, and it is generally not sufficiently taken into account in the design or development steps of EWS.
Factors of perception that influence avoiding, reducing or ignoring risks behaviors can be summarize with ten adjectives: high benefits, familiar, trusted, natural, voluntary, memorable, catastrophic potential, focused threat, uncertain time and severity, managed (O'Neill, 2004; Wade, 1992). In this list, trust has a strong influence on behaviors. Empirical researches on EWS for natural hazard analyze trust or distrust towards authorities and experts (Haynes, Barclay, Pidgeon, 2008; Paton, 2007). They propose methods to highlight accurate
mechanisms and criteria that make people trust. In risk context, trust can be defined as a relation between two entities: one’s entity’s confidence, belief and expectation that another entity will act or intend to act beneficially (Xiu, Liu, 2005). Trust is usually used at the individual, face-to-face level, and not at the systemic level (Cahill, 2003). In the perspective to study factors that influence people behavior towards risk preparation and disaster response, this concept of trust proposes a limited vision. This is why we enlarged our field of survey to the concept of perception.
As far as we know, it does not exist a perception indicator for EWS. Focus on people is important in the definition and monitoring of relevant indicators in the development phase of EWS, and even more for
responding to the necessity to improve the quality of warnings and responses at the time of events and to adapt population education towards risks (Basher, 2006; Twigg, 2003). A methodology to measure people perception has to include a large panel of citizens, to construct a simple to set up and global indicator of perception.
TOWARDSAPERCEPTIONINDICATORFOREARLY-WARNINGSYSTEMS
In context of risk, decisions are not addressed to individuals but communities, and a perception measure of citizens can be considered as a quality indicator to take on board by decision-makers. It can provide a feedback measure for experts and decision-makers highlighting human issues. Another interest of a perception indicator is to encourage people to ask themselves questions about the risks they are exposed and their level of preparation. In order to act with efficiency and rapidity, decision-makers need to have a global and synthetized vision of reality, it is important to provide them a simple measure with a sufficiently precise scale and easy to interpret. Our interest focuses on subjective factors of perception. In reference to the ten factors of perception proposed by (O'Neill, 2004), we can classify factors of perception in three categories: people-centered, risk-centered and system-centered, (communication from systems included). We propose to retain only people-centered factors to provide a general human sentiment. People-centered factors are composed of (i) familiarity with hazard and the procedure to follow, dependent of past experiences; (ii) voluntary participation to act when a warning is set off; (iii) the importance of benefices and interests attended from disaster responses with obedience to warnings; (iv)
trust towards authorities responsible of the system and security and (v) the sentiment of the risk management capabilities. We think that these five subjective factors of perception can be evaluated by questionnaire-based
investigations towards citizens.
The others factors of perception, (vi) natural character of risk opposed to the technological risk, (vii) the importance of scares from past disasters in memories, (viii) the catastrophic potential of damages, (ix) the area where threat is focused and (x) the uncertainty character of damages, are much more risk or system dependent. Some of people-centered factors such as the importance of benefices waiting from responses (iii) can also be considered as risk-centered or system-centered and the imbrication of the three categories can vary according to contexts and the specificity of situations. In the generic questionnaire proposed below, all people-centered factors are evaluated.
ARRU et al. Early-Warning System Perception
Introduction of a generic questionnaire
To create a generic questionnaire, we referred to contextual researches on trust, perception and behavior factors in volcanic crisis and fire domains (Haynes, Barclay, Pidgeon, 2008; Kuligowski, 2009). The questionnaire is also inspired from the five consumer confidence indexes questions (Ludvigson, 2004). To obtain a simple indicator covering a large panel of respondents, we limited the survey to six multiple-choice questions and one facultative open question. This latter enables participants to suggest improvements. The collected open responses permit to combine quantitative and qualitative analyses in a mixed-method approach (Hammersey, 1996), to obtain a contextual vision and to interpret and ensure to understand quantitative results.
So, the multiple-choice questions aim to cover the maximum of perception factors in a minimum list of items. The first and last questions intentionally evaluate a general sentiment. The second question evaluates the utility of the considered Early-Warning Systems (EWS) in the global sentiment evaluated in the first question. The third question axes on people knowledge about what they have to do in case of warning, it is also a voluntary self-evaluation of the ability to act during events. It measures the level of awareness and education efforts made. The fourth question is also an evaluation of people knowledge and participation level and satisfaction; finally the last question aims to evaluate the sensibility to false alarms.
• Question 1: I feel safe in the risk area toward a given hazard (q1).
• Question 2: The operational (early) warning system in place is useful to my safety (q2). • Question 3: I know what I have to do in case of hazard alert in the risk area (q3).
• Question 4: The process to follow in case of hazard alert in the risk area could be improved (q4). • Question 5: I act according to the safety process each time I hear the hazard alert in the risk area (q5). • Question 6: In general, I consider the hazard safety in the risk area is satisfactory (q6).
To facilitate and make intuitive responses to questions, each question admits five similar ordered Likert scaled responses: “disagree strongly” (n2); “disagree a little” (n1); “neither agree nor disagree” (med); “agree a little” (p1); “agree strongly” (p2) and a neutral default response “do not pronounce”.
Generic indicator calculation
This section aims at showing how to combine the answers, obtained from the questionnaire above, into a single and overall judgment interpreted as the EWS perception. Let us consider 𝑁 = {1, … , 𝑛} a set of 𝑛 respondents to the six multiple-choice questions {𝑞1, 𝑞2, 𝑞3, 𝑞4, 𝑞5, 𝑞6}. We denote by 𝑟23 the answer of the respondent 𝑗 to the
question 𝑞2 for 𝑖 ∈ 1,6 , 𝑗 ∈ 1, 𝑛 . Therefore, the generic EWS perception indicator is defined as an
aggregation of all the 𝑟23 answers. Roughly speaking, the EWS perception is given by the generic
formula 𝑓 𝑟23; ∀𝑖 ∈ 1,6 , 𝑗 ∈ 1, 𝑛 ∈ 0,1 , where 𝑓 is an aggregation function to be defined. Finding a
suitable aggregation function is a well-known problem in Decision Theory or Statistics domains. In this paper, we propose only two simple EWS perception indicators which can be easily understandable by respondents:
1- Mean Score: the classic mean indicator defined as follows: 𝑓L 𝑟MM, 𝑟MN, … , 𝑟OP =
𝑔L 1 + 𝑔L 2 + ⋯ + 𝑔L 6
6 .
Here, 𝑔L is an aggregation function associating to each multiple-choice question 𝑖, the number 𝑔L 𝑖 = r2M+ r2N+ ⋯ + r2P
n .
In this case, we assume that each answer is recoded in an ordinal numerical scale 0, 0.25, 0.5, 0.75 and 1 representing 𝑛2 𝑛𝑒𝑔𝑎𝑡𝑖𝑣𝑒 𝑟𝑒𝑠𝑝𝑜𝑛𝑠𝑒 2 , 𝑛1 𝑛𝑒𝑔𝑎𝑡𝑖𝑣𝑒 𝑟𝑒𝑠𝑝𝑜𝑛𝑠𝑒 1 , 𝑚𝑒𝑑 𝑚𝑒𝑑𝑖𝑢𝑚 𝑟𝑒𝑠𝑝𝑜𝑛𝑠𝑒 , 𝑝1 𝑝𝑜𝑠𝑖𝑡𝑖𝑣𝑒 𝑟𝑒𝑠𝑝𝑜𝑛𝑠𝑒 1 and 𝑝2 (𝑝𝑜𝑠𝑖𝑡𝑖𝑣𝑒 𝑟𝑒𝑠𝑝𝑜𝑛𝑠𝑒 2) respectively. In this formula, neutral responses are not taken into account.
2- Sentiment Score: the second indicator is inspired from the monthly consumer confidence indexes measuring also a global sentiment. We chose the Conference Broad Consumer Confidence Index to construct our formula. It is more recent than the Michigan’s Consumer Sentiment Index and less focused in academic researches, but it presents a stronger link with real economy (Ludvigson, 2004). For each multiple-choice question 𝑖, we count the total number of positive responses 𝑝1 and 𝑝2 (resp.
ARRU et al. Early-Warning System Perception
negative responses n1 and n2) given by the 𝑛 responders denotes 𝑝𝑜𝑠(𝑖) (resp. 𝑛𝑒𝑔(𝑖)). Hence we have 𝑓`(𝑟MM, 𝑟MN, … , 𝑟OP) =
𝑔` 1 + 𝑔` 2 + ⋯ + 𝑔` 6
6
where g is an aggregation function associating to each question 𝑖, the number 𝑔` 𝑖 =
𝑝𝑜𝑠(𝑖) 𝑝𝑜𝑠(𝑖) + 𝑛𝑒𝑔(𝑖) .
In this formula, median (med) and neutral responses are not taken into account.
Results are normalized values comprised in the interval [0; 1] that can be multiplied by decision-makers to bring them back to the interpretation scale desired according to contexts and their decisions levels.
EXPERIMENTATIONS
In this section, we present our study where we experiment our questionnaire to calculate the perception indicator of the fire safety system of our University.
Context
Our study has been built and tested in the Paris-Dauphine University (France) from October to November 2015 to test students and personnel’s fire safety perception. At our University, the fire safety is guaranteed by the
hygiene and security department (five persons); among others, for risk evaluation, annual risk-prevention,
prevention, link with the city fire department, public evacuation and actions against fires. Fire safety follows sets of safety rules included in official acts relative to fire protection, the main document being dated of June 1980 under the title of “Regulation against Fire and Panic in Public Access Building2”.
The Paris-Dauphine University public establishment admits the particularity to concentrate several kinds of buildings and activities with specific rules: amphitheaters, sport hall, library, restaurant, parking, bookshop, agency and commercial shops. There are five buildings which could burn in five minutes. A majority of students, university lecturers and researchers, permanent personnel, and guests frequent the University every day. In 2014, the University counted 8750 full-time students, 2020 professors, researchers and lecturers and 460 administrative sand and support staff. Once a year, a simulation is organized on the complete site of the
University, with warnings and evacuation of people. A training is also proposed every year for voluntary personnel. Towards students, only specific two-hour trainings are proposed for specific associative events they organize. We precise that at the date of our survey, neither training nor simulation has been realized since the beginning of the academic year.
Early-Warning and Fire Safety perception
Although wildfire responses are clearly consider as Early-Warning Systems (EWS) (Goldammer, 1998), fire safety is more difficult to classify in warning systems or EWS. We can consider both possibilities, depending on whether we define fire departures, as early signals or as the beginnings of fires. Some researches chose to classify fire safety as EWS (Brennan, 2000; Reisinger, 1980), and it is also our choice.
Actual people-centered researches about fire safety focus on people behavior during evacuations from building fires. They highlight simplifications and biases in actual time predictive models, inappropriate behaviors during evacuations, towards smoke cues for example, or absences of reactions (Kuligowski, 2009; Proulx, 2001). During evacuation, people have to interpret external signals, with physical cues such as flames, smoke, heat, social cues such a hearing discussions, seeing other’s inaction and more complex cues like perceived uncertainty, or information overload.
Protocol and methods
We launched an on-line anonymous survey activated from October 30, 2015 to November 06, 2015, created with the Open Source software survey tool Limesurvey3. Information was asked to participants about their age
2 The full legal text is available on Legifrance, the French public service of law diffusion through the Internet: http://www.legifrance.gouv.fr/affichTexte.do;?cidTexte=LEGITEXT000020303557
ARRU et al. Early-Warning System Perception
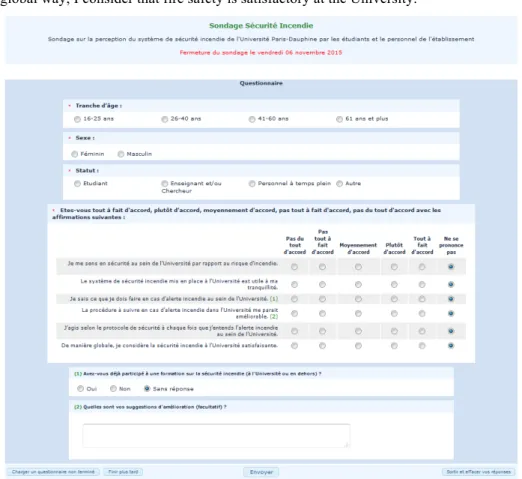
category, status, gender and the participation or not in the past to a training on fire safety. The body of the survey was made of the followings multiple-choice questions with six possible responses from “disagree strongly” to “agree strongly” and the neutral default response “do not pronounce”; and one facultative open question on improvements’ suggestions. Figure 1displays a screen capture of the proposed survey.
• q1: I feel safe in the University towards fire risk.
• q2: The warning system set up at the University is useful to my safety. • q3: I know what I have to do in case of fire alert in the University.
• q4: I think that the procedure to follow in case of fire alert is improvable (a facultative open question permitted to the participants to propose suggestions for improvement, with a 500 words-limited answer). • q5: I follow the safety protocol each time I hear the fire alert in the University.
• q6: In a global way, I consider that fire safety is satisfactory at the University.
Figure 1. Screen capture of the survey (questions are in French)
A hyperlink to the survey has been sent by email to 1187 personnel members of the University and to student personal emails of seven classes of 25 to 30 individuals. Additionally, a news has been posted in the student’s private internet space. No rewards were proposed to participants.
Quantitative Results
253 students and personnel members responded to the questionnaire during the ten days the survey was opened. More than 10% of personnel members responded to the questionnaire, with 140 responses on the 1187 sent emails.
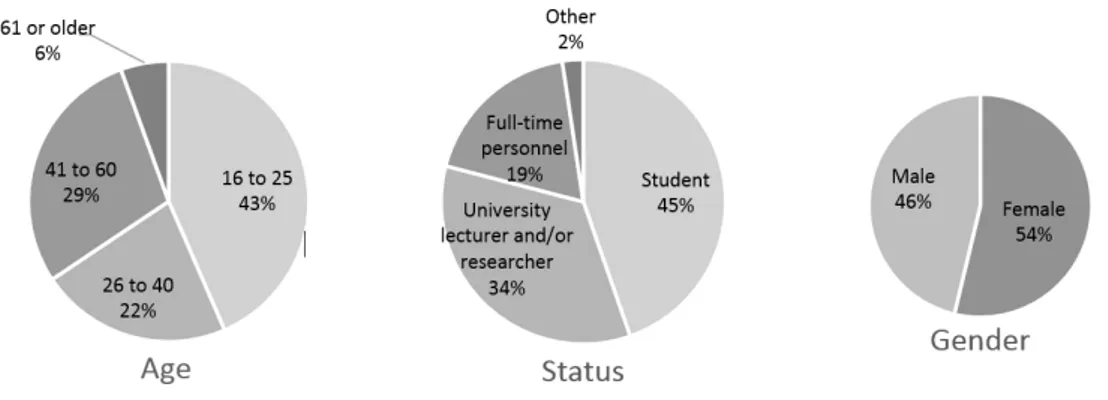
As displayed Figure 2, young adults from 16 to 24 years old represent the majority of respondents with 43% of participants, which is comparable to the student responses percentage of 45%. Then, respectively 22% and 29% of respondents are 26 to 40 and 41 to 60 years old and a minority of respondents are older than 60 (6%). One
ARRU et al. Early-Warning System Perception
third of participants are University lecturers and/or researchers (34%) and 19% are full-time personnel. These age and status distributions do not represent University population where student are more represented. Nevertheless, they permit comparisons between the different categories. Finally, nearly the same number of women and men responded with 54% and 46% of participants.
Figure 2. Distribution of participants in three categories (Age, Status and Gender)
Only 18% of participants have already participated to a training on fire safety, and an important part of participants with 28% proposed suggestions for improvement with concrete propositions and highlight on issues, often accompanied with personal experiences.
In this study we chose to break down scores from 0 to 1 to a scale from 0 to 5, multiplying scores by 5 to obtain a number of intervals between integers corresponding to the number of possible responses. In our case, a score of 0 refers to a strong unsafety, and a score of 5 highlights a strong safety.
Cronbach’s reliability of statements = 0,816. The Cronbach’s alpha shows a good internal consistency of responses.
Table 1. Detailed perception mean scores according to categories of respondents
Categories q1 Safety feeling q2 System utility q3 Knowledge - Education q4 Improves - Quality q5 False alerts q6 Final sentiment Mean score fm(q1,…,q6) Ag e 16 to 25 3,57 3,25 2,22 1,38 2,73 3,28 2,74 26 to 40 3,53 3,28 3,04 1,50 3,15 3,34 2,97 41 to 60 3,25 3,43 3,14 1,62 3,94 3,24 3,11 61 or older 3,46 3,02 4,04 1,02 4,13 3,75 3,24 St at us Students 3,46 3,25 2,17 1,41 2,72 3,21 2,70 Lecturers and/or researchers 3,49 3,20 2,89 1,57 3,52 3,40 3,01 Full-time personnel 3,39 3,56 3,78 1,37 3,92 3,31 3,22 Other 3,75 3,75 4,17 1,67 3,75 3,75 3,47 Ge nd er Female 3,27 3,25 2,89 1,41 3,29 3,16 2,88 Male 3,69 3,35 2,62 1,52 3,28 3,47 2,99 Trained 3,29 3,37 3,49 1,28 3,45 3,45 3,06 Not trained 3,51 3,31 2,61 1,49 3,23 3,28 2,91 Global 3,46 3,30 2,76 1,46 3,28 3,31 2,93
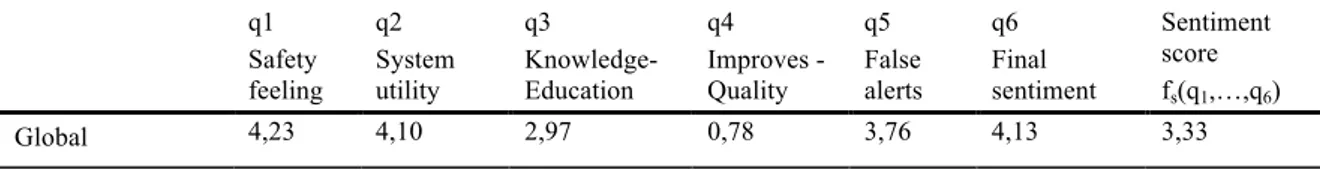
ARRU et al. Early-Warning System Perception q1 Safety feeling q2 System utility q3 Knowledge- Education q4 Improves - Quality q5 False alerts q6 Final sentiment Sentiment score fs(q1,…,q6) Global 4,23 4,10 2,97 0,78 3,76 4,13 3,33
Table 2. Perception sentiment scores by questions
People with a strong knowledge of the processes to follow (q3, 61 years old or older) are also the ones who have more propositions for improvement (q4, 61 years old or older). We can suppose that age have a strong influence on these factors comparing with scores of younger classes of population, and that knowledge acquired is due to personal experiences more than context communication and education. Another particular result is the weak score of young adults that intend to react when warnings are launched (q5, 16 to 25 years old), this score of 2.73 (Table 1, line 1) alerts on possible absence of reactions by youngers.
Responses to Question 4 relative to the improvability of the process to follow in case of fire alert, and in a lesser extent responses to Question 2 on people knowledge of safety processes, provide low results compared to other perception factors evaluated. This difference can be explained by the appeal to personnel experiences. People tend to point out their own experiences when they answer to such questions, corresponding to the demand characteristics bias, although on the contrary psychological and cultural acquiescence bias for general Questions 1 and 6 (Kalton, Schuman, 1982) tent to increase results. We limited appeal to personal experiences but
responses in Question 4 reveal the weight of people interrogations that have not still being asked or discussed with responsible persons of the EWS.
The global perception mean score is 2.93 (Table 1), which is significantly lower than the perception sentiment score of 3.33 (Table 2). Sentiment score ignore “neither agree nor disagree” responses and give the same importance to responses “disagree a little” and “agree a little” than to “strongly disagree” and “strongly agree” responses.
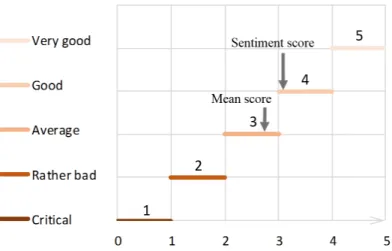
To obtain our final perception indicator, then we bring down continuous scores from 0 to 5 to integers from 1 to 5 with a number of level of 5 corresponding to the number of possible responses in the questionnaire. A score of 1 for this indicator refers to a strong unsafety about personal and system ability to manage risk, and a score of 5 highlights a strong safety.
Score [0;1] ]1;2] ]2;3] ]3;4] ]4;5]
Level 1 2 3 4 5
Table 3. Correspondence between scores and levels of our indicator
For scores in the interval (Table 3):
• [0;1]: level of 1 is considered critical and at least communication and education efforts are required. • ]1;2]: level of 2 is rather bad and decision-makers have to wonder on the reasons of such people perception. • ]2;3]: level of 3, people have an average perception of the system, they do not feel in danger but they do not
consider that everything is done for their safety.
• ]3;4] and ]4;5] with levels of 4 and 5, people have a good perception of the system and there is a high probability with a score of 5 that people are well informed and behave in appropriate ways at the time of events or exercises.
In order to consider cost efficiency of EWS, we recommend to authorities and experts to ensure a minimum good perception level, with an indicator score higher than 3.
ARRU et al. Early-Warning System Perception
Figure 3. EWS Perception indicator
With the mean formula proposed in this paper, we obtain an average perception of our University fire safety system, although with the sentiment formula the perception is considered as good. In this case, interpretation values are different for the two formulas (as displayed Figure 3); it could be different if we would have chosen another scale with 3 levels for example. The interpretation scale is subjective and the number of level scales has to be context dependent and discussed by decision-makers.
In this example the perception score is always up to 3, but if the score is lower, we consider that results must be interpreted and discussed by experts and decision-makers to understand reasons and decide how to (re)act. Reasons can be diverse: communication issues, risk knowledge inconsistency or problems in the dissemination of warnings (e.g. if past experiences have been negative). For the interpretation, analyzing qualitative results can be helpful.
Qualitative results
Respondents of the open question identified in their own words issues, improvement propositions and requests. The 71 responses obtained are context specific; we classified them in four categories:
• information and training requests; • proposals for technical improvements; • false alerts;
• diverse issues.
Need for more communication and training is strongly expressed, it is present in more than half of the responses. People ask for information toward sending of emails for example, and more training. “We should
have a document or a presentation at the beginning of the year to present the processes to follow in case of fire.” “During four years in the University I have never participated to a fire alert exercise and I have never been informed of the procedures to follow.” “Develop training and multiply evacuation exercises.”
Clear and precise propositions are made by people to improve fire safety; most of them concern warnings and preparation for evacuation. “More megaphones, and a vocal announce that indicates the procedure to follow.”
“I think zones should be better defined, mainly for stairs (…), during the last alert there was too much persons in stairs, it was mess.”
Perception of false alerts is also an important subject, people consider false alerts outnumbered. “Avoid
outnumbered fire alerts because the day when fire will be real, people won’t quit their office or their class.” At
the same time respondents think important to respect exercises and simulations “Ensure that students and
personnel take seriously fire alerts.”
Relative issues to evacuation, warnings and material capacities are finally highlighted by participants, particularly on routes and security exits, sound level of warnings and security doors.
Qualitative results must be considered and understood with prudence, some requests could be considered as contradictories. For example, people demand more exercises and fewer false alerts, but being attentive to details,
ARRU et al. Early-Warning System Perception
responses show that false alerts could be better accepted if information is provided both before and after exercises.
Personal experiences may have a strong influence on both quantitative and qualitative responses. That can be considered as bias which can be limited with education and people proximity. Contexts can also have influence on responses and the questionnaire has to be adapted in specific cases.
CONCLUSIONANDPERSPECTIVES
The importance of perception in risk analyses, communication and preparation is a critical subject in warnings systems. Experts and decision-makers deal with complex cultural and individual mechanisms at the origin of their actions. The indicator we propose measures the general people perception toward an Early-Warning Systems (EWS) in place. It permits to synthetize subjective components of perception to indicate to decision-makers and experts if their system is poorly or very well perceived. This feedback could be at the origin of operational improvements, more frequent communication and education events, or the implication of citizens in the definition of risk and vulnerability indicators.
Our study on the fire safety system of Paris-Dauphine University has permitted discussions with the experts of the system on their needs for more education and simulation exercises. Note that, the study presented in this paper was a preliminary approach to test in a local and organizational level the interest of our proposition. Future steps will be: (i) understanding in what way indicator values and qualitative analyses of EWS perception impact organizational management and decision support, (ii) implementing our proposition in different fields and (iii) more generally, proposing a generic indicator calculation method, specific to our perceptive component. We aim to improve functions proposed in this paper to measure EWS perception indicator with more specific formulas. Then, indicator values should be regularly recalculated to measure the evolutions of perception over time. We intend to investigate machine learning aggregation methods, with applications to larger case studies in order to test the generalization of the proposed method. Another step for future researches is to discuss and maybe enlarge the six questions proposed in order to validate the questionnaire by psychometric tests and experiment it on a larger panel of participants. Finally, we are interested in comparing our results with field surveys, based on observation about reactions during simulations, training exercises or real situations.
ACKNOWLEDGMENTS
The experimentation has been possible thanks to the help and approval of Paris-Dauphine University’s Hygiene and Security Department. We are grateful to all participants of the survey, students and personnel members, for the time taken to answer our questions and for their useful suggestions.
REFERENCES
1. Andersson, S., & Heywood, P. M. (2009). The politics of perception: use and abuse of Transparency International's approach to measuring corruption. Political Studies, 57(4), 746-767.
2. Basher, R. (2006) Global Early-Warning systems for natural hazards: systematic and people-centred.
Philosophical Transactions of the Royal Society of London A: Mathematical, Physical and Engineering Sciences, 364(1845), 2167-2182.
3. Brennan, P. (2000). Modelling cue recognition and pre-evacuation response. Fire Safety Science, 6, 1029-1040. 4. Cahill, V. (2003). Using trust for secure collaboration in uncertain environments.
5. Comes, T., Mayag, B., & Negre, E. (2015). Beyond Early: Decision Support for Improved Typhoon Warning Systems.
6. Davis, F. D. (1989). Perceived usefulness, perceived ease of use, and user acceptance of information technology. MIS quarterly, 319-340.
7. Dominitz, J., & Manski, C. F. (2003). How should we measure consumer confidence (sentiment)? Evidence
from the Michigan Survey of Consumers (No. w9926). National Bureau of Economic Research.
ARRU et al. Early-Warning System Perception
9. Foster, S. T., & Franz, C. R. (1999). User involvement during information systems development: a comparison of analyst and user perceptions of system acceptance. Journal of Engineering and Technology Management,
16(3), 329-348.
10. Gaillard J. C. and Mercer J. (2013). From knowledge to action bridging gaps in disaster risk reduction. Progress
in Human Geography, 37(1):93-114.
11. Galtung, F. (2006). Measuring the immeasurable: boundaries and functions of (macro) corruption indices.
Measuring corruption, 101-130.
12. Gefen, D., & Straub, D. W. (1997). Gender differences in the perception and use of e-mail: An extension to the technology acceptance model. MIS quarterly, 389-400.
13. Gerard F. (2013) Rapport du Groupe de Travail AFPCN-IMDR “Vigilance et Alerte”.
http://afpcn.org/wordpress/wp-content/uploads/2013/10/Synth%C3%A8se-GT-Alerte-finale-v2.pdf 14. GHA. Global Humanitarian Assistance Report 2013. Development Initiatives, Somerset, UK, 2013.
15. Goldammer, J. G. (1998). Early warning systems for the prediction of an appropriate response to wildfires and related environmental hazards. Health Guidelines for Vegetation Fire Events, Lima, Peru, 6-9.
16. Golinelli, R., & Parigi, G. (2004). Consumer Sentiment and Economic Activity. Journal of Business Cycle
Measurement and Analysis, 2004(2), 147-170.
17. Griffin, C., & Phoenix, A. (1994). The relationship between qualitative and quantitative research: Lessons from feminist psychology. Journal of community & applied social psychology, 4(4), 287-298.
18. Harvard Humanitarian Initiative et al. (2010) Disaster Relief 2.0: The future of information sharing in
humanitarian emergencies. HHI; United Nations Foundation; OCHA; The Vodafone Foundation, Washington
DC.
19. Haynes, K., Barclay, J., & Pidgeon, N. (2008). The issue of trust and its influence on risk communication during a volcanic crisis. Bulletin of Volcanology, 70(5), 605-621.
20. Hochberg, J. (1956). Perception: toward the recovery of a definition. Psychological review, 63(6), 400. 21. Hyogo Framework for Action (2005) 2005-2015: Building the resilience of nations and communities to
disasters. Extract from the International report of the World Conference on Disaster Reduction, UN ISDR,
2005.
22. James, W. (1884). II.—What is an emotion? Mind, (34), 188-205.
23. Kalton, G., & Schuman, H. (1982). The effect of the question on survey responses: A review. Journal of the
Royal Statistical Society. Series A (General), 42-73.
24. Kuligowski, E. D. (2009). The process of human behavior in fires. US Department of Commerce, National Institute of Standards and Technology.
25. Krzysztofowicz, R., Kelly, K. S., & Long, D. (1994). Reliability of flood warning systems. Journal of water
resources planning and management, 120(6), 906-926.
26. Lambsdorff, J. G. (2007). The methodology of the corruption perceptions index 2007.
27. Legris, P., Ingham, J., & Collerette, P. (2003). Why do people use information technology? A critical review of the technology acceptance model. Information & management, 40(3), 191-204.
28. Liker, J. K., & Sindi, A. A. (1997). User acceptance of expert systems: a test of the theory of reasoned action.
Journal of Engineering and Technology management, 14(2), 147-173.
29. Ludvigson, S. C. (2004). Consumer confidence and consumer spending. Journal of Economic perspectives, 29-50.
30. Matsusaka, J. G., & Sbordone, A. M. (1995). Consumer confidence and economic fluctuations. Economic
Inquiry, 33, 296-296.
31. Melgar, N., Rossi, M., & Smith, T. W. (2010). The perception of corruption. International Journal of Public
Opinion Research, 22(1), 120-131.
32. Menon, B., & Akers, M. D. (2011). International Perception Of Corruption. Review of Business Information
ARRU et al. Early-Warning System Perception
33. Météo-France, Annual report, 2014. http://www.meteofrance.fr/publications/nos-documents-institutionnels/rapports-annuels/rapport-annuel-2014
34. Mileti, D. S., & Sorensen, J. H. (1990). Communication of emergency public warnings: A social science
perspective and state-of-the-art assessment (No. ORNL-6609). Oak Ridge National Lab., TN (USA).
35. O'Neill, P. (2004). Developing a risk communication model to encourage community safety from natural
hazards. State Emergency Services.
36. Paté-Cornell, M. E. (1986). Warning systems in risk management. Risk analysis, 6(2), 223-234. 37. Paton, D. (2007). Preparing for natural hazards: the role of community trust. Disaster Prevention and
Management: An International Journal, 16(3), 370-379.
38. PERI, Public Entity Risk Institute (2010) Early warning systems – interdisciplinary observations and policies from a local government perspective - four elements of people centered early warning systems. Public Entity Risk Institute (PERI) Symposium.
39. Pitt, L. F., Watson, R. T., & Kavan, C. B. (1995). Service quality: a measure of information systems effectiveness. MIS quarterly, 173-187.
40. Proulx, G. (2001). Occupant behaviour and evacuation. In Proceedings of the 9th International Fire Protection
Symposium (pp. 219-232).
41. Provitolo, D., Dubos-Paillard, E., & Müller, J. P. (2011). Emergent human behaviour during a disaster: thematic versus complex systems approaches. In EPNACS 2011 within European Conference of Complex System. 42. Quarantelli E. L. (1998) Disaster crisis management: A summary of research findings. Journal of Management
Studies, 25(4):373-385.
43. Reisinger, K. S. (1980). Smoke detectors: reducing deaths and injuries due to fire. Pediatrics, 65(4), 718-724. 44. Ribot, T. (1905). La psychologie des sentiments. Alcan.
45. Sättele, M., Bründl, M., & Straub, D. (2015). Reliability and effectiveness of Early-Warning systems for natural hazards: Concept and application to debris flow warning. Reliability Engineering & System Safety, 142, 192-202.
46. Sorensen, J. H. (2000). Hazard warning systems: Review of 20 years of progress. Natural Hazards Review, 1(2), 119-125.
47. Swithern, S. (2014) Global Humanitarian Assitance Report. New York.
48. Twigg, J. (2003). The human factor in Early-Warnings: risk perception and appropriate communications. In
Early-Warning Systems for Natural Disaster Reduction (pp. 19-26). Springer Berlin Heidelberg.
49. Wade, C. R., Molony, S. T., Durbin, M. E., Klein, S. H., & Wahl, L. E. (1992). Communicating with the Public
about Risk (No. LA-UR-92-2062; CONF-9209142--4). Los Alamos National Lab., NM (United States).
50. Wilhelm, P. G. (2002). International validation of the corruption perceptions index: Implications for business ethics and entrepreneurship education. Journal of Business Ethics, 35(3), 177-189.
51. Xiu, D., & Liu, Z. (2005). A formal definition for trust in distributed systems. In Information Security (pp. 482-489). Springer Berlin Heidelberg.