Tous droits réservés © Management international / International Management
/ Gestión Internacional, 2016 Ce document est protégé par la loi sur le droit d’auteur. L’utilisation desservices d’Érudit (y compris la reproduction) est assujettie à sa politique d’utilisation que vous pouvez consulter en ligne.
https://apropos.erudit.org/fr/usagers/politique-dutilisation/
Cet article est diffusé et préservé par Érudit.
Érudit est un consortium interuniversitaire sans but lucratif composé de l’Université de Montréal, l’Université Laval et l’Université du Québec à Montréal. Il a pour mission la promotion et la valorisation de la recherche. https://www.erudit.org/fr/
Management international
International Management
Gestiòn Internacional
The Effect of Internal and External Lean Practices
on Performance: A Firm-Centered Approach
L’effet du lean interne et externe sur la performance : une
approche orientée sur les entreprises
El efecto del Lean interno y externo sobre el desempeño:
un enfoque orientado sobre las empresas
Tarek Chanegrih et Jordane Creusier
Volume 21, numéro 1, automne 2016URI : https://id.erudit.org/iderudit/1052501ar
DOI : https://doi.org/10.7202/1052501ar Aller au sommaire du numéro
Éditeur(s) HEC Montréal
Université Paris Dauphine ISSN
1206-1697 (imprimé) 1918-9222 (numérique)
Découvrir la revue
Citer cet article
Chanegrih, T. & Creusier, J. (2016). The Effect of Internal and External Lean Practices on Performance: A Firm-Centered Approach. Management
international / International Management / Gestiòn Internacional, 21(1),
114–125. https://doi.org/10.7202/1052501ar
Résumé de l'article
L’objectif de cet article est d’améliorer la compréhension des relations qui unissent le lean et les performances opérationnelles et financières. Un échantillon de 171 usines françaises montre un effet direct du lean externe sur la performance financière. Une approche centrée sur les usines nous permet d’identifier 3 profils distincts. Le groupe des « Lean Intensif » montre des différences significatives de performances financières et opérationnelles par rapport au groupe des « Faible Lean ». En revanche, la différence entre le groupe des « Lean Intensif » et des « Lean Interne Dominant » ne se fait qu’au niveau de la performance opérationnelle.
M
anufacturing firms are increasingly implementing lean practices (Adamides et al., 2008). This implementation is expected to improve financial performance by enhancing operational outcomes, such as higher quality and lower inven-tories (Womack et al., 1990). Support for a positive association between lean practices and operational performance has been found by several studies (Shah and Ward, 2003), whereas others failed to find total support (e.g., Sakakibara et al., 1997; Callenet al., 2000; Swink et al., 2005). Similarly, although the
major-ity of studies show a relationship between lean practices and financial performance (e.g., Fullerton and Wempe, 2009; Yang
et al., 2011), some studies also fail to significantly connect lean
production to financial performance (e.g., Balakrishnan et al., 1996; Fullerton et al., 2003; Kannan and Tann, 2005; Jayaram
et al., 2008; Cannon, 2008).
The root cause of mixed results on performances may be attributed to the multiplicity of lean practices (Hofer et al., 2012). The need to further understand the link between lean practices and performance is also justified by the fact that scales used to measure the degree of implementation of lean
practices (Shah and Ward, 2003; Li et al., 2005) are restrictive (Shah and Ward, 2007) and internally oriented (pull system, setup time reduction, continuous flow, employee involvement, total productive maintenance, and statistical process control). However, the Shingo Prize, which awards world-class compan-ies for their adherence to lean principles, emphasizes a cultural transformation through the integration of principles of oper-ational excellence across the enterprise to create a complete and systemic view (Shingo Prize, 2010). It supports lean as an integrated complex management system that concerns the entire firm (Ahlstrom and Karlsson, 1996), in which all people at all levels must be committed and involved in reducing all forms of waste (Furlan et al., 2011).
The purpose of this research is to add to our understanding of the link between lean practices and performance. It encompasses all lean practices and conceptualizes lean production as two lean practice bundles (internal and external) (Shah and Ward, 2007). This study reflects the lean landscape more broadly and thus investigates more precisely the relationship between perform-ance and lean practices. By testing the relationship between
ABSTRACT
The aim of this paper is to enhance the under-standing of the relationship between lean practices and both operational and finan-cial performance. A sample of 171 French manufacturing firms shows a direct effect of external lean practices on financial per-formance. A firm-centered approach identi-fied three profiles. “Full achievers” present significant differences in both operational and financial performance compare to “weak achievers”. Even if the difference in opera-tional performance is significant between “full achievers” and “internal lean dominant”, there is not a significant difference in finan-cial performance.
Keywords: Operational performance, finan-cial performance, internal lean practices, external lean practices, profiles, firm- centered approach
RÉSUMÉ
L’objectif de cet article est d’améliorer la compréhension des relations qui unissent le lean et les performances opérationnelles et financières. Un échantillon de 171 usines françaises montre un effet direct du lean externe sur la performance financière. Une approche centrée sur les usines nous permet d’identifier 3 profils distincts. Le groupe des « Lean Intensif » montre des différences signi-ficatives de performances financières et opé-rationnelles par rapport au groupe des « Faible Lean ». En revanche, la différence entre le groupe des « Lean Intensif » et des « Lean Interne Dominant » ne se fait qu’au niveau de la performance opérationnelle.
Mots clés : Performance opérationnelle, performance financière, lean interne, lean externe, profils.
RESUMEN
Este artículo tiene como objetivo mejorar la comprensión de la relaciones que unen lean y desempeño operacional y financiero. Una muestra de 171 fábricas francesas revela un efecto directo del lean externo sobre el financiera. Un estudio basado en las fábricas nos permite identificar 3 perfiles distintos. El grupo de los "lean intensivos" muestra significativas diferencias en los desempeños operacional y financiero con respeto al grupo de los " lean débiles". Sin embargo, la diferen-cia entre el grupo de los "lean intensivos" y de los " lean Internos dominantes" sólo se puede notar a nivel del desempeño operacional. Palabras Claves: Desempeño operacional, desempeño financiero, lean interno, lean externo, perfiles.
on Performance: A Firm-Centered Approach
L’effet du lean interne et externe sur la performance :
une approche orientée sur les entreprises
El efecto del Lean interno y externo sobre el desempeño:
un enfoque orientado sobre las empresas
TAREK CHANEGRIH
Université de Caen, IAE,NIMEC EA 969, France
JORDANE CREUSIER
Université d’Amiens, CRIISEA EA 4286, France
Pou r c ite r c et a rt ic le : C ha ne gr ih , T . & C re us ie r, J . ( 20 16 ). T he E ffe ct o f I nt er na l a nd E xt er na l L ea n P ra ct ic es on P er fo rm an ce : A F ir m -C en te re d A pp ro ac h. M an ag em en t i nte rn at io na l, 2 1( 1) , 1 14 -1 25 .
lean practices and performance at the firm-level rather than at the plant-level, our research contributes to the existing litera-ture in two ways. First, we show how a more complete holistic lean strategy, capturing both external (supplier and customer) and internal practices, can improve our understanding of the relationship between lean practices and both operational and financial performance. Second, we identify specific “profiles” of firms that are homogenous segments of a population among the sample using a “Real” firm-centered approach. Earlier studies (Chavez et al. 2015; Fullerton et al., 2014; Fullerton
et al., 2013) used the simplest ways to perform a firm-centered
approach. They simply split the concept by mean or median and then compared these 2 subpopulations on another factor. These “profiles” of firms provide major novel results about the relationship between lean practices and both operational and financial performance. Furthermore, this methodological choice allows us to have new theoretical and managerial implications compare to the variable-centered approach.
This paper is organized as follows: first, we develop research hypotheses. Then, we present the methodology and the results of our analysis. Finally we discuss the theoretical, methodo-logical, and practical implications of our findings.
Theoretical background and hypotheses
development
Lean production is a multi-faced concept that includes both people and process components. It is an integrated system composed of highly integrated elements (Shah and Ward, 2007) that focuses on the elimination of all forms of waste and non-value added activities (Womack et al., 1990). In this research, we conceptualize lean production as internal lean practices (pull, continuous flow, setup time reduction, statistical process control (SPC), total productive/preventive maintenance (TPM), employee involvement) and external lean practices (supplier feedback, JIT delivery, developing suppliers, customer involvement). Internal Lean Practices and performance
Operational performance characterizes the competitive priorities of firms (Narasimhan and Das, 2001). Internal lean practices are generally shown to be linked to competitive priorities such as cost, quality, delivery, and flexibility (Shah and Ward, 2003) and the reduction in trade-offs among them (Yusuf and Adeleye, 2002; Jayaram et al., 2008). Support for a positive relationship between internal lean practices and operational performance has been found by several researchers (e.g., Norris et al., 1994; Flyn et al., 1995; Koufterous et al., 1998, Shah and Ward, 2003; Kannan and Tan, 2005; Hallgren and Olhager, 2009; Rahman et al., 2010). The focus was placed on quality through a zero defect policy and by continuously identifying and reducing sources of waste (Naka-mura et al., 1998; Fullerton and McWatters, 2001; Kannan and Tan, 2005; Narasimhan et al., 2006). Under the TQM philosophy pertaining to the quality of goods and services (Ahire et al., 1996; Flynn et al., 1995; Prajogo and Sohal, 2006; Sitkin et al., 1994), process management is one of the critical practices for develop-ing quality performance. Statistical process control applies the laws of probability and statistical techniques for monitoring and controlling the quality of a process and its output (Heim and Peng,
2010; Swamidass, 2003). Previous studies support the relationship between internal lean practices and quality performance (Shah
et al., 2008; Sunder, 2013; Vinodh and Joy, 2012).
Internal lean practices are also associated with improved delivery (e.g., Nakamura et al., 1998; Fullerton and McWatters, 2001; Cua et al., 2001). In particular, studies have focused on the reductions in variability and throughput time (Naylor et al., 1999; Fullerton and McWatters, 2001). One of the keys of internal lean practices is to improve speed and efficiency of production flow (Shah et al., 2008; Sunder, 2013; Vinodh and Joy, 2012; Ward and Zhou, 2006). Smooth flow is assured with a pull system because upstream operations cannot act without the authorization of downstream operations and therefore cannot flood the operation (Ahire et al.; 1996; Cua et al., 2001; Flynn et al., 1995; Hofer et al., 2012; Matsui, 2007; Shah et Ward, 2003, Swink et al., 2005). In addition, lean concepts also emphasize the creation of an efficient production layout that enhances flow and the speed of produc-tion. This smooth layout is accompanied by quick changeover of equipment and smaller lot size of materials to be processed. This set up time reduction eventually reduces internal lead-times (Alsmadi et al., 2012; Bartezzaghi and Turco, 1989), and the reduction of the lot size also reduces the internal lead-time because of shorter queues in the different phases of the produc-tion process (Flynn et al., 1995; Hayes and Wheelwright, 1984). Furthermore, internal lean practices also improve flexibility (Boyer et al., 1997; Swink et al., 2005; Vinodh and Joy, 2012). They cultivate multi-skilled workers who can easily be assigned from one work center to another as dictated by production volume (Lee and Ebrahimpour, 1984; Yazici, 2005). Similarly, Suarez
et al. (1996) and Chang et al. (2005) have shown that promoting
multi-skilled workers who are able to handle different products and have the ability to transfer a variety of tooling fixtures is very important to production mix-flexibility. Multi-skilled workers also have the ability to modify operating procedures and products, which allows redesigning parts and enhancing new product flexibility (Gerwin, 1987). Swink et al. (2005) have also reported that workforce development enhances workers’ skills in performing their tasks more effectively and efficiently. Yeung et al. (2006) explained that improvement practices and process control help workers to investigate the root causes and take corrective action every time a failure is found.
Finally, the aim of internal lean practices is to increase pro-ductivity and efficiency (Cua et al., 2001). Not surprisingly, internal lean practices have a direct effect on cost improvement (Naylor et al., 1999). Numerous studies support this relation-ship (e.g., Lawrence and Hottenstein, 1995; Huson and Nanda, 1995; Nakamura et al., 1998; Callen et al., 2000; Cua et al., 2001; Fullerton and McWatters, 2001, Swink et al., 2005; Browning and Health, 2009). Moreover, multiple empirical studies show a positive relationship between internal lean practices and dimen-sions of financial performance such as profitability (e.g., Huson and Nanda, 1995; Callen et al., 2000; Fullerton et McWatters, 2001; Kinney and Wempe, 2002), return on investment (e.g., Inman and Mehra, 1993), return on assets (e.g., Fullerton and McWatters, 2001, Kinney and Wempe, 2002; Eroglu and Hofer, 2011), earnings per share (e.g., Huson and Nanda, 1995) and market-oriented indicators such as market share (e.g., Inman and Mehra, 1993; Norris et al., 1994).
These remarks lead us to propose the following hypotheses: H1a: Internal lean practices are positively associated with operational performance in our sample.
H1b: Internal lean practices are positively associated with financial performance in our sample.
Indeed, it is necessary to check if we are on the same basis than previous authors before testing external lean practices on performance.
External Lean Practices and performance
The main focus of the lean perspective is the shop floor (internal lean). However, the focus has gradually widened to include the identification of customer preferences and suppliers resources (external lean), which go beyond the single factory to include the downstream and upstream sides of the supply chain (Hines
et al., 2004). Cocks (1996) argues that the reduction of waste
depends to a great extent on honest and open relationships with suppliers. A close relationship with suppliers also achieves high quality standards and on-time delivery (Levy, 1997; Simpson and Power, 2005). Furthermore, being in close contact with suppliers enables firms to decrease inventories through infor-mation sharing, provide stable prices and contribute to the product design through inclusion in product design (Sheth and Sharma, 1997; So and Sun, 2010). It also entails the sharing of supplier technological capabilities (Vickery et al., 2003; Petersen
et al., 2005; Li et al., 2006). In addition, supplier certification
or qualification programs provide assurance about the quality of products (Flynn et al., 1995). Prajogo and Olhager (2012) recognized the contribution of suppliers in delivering value to customers and in shortening lead-time performance. The flex-ibility performance is also enhanced by a strong relationship with suppliers (Boyer et al., 1997; Swink et al., 2005; Vinodh and joy, 2012). For example, in the case of increasing demand, building a close relationship and close coordination between a manufacturer and its suppliers is very important (Prajogo and Olhager, 2012) because it increases suppliers’ willingness to manage demand fluctuations or changes in volume production without impacting performance outcomes (Rosenzweig and Roth, 2004). A strong relationship with suppliers also enhances supplier responsiveness and thus increases firms’ flexibility in terms of the ability to modify product quickly and economically (Narasimhan and Das, 1999; Petroni and Bevilacqua, 2002).
At the same time, in a competitive environment, the final customer is an integral part of the supply chain (McAdam and McCormack, 2001). Flynn et al. (1995) highlight the importance of an open relationship to clarify the customer’s desires. Trygg (1993) argues that the early involvement of customers in the product development process enhances lead-time and reduces cost. Customer-focused practices such as obtaining customer‘s future needs and receiving customers feedback enable firms to react more effectively (Vickery et al., 2003; Jacobs et al., 2007). Thus, companies can differentiate from their competi-tors (Day, 2000), improve their operational performance (e.g., Vickery et al., 2003; Closs and Savitskie, 2003), and generate competitive advantage (Vickery et al., 2003; Li et al., 2006; Swink et al., 2007).
The financial performance is enhanced by improving organizational processes, reducing cost (Fullerton et al., 2003;
Christopher and Towill, 2001; Fullerton and Wempe, 2009) and increasing labor and asset productivity (Blackburn, 1991; Golhar and Stamm, 1991; Kinney and Wempe, 2002).
These remarks lead us to propose the following hypotheses: H2a: External lean practices are positively associated with operational performance.
H2b: External lean practices are positively associated with financial performance.
To a firms approach perspective
Several researchers split lean management in “low lean manage-ment” and “high lean managemanage-ment” to determine if differences exist between these two profiles on operational performance (Chavez et al. 2015) and financial performance (Fullerton et al., 2014). This approach is extremely interesting and gives original results compared to regression analysis. This method is well suited when the concept is unidimensional, but it is not appro-priate for a multidimensional concept. Indeed, in the second case, more complex profiles must be created to understand the nature of the different impacts on outcomes. Because the concept of lean management used in this study is bidimensional, there are 4 theoretical combinations of lean management profiles when the median/mean split method is used. Profile 1 can be characterized as firms that have implemented just a few lean practices, both internal and external. This profile can be labeled as “weak-achievers”. Firms in profile 2 can be considered “internal lean dominant” firms. Conversely, profile 3 includes firms that could be considered “external lean dominant” firms. The last profile can be characterized by firms that have strongly implemented both internal and external lean practices. Profile 4 can be identified as “full achievers”.
The problem with this method is that number and shapes of the profiles are a priori defined. It means that some profiles could mathematically exist, but they do not exist in the real-ity. Better methods such as Hierarchical Clusters exist to avoid this problem. With these methods, the number and shape of the profiles are not predefined. This improvement must be considered by researchers even if it is difficult to propose a specific set of hypothesis with these methods. Moreover, regardless of the number or the shape of the profiles, one of them will surely be considered the “best” and another one the “weaker”. It means we must find that firms that belong in the “best” profile have higher levels of operational performance than firms that belong in the “weaker” profile. We also must find that firms that belong in the “best” profile have higher levels of financial performance than firms that belong in the “weaker” profile. There are no formal hypotheses for this part of the study because no probabilistic tests are available to sup-port but results will be discuss in that way.
Methodology
Data collection and measurementTo test these hypotheses, we designed a survey to measure the degree of a firm’s implementation of lean management. We also asked respondents to give information about the operational and financial performance of their firms. More specifically, we
used Shah and Ward’s scale to measure internal and external lean practices. This scale consists of 41 items that measure 10 lean practices. Four of these practices measure external lean: Supplier feedback, Supplier JIT, Supplier development and Cus-tomer involvement. The other six measure internal lean: Pull manufacturing, Continuous Flow manufacturing, Setup time reduction, SPC, employee involvement and TPM. Operational and financial performances were measured with scales used by Fullerton et al. (2014). Operational performance consists of 6 items, and financial performance consists of 4 items. We used a five-point Likert scale ranging from (1) no implementation to (5) complete implementation for lean practices scale and from (1) significant decrease to (5) significant increase for performance scales. Because the survey was sent to French companies, we used the back translation procedure recommended by Brislin (1986) to obtain an accurate French version. Indeed, discussions between translators and the research team allowed us to reduce differences between versions. The complete survey is available in appendix A
France is a good target for this study because a growing trend to outsource activities to lower cost countries was particularly observed. In the last 30 years, 2 million jobs (36% of total jobs) were eliminated by manufacturing firms (Cohen and Buigues, 2014). The need for an efficient use of resources justifies the implementation of lean strategies to secure savings across the supply chain (Cua et al., 2001). It is an important reason to focus on manufacturing firms in France.
A sample of 972 currently employed managers received our invitation to participate in the study. All of these managers have completed a lean management training program. The survey was sent with a cover letter explaining the purpose of the study. Only firms that have already formally started the implemen-tation of lean practices were asked to respond. We contacted respondents twice. The second contact happened one month after the beginning of the study for managers who had not yet responded. Each respondent represents one unique firm. We received a total of 171 valid responses (rates 17.6%), which can be considered satisfactory (Harmon et al., 2002).
We investigated non-response bias by following the procedure suggested by Lambert and Harrington (1990). We compared demographics characteristics between early respondents (n=85, responses after the first mail) and late respondents (n=86, responses after the second mail). More precisely, we have tested differences in age (t=0.815; p=0.416), gender (t=0.225; p=0.823), tenure (t=0.825; p=0.411), and firm sizes (t=0.195; p=0.845). No significant differences were found using T-test. Table 1 provides details of the sample.
Data analysis
The first stage of this study consists of the validation of the two-dimension scale of lean management (Shah and Ward, 2007) in our context. In order to test this scale, structural equation modelling (CFA) was conducted using Amos v21. We first look at fit indices of the original model of Shah and Ward. The fit indices that have been used are Rχ² (Khi² associated with robust maximum likelihood estimator), GFI (goodness of fit index), CFI (comparative fit index), TLI (Tucker-Lewis index), and RMSEA (root mean square error of approximation). GFI, CFI and TLI should be higher than 0.900 to be considered satisfac-tory (Bentler and Benett, 1980), and RMSEA should be lower than 0.080 (Hu and Bentler, 1999). Because of the complexity of the original model, the same method employed by Hofer et al. (2012) was used to drop items if they showed poor loading to their latent factor. Then, a correlation matrix with internal lean practices, external lean practices, operational performance and financial performance was computed.
In the second stage of this study, the relationships between the various constructs were analyzed using structural equation modelling. Operational and financial performance were inte-grated in the model in order to test hypotheses H1a, H1b, H2a, and H2b. Finally, previous results were used to create profiles of lean practices. A highly performant method mixing K-mean clusters and hierarchical clusters was used. More precisely, a first K-mean clusters analysis was performed with a high number of class. We used 1/10 of the sample (17 in our case) to perform it. From this first analysis, class coordinates were recorded. These
TABLE 1
Sample Demographics Sample characteristics
N Sector of activity N
Respondent position Director 24 Food 14
Director operations 42 Machinery 11
SC Manager 37 Pharmaceuticals 20
Lean specialist 23 Electronics 9
Other Operations manager 45 Aeronautics 19
Gender Male 141 Plastics 3
Female 30 Automobile 48
Tenure in the job 1 - 3 years 98 Product of wood 2
4- 6 years 39 Basic metal industry 12
7- 10 years 17 Textiles/paper 4
more than 10 years 17 Energy 6
coordinates were then used to conduct a hierarchical clusters analysis. This step allowed researchers to determine the final number of profiles using the dendrogram generated. Next, a new K-mean clusters analysis was conducted with class coordinates and the final number of profiles. This step is useful because it allows researchers to record final class coordinates. A final K-mean clusters analysis was performed on the original sample using the final class coordinates and final number of profiles. This step by step method significantly increases the number of highly ranked firms at each stage compare to a single K-mean clusters analysis. Figure 1 summarizes this method.
From these profiles of lean management, ANOVAs were performed on operational and financial performance in order to test whether belonging in a specific profile has an impact on performance.
Results
Scale validationFirst, the validity of Shah and Ward (2007) scale’s was tested. The results are presented in Table 2. As expected, the “original” scale has too many items to be replicated in extenso in other studies. Indeed, GFI, TLI and CFI are all below 0.900, which is not satisfactory. The reason for this result is that some items show very low correlations to their own factor. This result is similar to the results found by Hofer et al. (2012) that showed extremely poor lambda for some factors. As Hofer, these few items (JIT 3; SUPDEV2; SPC4; TPM4) were removed from the model, and a new CFA was performed with the “adjusted” model. This time, fit indices for external and internal lean practices are satisfactory.
Bivariate correlations are shown in Table 3. As expected, internal lean practices and external lean practices are highly correlated. All other factors are moderately correlated except for operational performance, which is uncorrelated to external
lean. This finding is not in line with hypothesis H2a, but it needs to be confirmed by a CFA with the complete research model. Hypothesized findings
Before running the complete model, the effects of three control variables were tested on the internal lean practices factor. The results of OLS regressions show that the number of employees (β=0.109; p= 0.210), turnover (β=0.062; p= 0.464) and sector of activities (β=0.055; p= 0.510) are not associated with internal lean. This means that they do not explain any variance in the model (R²= 0.02). The same test was performed on the external Original Sample
Reduced Sample
Final profiles number
determinated Final profiles coordonatesdeterminated Final Classification
K-means clusters
K-means clusters
Classification method used Results used in the next step Hierarchical Clusters K-means clusters (1/10) 2 4 3 3 4 4 1
FIGURE 1
Firms classification method
TABLE 2
Scale validation
Khi²/df GFI TLI CFI RMSEA
Shah and Ward
model’s 1.791 0.739 0.826 0.837 0.068 External lean with
3 dimensions 2.019 0.922 0.894 0.921 0.077 Internal lean with
6 dimensions 1.823 0.861 0.92 0.931 0.070
TABLE 3
Correlation matrix
Ext Lean Int Lean OPRF Means SD
Ext Lean 3.648 1.037
Int Lean 0.607*** 3.293 1.237
OPRF 0.147 0.245*** 2.595 0.901
FPRF 0.268*** 0.267*** 0.182*** 3.296 0.963 *** Sig at p<0.01
lean factor, and similar results were found: number of employees (β=0.816; p= 0.853), turnover (β=0.080; p= 0.347) and sector of activities (β=-0.059; p= 0.479) for a total variance explain of R²= 0.01. These results are extremely satisfactory.
Table 4 shows the results of the CFA conducted with the complete research model. Internal lean practices are significantly correlated to both operational and financial performance. In line with the correlation matrix, the external lean practices are only correlated to financial performance. This evidence strongly supports three of the four hypotheses proposed in the first part of the study. Indeed, H1a, H1b and H2b can be validated, whereas H2a must be rejected.
These results show that firms that implement internal lean practices are associated with both operational and financial performance. These findings are consistent with various empir-ical studies on operational performance (Shah and Ward, 2003; Rahman et al., 2010) and financial performance (Fullerton and McWatters, 2001; Eroglu and Hofer, 2011).
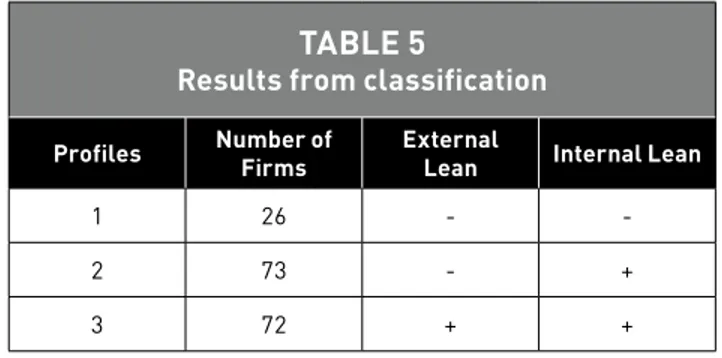
Even if external lean practices seem to be uncorrelated to operational performance, they may have a synergic effect when associated to internal practices. This is why profiles of lean practices have been created. Creating profiles is more accurate than linear regression because it allows researchers to have better information about the impact on performance than simple linear regressions. The results from profiles creation (using a dendro-gram; appendix B) clearly show that the three-profile solution is the best. Descriptions of these profiles are reported in Table 5. These results show that 26 firms belong to Profile 1. Means of external and internal lean practices in this profile are, respect-ively 33.3 and 38.8. In both cases, this is the lowest score, which is why this profile is named “weak achievers”. It is also the
smallest one with 26 firms (15.2%). Profile 2 shows a relatively low score (38.3) on external lean practices and high score on internal lean practices (61). This profile had been named “inter-nal lean dominant”. Seventy-three firms belong in this profile (42.3%). Profile 3 shows the higher scores (44.3 and 80.5) on both internal and external lean practices. This profile has logic-ally been named “full achievers”, and it represents 42.1% of the sample. Not surprisingly, an “external lean dominant” profile was not found. Indeed, even if this profile could mathemat-ically exist under the mean/median split method, in the reality, firms almost always begin lean management with internal lean practices (Holweg, 2007; Shah and Ward, 2007; Demeter and Matyusz, 2011; Green et al., 2014). This structure supposes that when they implement external lean, firms automatically become “full achievers” and not “external lean dominant”. These results confirm the superiority of the “mixed” method over the simple “mean/median” split method.
Table 6 presents the results from ANOVAs conducted with these profiles on operational and financial performance.
These results show significant differences between “full achievers” and the others in operational performance. Indeed, operational performance is 8.2% higher in profile 3 than in profile 1 and 8.1% than in profile 2. Conversely, there is no dif-ference between “weak achievers” and “internal lean dominant”. For financial performance, the results are very different. Significant differences can be observed between the “weak achievers” profile and the other two. More precisely, there is a gain of 14.7% and 17.2%, respectively, to belong in the “internal lean dominant” and “full achievers” profiles rather than the “weak achievers” profile. However, there is no difference between the profiles of “internal lean dominant” and “full achievers”.
TABLE 4
Correlation from complete model
Relationship Hypothe-sis Standardized coefficients t value P
Int Lean → OP PERF H1a 0.287 3.146 *** Int Lean → FI PERF H1b 0.225 2.497 *** Ext Lean → OP PERF H2a -0.048 -0.524 0.600 Ext Lean → FI PERF H2b 0.164 1.66 ** *** Sig at p<0.001 and ** sig at p<0.01; Khi²/df=1.65;GFI=0.870; CFI=0.927; TLI=0.915; RMSEA=0.062
TABLE 5
Results from classification
Profiles Number of Firms External Lean Internal Lean
1 26 -
-2 73 - +
3 72 + +
“-“: under global mean;”+” above global mean
TABLE 6
Differences between profiles of Lean Management on performance
Profiles ∆ means SD Sig Profiles ∆ means SD Sig
1 vs 2 0.036 0.891 0.967 1 vs 2 2.216 0.694 ***
vs 3 2.072 0.893 *** vs 3 2.582 0.695 ***
2 vs 3 2.035 0.648 *** 2 vs 3 0.366 0.505 0.469
Discussion and Implications
Theoretical implicationsShah and Ward (2007) suggest that including both internal and external dimensions reflects the lean landscape more broadly. This study provides some empirical evidence on this issue. Our results corroborate the conceptualization of lean production as a system of internal lean practices and external lean practices. This study extends the operations management literature by provid-ing empirical evidence of the validity of this instrument. This scale captures the integrated nature of lean systems. It includes both the people and the process components on one hand, and internal and external components on the other hand. Our results demonstrate the effectiveness of both internal and external lean practices as valuable resources to enhance performance outcomes.
An important and novel contribution of this study is that the direct effect of external lean practices on financial per-formance is statistically significant. Our results show that improvements in the relationships with suppliers and customers directly impact the firm’s financial performance. This result was not found by Hofer et al. (2012). Another major result is that “full achievers” firms demonstrate significant difference in both operational and financial performance from “weak achievers” firms. The difference between “full achievers” firms and “weak achievers” firms on financial performance is 17.2%. These results highlight the mechanisms needed to achieve the central objective of waste elimination: in order to achieve its potential, lean production must be a holistic business strategy composed of highly interrelated elements engrained in all dimensions of the firm (Camacho-Minano et al., 2013). This highly inter-related component gives lean its ability to achieve distinctive performances (Hofer et al., 2012) and makes it rare and difficult to imitate by competitors (Shah and Ward, 2007).
Even if the difference in operational performance is significant between “full achievers” firms and “internal lean dominant” firms, there is not a significant difference in financial perform-ance. This result indicates that firms that want to keep improving their operational performance must plan to implement external lean practices. In addition, the combination of external and internal lean practices improves operational performance but not financial performance. One explanation is that even incremental improvements are observed in operational performance. This implementation needs an important resource investment and presents additional challenges because it requires changing the practice and the behavior of suppliers (Azadegan et al., 2013). Thus, improvement in operational performance is balanced by the cost of implementing external lean practices.
Managerial implications
This study also has important managerial contributions. The results show that it is not enough for firms to implement well-executed internal lean practices. Instead, firms must work with suppliers and customers to reduce or minimize waste and to have more significant financial performance than “weak achievers”. The extra effort to implement external lean practices is justi-fied even if it presents additional challenges when compared to implementing lean in operations (Azadegan et al., 2013). These findings have high-level implications for executives and
manufacturing managers involved in developing and manag-ing lean strategies. Implementmanag-ing lean production requires lean thinking with a holistic comprehensive business strategy that involves not only manufacturing managers but also all managers involved in development, procurement and distribution (Karls-son and Ahlstrom, 1996). Thus, a practical implication is that manufacturing managers cannot operate in isolation. This study highlights the strategic importance of managing and developing strategic relationships with not only suppliers but also buyers in lean manufacturing contexts (Martino-Jurado and Moyano-Fuentes, 2014). Reorganizing into cells, focusing on continuous improvement, and ensuring quality first-time through reduced waste is important. However, some of the potential gains in operational performance will be forgone unless manufactur-ing personnel join forces with development, procurement and distribution personnel to encourage them to lean their processes and better communicate relevant information with suppliers and customers. World-class companies are the ones that emphasize a cultural transformation through the integration of principles of operational excellence across the enterprise to create a complete and systemic view (Shingo Prize, 2010).
Methodological implications
In the operations management fields, the variable-centered approach has been predominant for a long time. Indeed, almost all articles used OLS regressions or structural equation modelling. This approach consists of adding the score of different factors and then assessing correlations between these factors. In most cases, this approach is relevant and allows researchers to propose high quality conclusions, but it also has a limitation: the variable-centered approach supposes a high sample homogeneity. It means that all firms that compose samples are considered to be the same. In reality, even if precautions have been taken, sample are never perfect. The firm-centered approach rejects the hypothesis of homogeneity and proposes distinguishing “profiles” that are homogenous segments of a population among the sample. Some authors (Chavez et al. 2015; Fullerton et al., 2014; Fullerton et al., 2013) have used the simplest way to perform a “firm-centered” approach by splitting the concept by mean or median and then comparing these two subpopulations on another factor. Using a “Real” firm-centered approach makes sense when the concept in the study is multidimensional as in this research. This methodological choice allows researchers to have new theoretical and managerial implications compared to the variable-centered approach.
To the best of our knowledge, this article is the first to try such approach, but the firm-centered approach is already a valuable complement to the variable-centered approach. Mixed methods -K-mean clusters and hierarchical clusters - have been used to create profiles. This approach provides more inter-esting results compared with other methods (mean/median split) because it does not require selection of the final number of profiles ex ante thanks to hierarchical clusters part of the test. Regardless of the method, this new approach should be examined by authors. Indeed, some previous studies could be reexamined with a firm-centered approach, and new conclusions could be identified from specific parts of the sample. In fact, the firm-centered approach could be the next step to explore more deeply existing relationships in operations management.
Limits and Future research
As with any research, this study has some limitations that represent future research opportunities. First, this study does not use a perfect random sample. Indeed, respondents are all graduates from the same training program. A larger and totally independent sample could increase the generalizability of the results. In addition, like many studies, this study is based on a cross sectional design. It could be interesting to conduct a longitudinal study on profiles of lean practices to verify how fast the transition happened from “weak achievers” to “full achievers”. It could also help researchers to investigate whether “full achievers” firms obtain more financial performance than “internal lean dominant” firms. Such a study could also provide elements on the variation in performance when firms change profiles.
References
Adamides, Emmanuel., Karacapilidis, Nikos., Pylarinou, Charalambia., Koumanakos, Dimitrios., (2008). Supporting collaboration in the development and management of lean supply networks. Production Planning and Control, 19 (1), 35-52. Ahire, Sanjay L., Golhar, Damadar Y., Waller, Matthew A.,
(1996). Development and validation of TQM implementation constructs. Decision Sciences. 27(1), 23-56.
Ahlstrom, Pär., Karlsson, Christer., (1996). Change processes towards lean production: the role of the management accounting system. International Journal of Operations & Production
Management. 16 (11), 42-56.
Alsmadi, Majed., Almani, Ahmad., Jerisat, Rula., (2012). A com-parative analysis of lean practices and performance in the UK manufacturing and services sector firms. Total Quality
Management and Business Excellence. 23 (3-4), 381-396.
Azadegan Arash., Patel Pankaj C., Zangoueinezhad Abouzar., Linderman Kevin., (2013). The effect of environmental com-plexity and environmental dynamism on lean practices, Journal
of Operations Management, 31(2), 193-212.
Bartezzaghi, Emilio., Turco, Fransesco., (1989). The impact of just-in-time on production system performance: an analytical framework. International Journal of Operations & Production
Management. 9(8), 40-62.
Bentler Peter M., Benett David G., (1980). Significance test and goodness of fit in the analysis of covariance structures.
Psychological Bulletin, 88(1), 591-606.
Blackburn, Joseph., (1991). Time-based competition: the next
battleground in manufacturing. Business One Irwin,
Homewood, IL.
Boyer, Kennet K., Keong Leong, G., Ward, Peter T., Krajewski, Lee J., (1997). Unlocking the potential of advanced manufactur-ing technologies. Journal of Operations Management. 15(4), 331-347.
Brislin, Richard W. (1986). The wording and translation of research
instruments, In W.L. Lonner and J.W. Berry (Eds.), Field Methods
in Cross-Cultural Research. Newbury Park, CA: Sage: 137-164.
Browning, Tyson R, Heath, Ralph D., (2009). Reconceptualizing the effects of lean on production costs with evidence from the F-22 program. Journal of Operations Management. 27 (1), 23-44.
Callen, Jeffrey L., Fader, Christiana., Krinsky, Itzhak., (2000). Just-in-time: a cross-sectional plant analysis. International
Journal of Production Economics, 63(3), 277-301.
Camacho-Minano, Maria., Moyano-Fuentes, José., Sacristan-Diaz, Macarena., (2013). What can we learn from the evolution of research on lean management assessment? International
Journal of Production Research. 51 (4), 1098-1116.
Cannon, Alan R., (2008). Inventory improvement and financial performance. International Journal of Production Economics, 115(2), 581-593.
Chang, Shih C., Lin, Ru-Jen., Chen, Jung H., Huang, Li-Hua., (2005). Manufacturing flexibility and manufacturing proactive-ness: empirical evidence from the motherboard industry.
Industrial Management & Data Systems. 105(8), 1115-1132.
Chavez, Roberto., Yu Wantao., Jacobs Mark., Fynes Brian., Wiengarten Franck., (2015), Internal lean practices and performance: the role of technological turbulence. International
Journal of Production Economics, 160(2), 157-171.
Christopher, Martin., Towill, Denis.R., (2001). An integrated model for the design of agile supply chains. International Journal
of Physical Distribution and Operation Management, 31(4),
235-246.
Closs, David J., Savitskie, Katrina., (2003). Internal and external logistics information technology integration. International
Journal of Logistics Management. 14(1), 63-76.
Cocks, Peter., (1996). Partnership in pursuit to lean supply. Journal
of Purchasing & Supply Management. 2, 32-33.
Cohen, Elie., Buigues Pierre-André., (2014). Le Décrochage
indus-triel. Fayard (Eds)
Cua, Kristy O., McKone, Kathleen E., Schroeder, Roger G., (2001). Relationships between implementation of TQM, JIT, and TPM and manufacturing performance. Journal of Operations
Management, 19(6), 675-694.
Day, George.,(2000). Managing market relationships. Academy of
Marketing Science, 28(1), 24-30.
Demeter, Krisztina., Matyusz, Zsolt., (2011). The impact of lean practices on inventory turnover. International Journal of
Production Economics, 133 (1), 154-163.
Eroglu, Cuneyt., Hofer, Christian., (2011). Lean, leaner, too lean? The inventory-performance link revisited. Journal of Operations
Management, 29(4), 356-369.
Flynn, Barbara B., Sakakibara, Sadao., Schroeder, Roger G., (1995). Relationship between JIT and TQM: practices and performance. Academy of Management Journal, 38 (5), 1325-1360.
Fullerton Rosemary R., Kennedy France A., Widener, Sally K., (2013). Management accounting and control practices in a lean manufacturing environment. Accounting Organizations
and Society, 38 (1) 50-71
Fullerton Rosemary R., Kennedy France A., Widener, Sally K., (2014). Lean manufacturing and firm performance: The incremental contribution of lean management accounting practices, Journal of Operations Management, 32, 414-428 Fullerton, Rosemary R., McWatters, Cheryl S., (2001). The
production performance benefits from JIT implementation.
Fullerton, Rosemary R., McWatters, Cheryl S., Fawson, Christopher., (2003). An examination of the relationships between JIT and financial performance. Journal of Operations
Management 21(4), 383-404.
Fullerton, Rosemary R., Wempe, William F., (2009). Lean manu-facturing, non-financial performance measures, and financial performance. International Journal of Operations & Production
Management, 29(3), 214-240.
Furlan, Andrea., Vinelli, Andrea., DalPont, Giorgia., (2011). Complementarity and lean manufacturing bundles: an empirical analysis. International Journal of Operations and Production
Management, 31(8), 835-850.
Gerwin, Donald., (1987). An agenda for research on the flexibility of manufacturing processes. International Journal of Operations
& Production Management, 7(1), 38-49.
Golhar, Damodar Y., Stamm, Carol L., (1991). The just-in-time philosophy: a literature review. International Journal of Production
Research, 29(4), 657-676.
Green, Kenneth W., Inman, Richard A., Birou, Laura M., Whitten Dwayne., (2014). Total JIT (T-JIT) and its impact on supply chain competency and organizational performance. International
Journal of Production Economics, 147, 125-135.
Hallgren, Mattias., Olhager, Jan., (2009). Lean and agile manu-facturing: internal and external drivers and performance outcomes. International Journal of Operations & Production
Management, 29(10), 976-999.
Harmon, Harry A., Brown, Gene., Widing, Robert E., Hammond, Kevin L., (2002). Exploring the sales manager’s feedback to a failed sales effort. Journal of Business and Industrial Marketing. 17(1), 43-55.
Hayes, Robert H., Wheelwright, Steven C., (1984). Restoring Our
Competitive Edge: Competing Through Manufacturing. Wiley,
New York.
Heim, Gregory R., Peng, David X., (2010). The impact of informa-tion technology use on plant structure, practices, and perform-ance: an exploratory study. Journal of Operations Management, 28 (2), 144-162.
Hines, Peter., Holweg, Matthias., Rich, Nick., (2004). Learning to evolve: a review of contemporary lean thinking. International
Journal of Operations & Production Management, 24(10),
994-1011.
Hu, Li-tze., Bentler, Peter M. (1999). Cut off criteria for fit indexes in covariance structure analysis: Conventional criteria versus new alternatives. Structural Equation Modeling, 6, 1-55. Hofer, Christian., Eroglu, Cuneyt., Hofer, Adriana R., (2012).
The effect of lean production on financial performance: the mediating role of inventory leanness. International Journal of
Production Economics, 138 (2), 242-253.
Holweg, Matthias., (2007). The genealogy of Lean production.
Journal of Operations management, 25 (2), 420-437.
Inman, Anthony., Mehra, Satish., (1993). Financial justification of JIT implementation. International Journal of Operations &
Production Management, 13(4), 32-39.
Jacobs, Mark., Vickery, Shawnee.K., Droge, Cornelia., (2007). The effects of product modularity on competitive performance: do integration strategies mediate the relationship? International
Journal of Operations & Production Management, 27(10),
1046-1068.
Jayaram, Jayanth., Vickery, Shawnee., Droge, Cornelia., (2008). Relationship building, lean strategy and firm performance: an exploratory study in the automotive supplier industry. International
Journal of Production Research, 46(20), 5633-5649.
Kannan, Vijay R., Tan, Keah C., (2005). Just in time, total quality management, and supply chain management: understanding their linkages and impact on business performance. Omega, 33(2), 153-162.
Karlsson, Christer., Åhlström, Pär., (1996). Assessing changes towards lean production. International Journal of Operations
and Production Management, 16 (2), 24-42.
Kinney, Michael R., Wempe, William F., (2002). Further evidence on the extent and origins of JIT’s profitability effects. The
Accounting Review, 77(1), 203-225.
Koufteros, Xenophon A., Vonderembse, Mark A., Doll, William J., (1998). Developing measures of time-based manufacturing.
Journal of Operations Management, 16(1), 21-41.
Lambert, Douglas M., Harrington, Thomas C., (1990). Measuring non response bias in customer service mail surveys. Journal of
Business Logistics, 11(2), 5-25.
Lawrence, John., Hottenstein, Michael., (1995). The relationship between JIT manufacturing and performance in Mexican plants affiliated with U.S. companies. Journal of Operations Management, 13 (1), 3-18.
Lee, Sang M., Ebrahimpour, Maling., (1984). Just-in-time produc-tion system: some requirements for implementaproduc-tion. Internaproduc-tional
Journal of Operations & Production Management, 4(4), 3-15.
Levy, David L., (1997). Lean production in an international supply chain. Sloan Management Review, 38(2), 94-102.
Li, Suhong., Subba, Rao S., Ragu, Nathan S., Ragu, Nathan T., (2005). Development and validation of a measurement instru-ment for studying supply chain manageinstru-ment practices. Journal
of Operations Management 23 (6), 618-641.
Li, Subong., Ragu, Nathan B., Ragu, Nathan T., Subba, Rao., (2006). The impact of supply chain management practices on competi-tive advantage and organizational performance. Omega 34(2), 107-124.
Martínez-Jurado, Pedro J., Moyano-Fuentes, José., (2014). Lean management, supply chain management and sustainability: a literature review. Journal of Cleaner Production, 85, 134-150. Matsui, Yoshiki., (2007). An empirical analysis of just-in-time
production in Japanese manufacturing companies. International
Journal of Production Economics, 108 (1-2), 153-164.
McAdam, Rodney., McCormack, Daniel., (2001). Integrating business processes for global alignment and supply chain man-agement. Business Process Management Journal, 7(2), 113-130. Nakamura, Masao., Sakakibara, Sadao., Schroeder, Roger.,
(1998). Adoption of just-in-time manufacturing methods at US and Japanese owned plants: some empirical evidence. Engineering
Management, 45(3), 230-420.
Narasimhan, Ram., Das, Ajay., (1999). An empirical investigation of the contribution of strategic sourcing to manufacturing flex-ibilities and performance. Decision Science, 30 (3), 683-718. Narasimhan, Ram., Das, Ajay., (2001). The impact of purchasing
integration and practices on manufacturing performance. Journal
Narasimhan, Ram., Swink, Morgan., Kim, Soo.W., (2006). Disentangling leanness and agility: an empirical investigation.
Journal of Operations Management. 24(5), 440-457.
Naylor, Ben J., Naim, Mohamed M., Berry, Danny., (1999). Legality: integrating the lean and agile manufacturing paradigms in the total supply chain. International Journal of Production Economics, 62(1-2), 107-118.
Petersen, Kenneth., Handfield, Robert B., Ragatz, Gary L., (2005). Supplier integration into new product development: coordinating product, process and supply chain design. Journal
of Operation Management, 23(3-4), 371-388.
Petroni, Alberto., Bevilacqua, Maurizio., (2002). Identifying manufacturing flexibility best practices in small and medium enterprises. International Journal of Operations & Production
Management, 22(8), 929-947.
Podsakoff, Philip M., MacKenzie, Scott.B., Lee, Jeong., Podsakoff, Nathan., (2003). Common method biases in behavioral research: a critical review of the literature and recommended remedies.
Journal of Applied Psychology, 88(5), 879-903.
Prajogo, Daniel., Olhager, Jan., (2012). Supply chain integration and performance: the effects of long-term relationships, informa-tion technology and sharing, and logistics integrainforma-tion.
International Journal of Production Economics. 135(1),
514-522.
Prajogo, Daniel., Sohal, Amrik S., (2006). The integration of TQM and technology/R&D management undermining quality and innovation performance. Omega (Westport), 34(3), 296-312. Rahman, Shams., Laosirihongthong, Tritos, Sohal, Amrik S.,
(2010). Impact of lean strategy on operational performance: a study of Thai manufacturing companies. Journal of Manufacturing
Technology Management, 21(7), 839-852.
Rosenzweig, Eve D., Roth Aleda V., (2004). Towards a theory of competitive progression: evidence from high-tech manufactur-ing. Production and Operations Management, 13(4), 354-368. Sakakibara, Sadao., Flynn, Barbara B., Schroeder, Roger G.,
Morris, William T., (1997). The impact of just-in-time manu-facturing and its infrastructure on manumanu-facturing performance.
Management Science, 43 (9), 1246-1257.
Shah, Rachna., Chandrasekaran, Aravind., Linderman, Kevin., (2008). In pursuit of implementation patterns: the context to Lean and Six Sigma. International Journal of Production Research, 46(23), 6679-6699.
Shah, Rachna., Ward, Peter T., (2003). Lean manufacturing: context, practice bundles, and performance. Journal of Operations
Management, 21(2), 129-149.
Shah, Rachna., Ward, Peter T., (2007). Defining and developing measures of lean production. Journal of Operations Management, 25 (4), 785-805.
Sheth, Jagdish N., Sharma, Arun., (1997). Supplier relationships: emerging issues and challenges. Industrial Marketing Management, 26(2), 91-100.
Shingo Prize for Operational Excellence, (2010). Model & Application
Guidelines. Version 4. Utah State University, 1-40.
Simpson, Dayna F., Power, Damien J., (2005). Use the supply rela-tionship to develop lean and green suppliers. Supply Chain
Management: An International Journal, 10(1), 60-68.
Sitkin, Sim B., Sutcliffe, Kathleen M., Schroder, Roger G., (1994). Distinguishing control from learning in total quality manage-ment: a contingency perspective. Academy of Management Review, 19 (3), 537-564.
So, Stuart., Sun, Hongyi., (2010). Supplier integration strategy for lean manufacturing adoption in electronic-enabled supply chains.
Supply Chain Management: An International Journal, 15(6),
474-487.
Suarez, Fernando F., Cusumano, Michael A., Fine, Charles H., (1996). An empirical study of manufacturing flexibility in printed circuit board assembly. Operations Research, 44(1), 223-240. Sunder, Vijaya M., (2013). Synergies of Lean Six Sigma. Journal of
Operations Management. 12(1), 21-31.
Swamidass, Paul M., (2003). Modeling the adoption rates of manu-facturing technology innovations by small US manufacturers: a longitudinal investigation. Research Policy, 32 (3), 351-366. Swink, Morgan., Narasimhan, Ram., Kim, Soo W., (2005).
Manufacturing practices and strategy integration: effects on cost efficiency, flexibility, and market-based performance. Decision
Science, 36(3), 427-457.
Swink, Morgan., Narasimhan, Ram., Wang, Cynthia., (2007). Managing beyond the factory walls: effects off our types of strategic integration on manufacturing plant performance.
Journal of Operations Management, 25(1), 148-164.
Trygg, Lars., (1993). Concurrent engineering practices in selected Swedish companies: a movement or an activity of the few? Journal
of Product Innovation Management, 10(5), 403-415.
Vickery, Shawnee., Jayaram, Jayaram., Droge, Cornelia., Calantone, Roger., (2003). The effects of an integrative supply chain strategy on customer service and financial performance: an analysis of direct versus indirect relationships. Journal of
Operations Management, 21(5), 523-539.
Vinodh, S., Joy, Dino., (2012). Structural equation modeling of lean manufacturing practices. International Journal of Production
Research, 50(6), 1598-1607.
Ward, Peter., Zhou, Honggeng., (2006). Impact of information technology integration and lean/just-in-time practices on lead-time performance. Decision Science, 37(2), 177-203.
Womack, James P., Jones, Daniel T., Roos, Daniel., (1990). The
Machine that Changed the World. Rawson Associates,
New-York.
Yazici, Hulya J., (2005). Influence of flexibilities on manufacturing cells for faster delivery using simulation. Journal of Manufacturing
Technology Management, 16(8), 825-841.
Yang, Ma G M, Hong, Paul., Modi, Sachin B., (2011). Impact of lean manufacturing and environmental management on business performance: an empirical study of manufacturing firms.
International Journal of Production Economics, 129, 251-261.
Yeung, A.C.L., Cheng, T.C.E., Kee-hung, Lai., (2006). An oper-ational and institutional perspective on total quality management.
Production Operation Management, 15(1), 156-170.
Yusuf, Yahaya.Y., Adeleye, Olu., (2002). A comparative study of lean and agile manufacturing of a related survey of current practices in the UK. International Journal of Production Research, 40(17), 4545-4562.
APPENDIX A
Translated survey with adjusted scale of Lean Management
External lean practices
Supplier feedback m=3.707 sd= 1.038
• Nous sommes fréquemment en relations étroites avec nos fournisseurs
• Nous faisons un retour à nos fournisseurs sur leurs performances (qualité et délais) • Nous nous efforçons d’établir des relations de long terme avec nos fournisseurs
Supplier JIT m= 3,173 sd= 1,295
• Les fournisseurs sont directement impliqués dans le développement des nouveaux produits • Nos fournisseurs clés nous livrent en Juste à Temps
• Nous avons un programme officiel de certification fournisseur
Supplier development m=3.235 sd= 1.126
• Nos fournisseurs sont contractuellement engagés à effectuer des réductions annuelles de coûts • Nos fournisseurs clés sont implantés tout près de nos usines
• Nous avons un bon niveau de communication sur des questions importantes avec nos fournisseurs • Nous prenons des mesures concrètes pour réduire le nombre de fournisseurs pour chaque spécialité • Nos fournisseurs clés gèrent notre stock
• Nous évaluons nos fournisseurs sur le coût total et non sur la base du prix unitaire
Customer involvement m=4.017 sd= 0.947
• Nous sommes fréquemment en relations étroites avec nos clients
• Nos clients nous font part de leurs retours en termes de qualité et de performance des livraisons • Nos clients sont impliqués directement dans nos choix d’offres de produits actuels et futurs
• Nos clients échangent fréquemment avec le service marketing sur leurs demandes actuelles et futures Internal lean practices
Pull m=3.331 sd=1.337
• La production est « tirée » par l'expédition des produits finis
• La production au poste de travail est « tirée » par la demande du poste suivant. • Nous utilisons un système de production avec flux tirés
• Nous utilisons des Kanban et des signalétiques pour contrôler la production
Flow m= m=3.539 sd=1.155
• Nos produits sont regroupés par similarité de processus de fabrications • Nos produits sont regroupés par similarité de flux logistiques
• Les équipements sont regroupés pour produire des flux continus de produits de même famille • Les familles de produits déterminent l’implantation de notre usine
Setup m=3.321 sd=1.153
• Nos employés préparent leur poste afin de réduire le temps de démarrage
• Nous travaillons à la réduction des temps de préparation des postes dans notre usine • Nous avons de faibles temps de préparation de poste de travail dans notre usine
SPC m=2.972 sd=1.305
• La Maîtrise Statistique des Procédés est déployée sur la majorité de l’équipement de production • Nous utilisons de manière étendue les techniques statistiques afin de réduire la variabilité des processus. • Des graphiques reprenant le taux de défaut sont utilisés comme outils dans les ateliers
• Nous utilisons des diagrammes en arête de poisson (Ishikawa, 5 pourquoi) pour identifier les causes des problèmes de qualité • Nous menons des études de capabilité des processus avant le lancement des produits
Employee involvement m=3.081 sd=1.248
• Les opérateurs jouent un rôle clef au sein des équipes de résolution des problèmes • Les opérateurs émettent des suggestions d’améliorations
• Les opérateurs pilotent des chantiers d’améliorations continues. • Les opérateurs suivent des formations afin de devenir polyvalents
TPM m=3.610 sd=1.164
• Tous les jours du temps est consacré à la maintenance de nos équipements de production • Nous entretenons l’ensemble de nos équipements de production régulièrement
• Nous avons un suivi complet de toutes les opérations de maintenance sur nos équipements de production
• Nous affichons les rapports de maintenance des équipements dans les ateliers pour un partage actif avec les employés.
Operations Performance m=2.595 sd=0.901
Indiquez comment les éléments suivant ont évolués au cours des 3 dernières années : • Les rebuts et les retouches de produits
• Les temps de réglages des machines
• Les files d’attentes et les temps de déplacements • Les temps d’arrêts des machines
• La taille des lots
• Les temps de cycles (financier)
Financial Performance m=3.296 sd=0.963
Indiquez comment les éléments suivant ont évolué au cours des 3 dernières années : • Le chiffre d’affaires
• Le retour sur investissement • La rentabilité globale de l’entreprise • Les parts de marché