CONVECTIVE DRYING BEHAVIOUR OF SAWDUST/SLUDGE
MIXTURES IN A FIXED BED
J. Li
*, L. Fraikin, T. Salmon, E. Plougonven, D. Toye and A. Léonard
Laboratory of Chemical Engineering, University of Liège, Belgium
E-mail of the corresponding author: [email protected]
Abstract
This work is part of a project aiming at developing a renewable fuel for gasification purposes, through the convective drying of sludge/wood mixtures. The first step consists in characterizing the drying behaviour of sludge/sawdust mixtures, in a convective fixed bed dryer. The influence of the mixing step (no mixing against 30 s at 40 rpm) and the sawdust/sludge ratio (1/9, 2/8, 3/7 and 4/6 on a dry basis) was investigated. X-ray tomography, a non-invasive imaging technique, was used to assess changes in volume and exchange surface during drying. The sawdust addition was shown to have a positive impact on the drying process from mass ratio of 2/8. Results showed that the volume and exchange surface increased with higher sawdust addition during the whole drying process. Moreover, a linear decrease of the exchange surface is observed with sludge, while a plateau is reached after a linear phase for sludge/sawdust mixtures. As expected, the drying rate of sludges or sludge/sawdust mixtures decreased nearly linearly with the exchange surface. For sawdust/sludge mixtures, the drying rate continued to decrease after the end of shrinkage, due to internal transfer limitations. These promising results open the way to new valorisation ways, especially for very pasty sludge.
Keywords
:
Sewage sludge; Sawdust; Drying kinetics; Mixing; X-ray tomography; Image analysisINTRODUCTION
Today, rapid world population growth has increased the volume of sewage sludge produced from wastewater treatment plants (WWTP) whilst strict environmental regulations have limited their disposal [1, 2]. So sludge valorisation has become one key issue. In the past years, lots of technologies have been used for sludge valorisation, such as land application [3], composting [4] and incineration [5], but it was found that the moisture content of sludge was a critical parameter governing the feasibility of various final disposal routes [6]. It is now well established that thermal drying operation, after mechanical dewatering, is an essential step prior to current sludge valorisation options. Nevertheless there are still some attempts to find new valorisation routes for sludge.
In this work, it is proposed to generate an original renewable fuel that could enter a combustion or gasification process, by drying the mixture of sludge with sawdust. Sawdust is produced in large amount by the forest industry and also needs safe disposal solutions [7]. Normally the application of sawdust is in the manufacture of compressed biofuels or for making compressed wood boards [8], but new applications should be explored. A mixing machine will be added to the typical industrial sludge drying setup which consists in a belt dryer and sludge extruder. Because of reinforcing the texture of sludge, it can increase drying rate and decrease drying time and then the heat energy supply will be reduced significantly. Sawdust addition can be seen as a way of reinforcing the texture of very soft and pasty sludge which are very difficult to be dried. Positive effects are expected, similarly as the one obtained when performing back mixing of dried sludge: expansion of the sludge bed and enhancement of the area available for heat and mass transfer [9]. Besides the improvement of the drying kinetics, sawdust also brings organic matter useful for gasification.
The present work aims to investigate the drying process of convective drying of sewage sludge and sludge/sawdust mixtures. Sawdust/sludge mixtures are extruded and then dried in a fixed bed convective
dryer. X-ray tomography, a non-destructive imaging technique, is used to follow some 3D characteristics of the bed during the drying process (volume, shrinkage, porosity, exchange surface, ..). The change regularity of characteristics of all samples during drying can be obtained and compared. Then the drying mechanism of sludge with sawdust addition can be analysed.
MATERIALS AND METHODS
Materials
Sludge was collected after the mechanical dewatering step in one WWTP located near the University of Liège (Grosses Battes, Belgium). The moisture content was determined according to standard methods [10] and the initial value was 85.5% (wet basis). Before drying, the sludge is stored at a temperature of 4 °C. This method is adopted to avoid manipulation variations of some characteristics, which were shown in a previous work [11].
Pine sawdust was collected from a wood pellet factory (‘Industrie du bois’, Vielsalm, Belgium) and the moisture content (wet basis) was 30%. The diameter of sawdust was less than 0.5 mm.
In this paper, the drying behaviour of several samples was tested: the original sludge, the mixed sludge (original sludge after mixing without sawdust) and some mixtures (original sludge after mixing with sawdust). A kitchen machine (KM1000, PROline) with a beater was used to prepare the samples. The mass ratio (expressed on a dry matter basis) of sawdust/sludge were 1/9, 2/8, 3/7 and 4/6. Sludge and sawdust were mixed during 30 s at 40 rpm. The same protocol was used to mix the original sludge without any sawdust addition. The samples were then extruded through a disk with circular diesof 12 mm before drying, forming a bed of extrudates on the dryer perforated grid. The weight of the bed of extrudates was fixed at 500 g in all experiments.
Pilot-scale dryer
The drying experiments were carried out in a discontinuous pilot-scale dryer, as shown in a previous paper [9]. In this study, the temperature was 80 °C, with air velocity fixed at 2 m/s. No additional air humidification was carried out. During the whole study, the ambient air humidity was close to 0.004
kgwater/kgdry air. The drying experiments include continuous experiments and intermittent experiments. For
the continuous drying experiments, the sample was continuously weighed during the drying test until the weight reached constant and its mass was recorded every 10 s. For the intermittent drying experiments, the sample was taken out several times in order to do the X-ray tomography experiments. The times that the samples were taken out from the pilot-dryer were 7 min, 15 min, 22 min, 30 min, 45 min, 60 min, 90 min, 120 min and 150 min. The mass of each sample in the dryer was recorded every 10 s too.
X-ray tomography
X-ray tomography was used to determine the influence of sawdust addition on the initial and final structures of the bed of extrudates. This non-invasive technique, originally developed for medical applications, allows obtaining 2D cross sections and 3D images of the bed. The X-ray tomographic device used in this paper was a high-energy X-ray tomograph, first presented by Toye et al. [12]. The energy of the source is 420 kV and 3.5 mA, the pixel size of the image is 0.36 mm and the distance between two slices is 4.4 mm.
Image Analysis
Gray-level images provided by X-ray tomography are formed by two phases: the pore space at low gray levels (dark pixels) and sludge extrudates at high gray levels (bright pixels). A circular mask corresponding to the inner diameter of the drying chamber was first constructed to isolate the sludge bed from the background. Then binarization, i.e. assigning the value 1 to pixels belonging to the sludge and the value 0 to the pixel belonging to the voids, was performed following Otsu’s method [13]. The object volume was total volume of binarised objects within the volume-of-interest (VOI) and the calculation method was the number of voxels of binarised solid objects in the VOI times the voxel volume. The calculation method of the total exchange surface was the total perimeter of the air/solid interface in 2D images, i.e. the pixel edges shared by void and solid pixels, times the distance between two slices. All these operations were implemented in Matlab (Matworks), using the image analysis toolbox version 6.0.
RESULTS AND DISCUSSION
Drying kinetics
The influence of the mixing step (no mixing against 30 s at 40 rpm) and of the sawdust/sludge ratio (1/9, 2/8, 3/7 and 4/6 on a dry basis) has been investigated. Fig. 1 shows the results of drying rate vs. normalized moisture content from continuous drying experiments. X is the water content of the sample and X0 is the initial water content of the sample.
The shapes of drying rate curves are the same as usually encountered for sludges [7]. Three zones can be observed: first, a preheating zone during which the solid temperature and the drying rate increase and reach progressively their maximum value, secondly a narrow plateau, during which the solid temperature and the drying rate remain at their maximum and finally a decreasing rate zone, during which drying proceeds up to completion.
Figure 1: Drying rate vs. normalized moisture content.
Results first confirm the importance of the mixing step on the drying behaviour [12]: the drying rate of the sludge having been mixed is slower than the one of the original sludge (Fig. 1), during most of the drying process. Nevertheless the sawdust addition is shown to have a positive impact on the drying process from mass ratio of 2/8, with observed drying rates on Fig. 2 higher than for the original sludge. In order to compare the drying kinetics of different samples, some drying characteristics including the total amount of evaporated water, normalized amount of water, drying time, average drying rate and normalized drying rate are shown in Table 1. The drying time increases and the average drying rate decreases when the sludge was mixed. With higher sawdust addition, the total amount of evaporated water and drying time decreases, but the average drying rate increases obviously. The positive effect of sawdust addition is clearly observed: the drying rate globally increases with increasing addition of sawdust, while the initial water content decreases as well as the total amount water to be removed. Indeed the same mass is introduced for each experiment.
Table 1. Drying characteristics of sludges and sawdust/sludge mixtures.
Sample Total amount ofevaporated water (g) Normalized amount of water *Drying time 95%DS (s) Average drying rate (g/s) Normalized drying rate Original sludge 424 1.000 5370 0.079 1.000 Mixed sludge 426 1.005 7130 0.060 0.759 Mass ratio=1/9 422 0.995 5970 0.071 0.899 Mass ratio=2/8 411 0.969 4770 0.086 1.089 Mass ratio=3/7 407 0.960 4280 0.095 1.203 Mass ratio=4/6 395 0.932 3720 0.106 1.342
*Drying time 95%DS: The drying time that the dry solid content (DS) reaches to 95%.
The 3D visualization that can be obtained from X-ray tomography provides a convenient way to obtain global and quantitative information on the evolution of the sludge internal structure during drying,
including the volume, volume shrinkage, and total exchange surface during the drying process, which will be shown in the following paragraphs.
Volume and Shrinkage
After 3D image reconstruction, we can get two volumes: bed volume and object volume. The bed volume is simply the total volume of solid and pore space. Fig. 2 shows the time evolution of 3D images of the bed of the original sludge and mixture of mass ratio of 4/6. As mentioned above the distance between two slices used in our experiments is 4.4 mm. Because X-ray tomography used in this work scans samples from the bottom to the top and each scan for one slice takes one minute. The different distance between two slices (1.1 mm, 2.2 mm, 3.3 mm and 4.4 mm) were compared and the deviations of results are smaller than 5%. Then the distance between two slices of 4.4 mm was chosen for the intermittent drying experiments because the bigger distance leads to the shorter time duration. Moreover, the value higher than 4.4 mm wasn’t chosen because of the limit of the number of 2D images
.
For the mixture of mass ratio of 4/6, the initial bed volume increases 15% comparing to the original sludge. During the whole drying process the bed volume of the original sludge reduces significantly and the final bed volume is only around 40% of the initial bed volume. However, the bed volume of the mixture of mass ratio of 4/6 reduces less significantly and then almost keeps constant after 30 min. Moreover, the final bed volume of the mixture of mass ratio of 4/6 is around 70% of the initial bed volume.Figure 2: Time evolution of bed volume of sludge and mixture.
Fig. 3 shows the results of the object volume vs. X/X0 obtained from the 3D images. The object volume
is simply the volume of solid. The initial volume decreases a little after the mixing step but increases a bit with increasing of sawdust addition. During drying, the object volume decreases nearly linearly with the decreased X/X0 for the original sludge and mixed sludge. On the other hand, for the mixtures the object
volume decreases nearly linearly with the decreased X/X0 and then reaches a plateau. For example, the
time that the object volume reaches the plateau is around 22 min for the mixture of mass ratio of 4/6. This is probably because the sawdust braces the structure during drying.
By comparing the volumes before and during drying, it is obviously that the volume during drying is smaller than the volume before drying for each sample. Sample shrinkage during drying is quantitatively represented by volume deformation
defined as1 2 1 V V V (1)
In Eq. (1), V1 and V2 are volumes of each sample before and during drying.
Fig. 4 shows the results of object volume shrinkage vs. X/X0. At the beginning of drying, the values of
shrinkage of all samples are almost the same. During drying the shrinkage increases linearly with the decreased X/X0 for the original sludge and mixed sludge. However, the shrinkage of mixtures decreases
linearly with the decreased X/X0 and then reaches a plateau. The final object volume shrinkage is near 80%
for the original sludge and near 50% for the mixture of mass ratio of 4/6.
Figure 4: Object volume shrinkage vs. normalized moisture content.
Total Exchange Surface
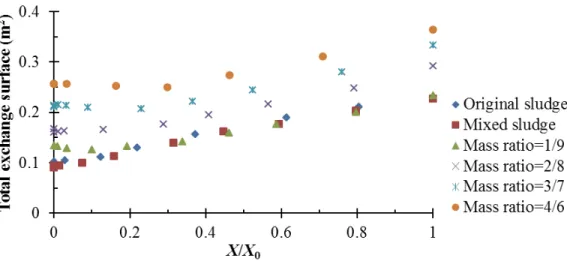
Fig. 5 shows the evolution of the total exchange surface vs. X/X0. The initial total exchange surface
decreases a little after the mixing step but increases significantly with increasing of sawdust addition. This is in agreement with a previous work of our group [15]. The total exchange surface decreases linearly with
X/X0 during the entire drying process for the original sludge and mixed sludge. As long as the water exists
in the sludge during drying, the volume of the sludge shrinks and the surface of sludge reduces. However, it is shown that the regular pattern is different for sawdust/sludge mixtures. At first the total exchange surface decreases linearly with the decreased water content but then reaches a plateau. For example, the time that the total exchange surface of the mixture of mass ratio of 4/6 reaches the plateau is around 22 min. From these results we also know that with higher sawdust addition the contact between the hot air and the sample is better during drying.
Discussion
In accordance with the convective drying theory, three periods can be identified [16, 17].
(1) The preheating period exists which represents a period of adaptation of the sample to the drying conditions. During this period, the drying rate increased considerably.
(2) The next period observed is a constant rate period. It is obvious that this period is very short in our experiments. During this constant rate period the evaporation takes place at the surface of the wet solid and the solid assumes a constant equilibrium temperature, just as a free liquid surface is maintained at the wet-bulb temperature of the air [18]. As explained by Deng et al [16], the evaporated water in this period is free water. In most published papers, the surface change related to shrinkage is not taken in consideration in this period. To be correct, the discussion should be made on the existence of a constant drying flux period. Not taking these physical changes into consideration can lead to the absence of a constant drying flux period in the graphical representation [17].
(3) The third period observed is a long falling rate period. In this period, the drying rate decreases with decreasing moisture contents. However, this falling rate period can be divided into the first decreasing zone and the second decreasing zone. In the first decreasing zone, the evaporation still happens at the solid surface, so the external diffusion of liquid is controlling and the decrease in drying rate is in fact related to the decrease of the total exchange surface. In the second decreasing zone, the evaporation occurs within the solid structure, so the internal diffusion of liquid is controlling and the decreasing in drying rate isn’t related to the total exchange surface [18].
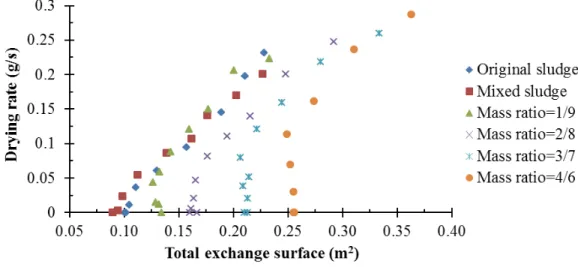
Figure 6: Drying rate vs. total exchange surface.
From Fig. 5, we know that the change regularity of total exchange surface with the moisture content is different between the sludge and mixtures. In order to analyze the drying mechanism, we obtained the relationship between the drying rate and the total exchange surface and the results are shown in Fig. 6. For the original sludge and mixed sludge the drying rate decreases nearly linearly with the decreased total
exchange surface during the whole drying process. This means only the first decreasing zone exists for the sludges. On the other hand, the change regularity is different for the mixtures. At the first place the drying rate decreases nearly linearly with the decreased total exchange surface. Then the total exchange surface doesn’t change but the drying rate still decreases until it reaches zero, this due to internal transfer limitations. Moreover, this means both the first decreasing zone and the second decreasing zone exist for the mixtures.
As shown in Fig. 6, there is a turning point for each mixture. The data of the initial mass of water in sawdust and mass of water in sample bed at turning point are summarized in Table 2. By comparing them it is obvious that the mass of water in the sample bed at turning point is far higher than the initial mass of water in sawdust. So in the second decreasing zone the evaporated water is not just from the sawdust but also from the sludge.
Table 2. Comparison of the initial mass of water in sawdust and mass of water in sample bed at turning point.
Mass ratio of mixture 1/9 2/8 3/7 4/6
Initial mass of water in sawdust (g) 3.38 9.19 12.19 18.19
Mass of water in sample bed at turning point (g) 43.24 54.56 96.44 121.67
This behaviour can be explained by the theory of mobility of the solid matrix [19, 20]. The mobility of the solid matrix is closely related to its physical state; high mobility corresponds to viscoelastic behaviour typical of a rubbery state while low mobility corresponds to an elastic behaviour typical of a glassy state. When drying process in the range of low moisture content the phase transition from rubbery to glassy state [21]. In our experiments, the sludge is in the rubbery state during the whole drying, shrinkage almost entirely compensates for moisture loss, and the volume and exchange surface of the sample decreases linearly with moisture content. But with sawdust addition, the mobility of the solid matrix reduces and it is easier for mixtures to pass from the rubbery to glassy state, and then rigidity of the sample stops shrinkage.
CONCLUSIONS
This work investigated the influence of sawdust addition on the drying behaviour of sewage sludge. The influence of the mixing step (no mixing against 30 s at 40 rpm) and the sawdust/sludge ratio (1/9, 2/8, 3/7 and 4/6 on a dry basis) have been investigated. Both continuous drying experiments and intermittent drying experiments were carried out in a convective pilot-scale dryer. X-ray tomography was used to determine the volume, shrinkage and total exchange surface. The mixing step has a negative impact on the drying process. Nevertheless the drying rate globally increases with increasing addition of sawdust, while the initial water content decreases as well as the total amount water to be removed. For the sludges, the bed volume and total exchange surface both decrease linearly with the decreased X/X0. But for the
mixtures, at first the object volume and total exchange surface decrease linearly with the decreased X/X0
and then reaches a plateau. By comparing the relation between the drying rate and total exchange surface, it was found that only the external diffusion of liquid is controlling for the sludges during drying. But for the mixtures in the beginning of drying the external diffusion of liquid is controlling and then the internal diffusion of liquid is controlling. This is because sawdust addition reduces the mobility of the solid matrix and it is easier for mixtures to pass from rubbery to glassy state, and then rigidity of the sample stops shrinkage. Further work will be done in order to characterize the texture of samples. The behaviour of these samples during pyrolysis using thermo gravimetric analysis will also be investigated.
ACKNOWLEDGMENTS
J. Li is grateful to University of Liège for a postdoctoral grant. L. Fraikin is thankful to the FRS-FNRS for their postdoctoral follow positions (FRFC projects 2.4596.12).
REFERENCES
1 Eshtiaghi, N., Markis, F., Yap, S. D., Baudez, J. C. and Slatter, P., ‘Rheological characterisation of municipal sludge: a review’, Water Research, Vol. 47, No. 15, 2013, pp. 5493–5510.
2 Werle, S. and Wilk, R. K., ‘A review of methods for the thermal utilization of sewage sludge: The Polish perspective’, Renewable Energy, Vol. 35, No. 9, 2010, pp. 1914–1919.
3 Dacera, D. D. M., Babel, S. and Parkpian, P., ‘Potential for land application of contaminated sewage sludge treated with fermented liquid from pineapple wastes’, Journal of Hazardous Materials, Vol. 167, No. 1–3, 2009, pp. 866–872.
4 Kulikowska, D. and Klimiuk, E., ‘Organic matter transformations and kinetics during sewage sludge composting in a two-stage system’, Bioresource Technology, Vol. 102, No. 23, 2011, pp. 10951– 10958.
5 Toledo, J. M., Corella, J., Corella, L. M., ‘The partitioning of heavy metals in incineration of sludges and waste in a bubbling fluidized bed: 2. Interpretation of results with a conceptual model ’, Journal of Hazardous Materials, Vol. 126, No. 1–3, 2005, pp. 158–168.
6 Lee, D. J. and Liu J. C. , ‘Route to synthesize the sludge management processes’, Water Science and
Technology, Vol. 49, No. 10, 2004, pp. 259–266.
7 Berghel, J. and Renstrom, R., ‘Basic design criteria and corresponding results performance of a pilot-scale fluidized superheated atmospheric condition steam dryer’, Biomass and Bioenergy, Vol. 23, No. 2, 2002, pp. 103–112.
8 Srinivasakannan, C. and Balasubramaniam, N., ‘Drying of rubber wood sawdust using tray dryer’,
Particulate Science and Technology, Vol. 24, No. 4, 2006, pp. 427–439.
9 Léonard, A., Meneses, E., Le Trong, E., Salmon, T., Marchot, P., Toye, D. and Crine, M., ‘Influence of back mixing on the convective drying of residual sludges in a fixed bed’, Water Research, Vol. 42, No.10–11, 2008, pp. 2671–2677.
10 ASAE. 1996. ASAE Standard no. D245.5, American Society of Agricultural Engineers (Eds.), MI, USA, St. Joseph, pp. 452–464.
11 Bennamoun, L., Fraikin, L. and Léonard, A., ‘Modeling and simulation of heat and mass transfer during convective drying of wastewater sludge with introduction of shrinkage phenomena’, Drying
Technology, Vol. 32, No. 1, 2014, pp. 13–22.
12 Toye, D., Crine, M. and Marchot, P., ‘Imaging of liquid distribution in reactive distillation packings with a new high-energy X-ray tomograph’, Measurement Science and Technology, Vol. 16, No. 11, 2005, pp. 2213–2220.
13 Otsu, N., ‘A threshold selection method from gray-level histograms’, IEEE Transactions
on Systems, Man, and Cybernetics, Vol. 9, No. 1, 1979, pp. 62–67.
14 Huron, Y., Salmon, T., Blandin, G., Crine, M. and Léonard, A., ‘Effect of liming on the convective drying of urban residual sludges’, Asia-Pacific Journal of Chemical Engineering, Vol. 5, No. 6, 2010, pp. 909–914.
15 Li, J., Fraikin, L., Salmon, T., Bennamoun, L., Toye, D. and Léonard, A., ‘Convective drying of mixtures of sewage sludge and sawdust in a fixed bed’, 4th European Drying Conference, Paris, October, 2–4, 2013, Paris, France.
16 Deng, W., Li, X. , Yan, J. , Wang, F. , Chi, Y. and Cen, K. , ‘Moisture distribution in sludges based on different testing methods’, Journal of Environmental Sciences, Vol. 23, No. 5, 2011, pp. 875–880. 17 Bennamoun, L., Crine, M. and Léonard, A., ‘Convective drying of wastewater sludge: Introduction of
shrinkage effect in mathematical modeling’, Drying Technology, Vol. 31, No. 6, 2013, pp. 643–654. 18 Sherwood, T. K., ‘The drying of solids – II’, Industrial and Engineering Chemistry, Vol. 21, No. 10,
1929, pp. 976–980.
19 Levi, G. and Karel, M., ‘Volumetric shrinkage (collapse) in freeze-dried carbohydrates above their glass transition temperature’, Food Research International, Vol. 28, No. 2, 1995, pp. 145–151.
20 Mayor, L. and Sereno, A. M., ‘Modelling shrinkage during convective drying of food materials: a review’, Journal of Food Engineering, Vol. 61, No. 3, 2004, pp. 373–386.