Research Report
Connectivity graph analysis of the auditory resting state
network in tinnitus
A. Maudoux
a,b,⁎
, Ph. Lefebvre
b,1, J.-E. Cabay
c,2, A. Demertzi
e,3, A. Vanhaudenhuyse
e,3,
S. Laureys
a,d,3,4, A. Soddu
e,⁎⁎
aComa Science Group, Cyclotron Research Center, University of Liege, Sart-Tilman-B30, 4000 Liege, Belgium b
Oto-Rhino-Laryngology, Head and Neck Surgery Department, CHU University Hospital of Liège, University of Liège, Sart-Tilman-B35, 4000 Liege, Belgium
cRadiology Department, CHU University Hospital of Liège, University of Liege, Sart-Tilman-B35, 4000 Liege, Belgium dNeurology Department, University Hospital of Liege, Sart-Tilman-B35, 4000 Liege, Belgium
eComa Science Group, Cyclotron Research Center & Neurology Department, University of Liège, Sart-Tilman-B30, 4000 Liege, Belgium
A R T I C L E I N F O A B S T R A C T
Article history: Accepted 3 May 2012
Thirteen chronic tinnitus patients and fifteen age-matched healthy controls were studied on a 3 T magnetic resonance imaging (MRI) scanner during resting condition (i.e. eyes closed, no task performance). The auditory resting-state component was selected using an automatic component selection approach. Functional connectivity (correlations/anti-correlations) in the extracted network was portrayed by integrating the independent component analysis (ICA) approach with a graph theory method. Tinnitus and control groups showed different graph connectivity patterns. In the control group, the connectivity graph was divided into two distinct anti-correlated networks. The first one encompassed the auditory cortices and the insula. The second one encompassed frontoparietal and anterior cingulate cortices, brainstem, amygdala, basal ganglia/nucleus accumbens and parahippocampal regions. In the tinnitus group, only one of the two previously described networks was observed, encompassing the auditory cortices and the insula. Direct group comparison showed, in the tinnitus group, an increased functional connectivity between auditory cortices and the left parahippocampal region surviving multiple comparisons. We investigated a possible correlation between four tinnitus relevant measures (tinnitus handicap inventory (THI) and tinnitus questionnaire (TQ) scores, tinnitus duration and tinnitus intensity during the scanning session) and the connectivity pattern in the tinnitus Keywords:
fMRI Tinnitus
Auditory resting-sate network Graph analysis
Functional connectivity
Independent component analysis (ICA)
⁎ Correspondence to: A. Maudoux, Cyclotron Research Center, Coma Science Group & OtoRhinoLaryngology Department, University of Liège, Allée du 6 août n° 8, Sart Tilman B30, 4000 Liège, Belgium. Fax: + 32 4 366 29 46, + 32 4 366 75 25.
⁎⁎ Correspondence to: A. Soddu, Coma Science Group, Cyclotron Research Center & Neurology Department, University of Liège, Allée du 6 août n° 8, Sart Tilman B30, 4000 Liège, Belgium. Fax: + 32 4 366 29 46.
E-mail addresses:[email protected](A. Maudoux),[email protected](P. Lefebvre),[email protected]
(J-E. Cabay),[email protected](A. Demertzi),[email protected](A. Vanhaudenhuyse),[email protected]
(S. Laureys),[email protected](A. Soddu).
Abbreviations: BOLD, blood oxygenation level dependent; ICA, independent component analysis; ROI, region of interest
1Fax: +32 4 366 75 25. 2Fax: +32 4 366 72 24. 3Fax: +32 4 366 29 46. 4Fax: +32 4 366 74 99.
0006-8993/$– see front matter © 2012 Elsevier B.V. All rights reserved. doi:10.1016/j.brainres.2012.05.006
A v a i l a b l e o n l i n e a t w w w . s c i e n c e d i r e c t . c o m
population. We observed a significant positive correlation between the beta values of the posterior cingulate/precuneus region and the THI score. Our results show a modified functional connectivity pattern in tinnitus sufferers and highlight the role of the parahippocampal region in tinnitus physiopathology. They also point out the importance of the activity and connectivity pattern of the posterior cingulate cortex/precuneus region to the development of the tinnitus associated distress.
This article is part of a Special Issue entitled Tinnitus Neuroscience.
© 2012 Elsevier B.V. All rights reserved.
1.
Introduction
Tinnitus is defined as a perception of sound in the absence of any external auditory stimuli (Moller, 2011). It is a frequent disorder, about 15% of the population is affected by chronic tinnitus and tinnitus severely affects the quality of life of 1 to 3% of the population (Eggermont and Roberts, 2004). Despite its high prevalence, the underlying functional neuroanatomy of tinnitus remains poorly understood. The prevailing opinion is that tinnitus can initially be a perceptual consequence of altered patterns of intrinsic neural activity generated along the central auditory pathway. However, thereafter, various brain regions seem involved in the persistent awareness of the phenomenon as well as in the development of associated distress leading to disabling chronic tinnitus (Adjamian et al., 2009; De Ridder et al., 2011; Eggermont and Roberts, 2004).
Few studies on tinnitus have assessed cerebral functional connectivity changes. However, it should be stressed that studying connectivity is essential to provide a complete understanding of the abnormal brain. The function of any brain region cannot be understood in isolation but only in conjunction with regions it interacts with (Seghier et al., 2010). Previous tinnitus connectivity studies were mainly done using magnetoencephalography (MEG) and electroencephalography (EEG) techniques. Schlee et al. (2008) investigated cortical functional connectivity using whole-head MEG recording of auditory steady-state responses in tinnitus patients and healthy controls. They found a deviating pattern of long-range functional connectivity in tinnitus that was strongly correlated with individual behavioral ratings of the tinnitus percept. Phase couplings between the anterior cingulate cortex and the right frontal lobe and phase couplings between the anterior cingulate cortex and the right parietal lobe were, respectively, negatively and positively correlated to individual tinnitus distress rating. Another study bySchlee et al. (2009) investigated long-range cortical networks of chronic tinnitus sufferers and healthy controls using resting-state MEG recording. By mapping cortical hubs in tinnitus patients and control subjects it was shown that the two groups displayed differences in the prefrontal, orbitofrontal and the parieto-occipital cortices, mainly in the gamma frequency range.Vanneste et al. (2011c) investigated the differences between neural networks involved in different subtypes of tinnitus (e.g. acute or chronic tinnitus, treatment responder or nonresponder, etc.) using resting-state low density EEG recording. The comparison between recent-onset and chronic tinnitus patients demonstrated that the generators involved in tinnitus seem to change over time with an increased spontaneous activity in several brain areas (auditory cortex for gamma, supplementary motor area for theta, dorsal anterior
cingulate cortex for beta2 and beta3 and insula for beta3 frequency range). This was associated with an overall decrease in connectivity between auditory and non-auditory brain areas, with the exception of an increase in gamma-band connectivity between the left primary and secondary auditory cortices and the left insula, and also between auditory cortices and the right dorsal lateral prefrontal cortex (both networks being connected to the left parahippocampal area). When comparing tinnitus patients responding and non responding to bifrontal transcra-nial direct current stimulation, these authors found modifica-tion of the resting state electrical brain activity in the right auditory cortex and parahippocampal area consisting of a higher gamma band activity for responders (Vanneste et al., 2011a). They also observed an increased gamma functional connectivity between dorsal lateral prefrontal cortex and, respectively, the subgenual anterior cingulate cortex and parahippocampal area.Burton et al. (2012)investigated func-tional connectivity in tinnitus using funcfunc-tional MRI (fMRI). They compared the resting-state activity of 17 patients with bother-some tinnitus and 17 controls. They found increased anti-correlations between the auditory cortex and the visual/ occipital cortex and between the latter and the attention and control networks in tinnitus patients. For the authors, the reciprocal negative correlations in connectivity between these networks might be maladaptive or reflect adaptations to reduce phantom noise salience and conflict with attention to non-auditory tasks. In a recent fMRI study, we compared the resting-state auditory activity of thirteen tinnitus patients and fifteen controls (Maudoux et al., 2012). Our results suggested that the tinnitus percept is not only linked to activity in sensory auditory areas but is also associated to connectivity changes in limbic/ parahippocampal areas, basal ganglia/nucleus accumbens, higher-order prefrontal/parietal associative networks, infraten-torial brainstem/cerebellar and sensory–motor/visual–motor systems. These results provided fMRI evidence for a distributed network of auditory and non-auditory cortical and sub-cortical regions associated with chronic tinnitus pathology.
Finding an effective treatment to reduce tinnitus is chal-lenging. By exploring the brain function of tinnitus patients by means of connectivity analysis, we believe that a better understanding of the neural basis underlying the tinnitus physiopathology could be achieved leading to effective treat-ment options. With the current study, we aimed at better characterizing functional connectivity in tinnitus sufferers. In addition to know which regions tinnitus patients might activate differently we wanted to assess how these regions interact with one another and how these inter-regional interactions deviate from normal. We extracted regions of interest (ROIs) from a fixed effect contrast T-test map comparing tinnitus and
controls' resting-state auditory component. We integrated an ICA approach with a graph theory method allowing us to visualize functional connectivity in the extracted network but also the level of correlation/anti-correlation with the selected auditory independent component time course (Soddu et al., 2012).
2.
Results
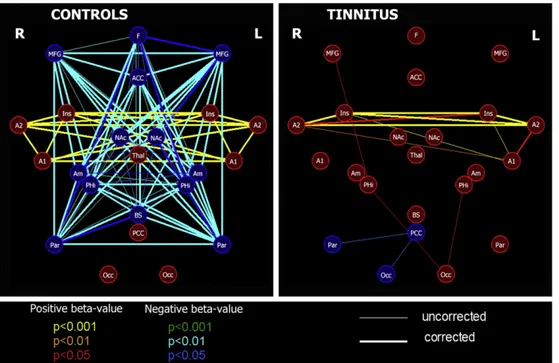
In terms of mean connectivity graphs, the tinnitus group and the control group showed two different connectivity patterns. In the controls, the graph was divided into two distinct anti-correlated networks. The first one encompassed the auditory cortices and both insula. It was composed of ROIs for which, on average (across subjects), BOLD signal was positively correlated to the time course of the auditory component (positive beta-values). The second network was comprised of ROIs for which, on average, BOLD signal was anti-correlated to the time course of the auditory component (negative beta-values). It encompassed frontoparietal regions, anterior cin-gulate cortex, amygdala, brainstem, basal ganglia/nucleus accumbens and the parahippocampal region. In the tinnitus group, only one of the two previously described networks was observed; the regained network encompassed the auditory cortices and the insula. It was similar to the first network described in the control group (Fig. 1).
When comparing the two groups, we observed increased functional connectivity between bilateral auditory cortices
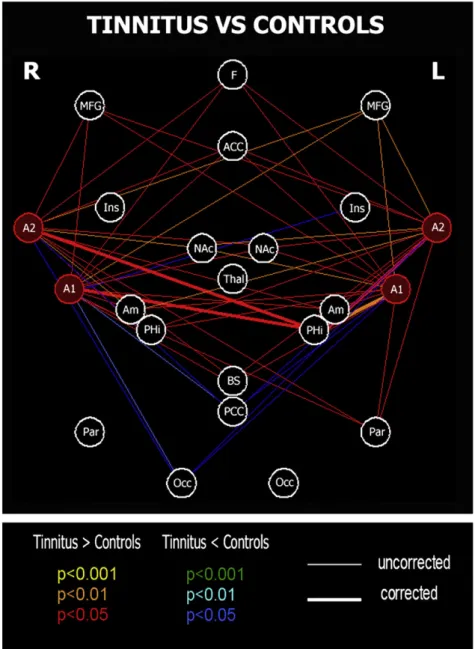
and the left parahippocampal region (p < 0.01 for the connec-tion with the left primary auditory cortex and p < 0.05 for the connection with the three other auditory ROIs, Bonferroni correction applied for multiple comparisons). When looking at the beta values of the auditory regions and of the left parahippocampal region, we see that the increased connec-tivity is explained by the loss, in the tinnitus group, of the anti-correlation pattern observed between these regions in the controls (Fig. 3). We detected a trend toward increased connectivity between auditory cortices and frontoparietal regions, anterior cingulate cortex, basal ganglia/nucleus accumbens, amygdala and brainstem region in tinnitus, even if not surviving Bonferroni correction. There was also a trend toward decreased connectivity between bilateral audi-tory cortices and right occipital region and posterior cingulate cortex (Fig. 2).
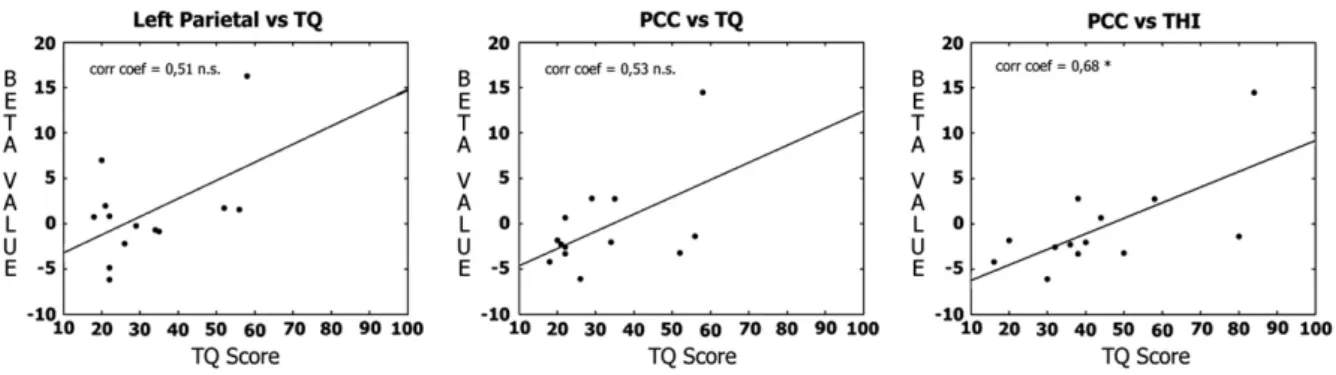
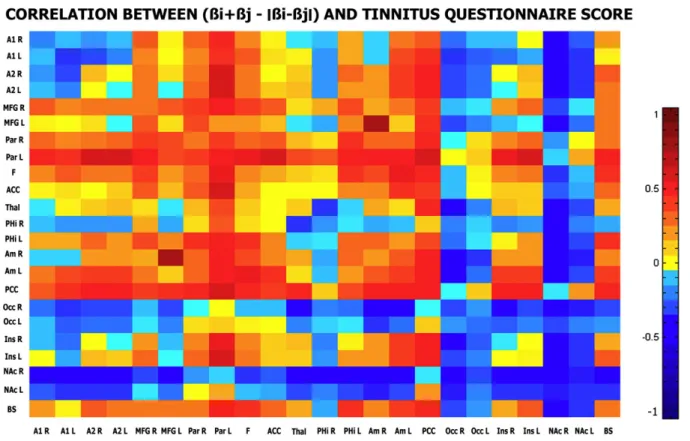
When looking at the correlation analysis performed in the tinnitus group, we observed a positive correlation between the beta values of the posterior cingulate cortex/precuneus region with the tinnitus questionnaire (TQ) and tinnitus handicap inventory (THI) scores and the beta values of the left parietal region with the TQ score. The correlation coefficients were respectively of 0.53, 0.68 and 0.51 (Fig. 4). However, the only correlation with a significant p-value was observed between the posterior cingulate cortex/precuneus and the THI score (p = 0.01). In terms of correlation between connectivity measures of all possible pair of regions of interest (sum of beta-values minus the absolute value of their difference) with the THI and the TQ scores, the
Fig. 1– Connectivity graphs for the 15 healthy controls and the 13 tinnitus patients' groups. Red/blue, orange/cyan and yellow/ green lines represent p = 0.05, p = 0.01 and p = 0.001. Thicker lines are connections surviving correction for multiple
comparisons. Red nodes correspond to ROIs with a positive beta-value (positively correlated to the time course of the auditory component) and blue nodes to ROIs with a negative beta-value (negatively correlated to the time course of the auditory component). A1, Primary auditory cortex; A2, superior temporal gyrus, auditory region; ACC, anterior cingular; Am, amygdala; BS, brainstem; F, mesiofrontal; Ins, insula; MFG, middle frontal gyrus; NAc, basal ganglia/nucleus accumbens; Occ, occipital region; Par, parietal region; PCC, posterior cingulate/precuneus; PHi, parahippocampal gyrus; Thal, thalamus.
correlation patterns observed for the two scores were very similar. Again, it is the connectivity of the posterior cingulate cortex/precuneus with almost all the other regions of interest that appears the most correlated to the individual TQ and THI scores (Fig. 5).
3.
Discussion
We here used resting state fMRI to assess brain functional connectivity modifications in chronic tinnitus sufferers. We should stress that functional connectivity analyses do not provide any information on directionality or causality for the
observed interactions between brain regions. Neither can we exclude the possibility that functional connectivity could be induced by a master region. In the future, effective connec-tivity approaches are expected to shed light on the causal relationship between and among brain regions. We need to mention that the present analysis aimed to describe the underlying functional neuroanatomy of tinnitus sufferers. Whether such modified connectivity pattern is the cause or the consequence of tinnitus remains to be further clarified.
Spontaneous fluctuations in blood oxygenation level depen-dent (BOLD) fMRI signals have aroused high interest in the literature providing tools for the understanding of various clinical entities (Boly et al., 2009; Boveroux et al., 2010; Demertzi et al.,
Fig. 2– Between-group differences of functional connectivity, focusing on connectivity between auditory cortices and other brain regions. Red (blue), orange (cyan) and yellow (green) lines represent p = 0.05, p = 0.01 and p = 0.001 respectively for positive (negative) differences. Thicker lines are connections surviving correction for multiple comparisons. A1, Primary auditory cortex; A2, superior temporal gyrus, auditory region; ACC, anterior cingular; Am, amygdala; BS, brainstem; F, mesiofrontal; Ins, insula; MFG, middle frontal gyrus; NAc, basal ganglia/nucleus accumbens; Occ, occipital region; Par, parietal region; PCC, posterior cingulate/precuneus; PHi, parahippocampal gyrus; Thal, thalamus.
2011; Greicius et al., 2004, 2007; Vanhaudenhuyse et al., 2010; Zhou et al., 2010). Indeed, these fluctuations are shown to be coherent across widely separated brain regions, constituting “resting state networks” (Beckmann et al., 2005; De Luca et al., 2006). It has been hypothesized that these correlated fluctu-ations are representative of functional connections between brain regions. A considerable interest has been directed to the study of the “default mode network”. This network, encom-passing precuneus, mesiofrontal and temporo-parietal junction
areas, appears to have strong negative correlations (anti-correlations) with a network of brain regions commonly activated during the performance of goal-directed cognitive tasks termed the“task-positive” network (Raichle et al., 2001). Based on these observations researchers claimed that the human brain is intrinsically organized into dynamic, orrelated functional networks. They also stated that antic-orrelations may reveal key aspects of functional organization of the brain (Fox et al., 2005; Kelly et al., 2008).
Fig. 3– Increased functional connectivity between bilateral auditory cortices and left parahippocampal region. A. Mean beta value of the right primary auditory cortex, mean beta value of the left parahippocampal region and connectivity measures between those two regions for both tinnitus and control groups. B. Mean beta value of the left primary auditory cortex, mean beta value of the left parahippocampal region and connectivity measures between those two regions for both tinnitus and control groups. C. Mean beta value of the right superior temporal gyrus, mean beta value of the left parahippocampal region and connectivity measures between those two regions for both tinnitus and control groups. D. Mean beta value of the left superior temporal gyrus, mean beta value of the left parahippocampal region and connectivity measures between those two regions for both tinnitus and control groups.
Fig. 4– Correlation between individual beta values of region of interest with tinnitus distress measures. From left to right: correlation between the individual beta values of the left parietal region and the tinnitus questionnaire (TQ) score (corr. coef. = 0.51, p = 0.34), correlation between the individual beta values of the posterior cingulate cortex/precuneus regions (PCC) and the TQ score (corr. coef. = 0.53, p = 0.06) and correlation between the individual beta values of the posterior cingulate cortex/ precuneus regions (PCC) and the tinnitus handicap inventory (THI) score (corr. coef. = 0.68, p = 0.01).
In our connectivity analysis, tinnitus and control groups show two different connectivity patterns. In the controls, the connectivity graph is divided into two distinct anti-correlated networks. The first one encompasses the auditory cortices and
the insula. The second one encompasses frontoparietal regions, anterior cingulate and subcortical areas (basal ganglia/nucleus accumbens, amygdala, parahippocampal regions and brain-stem). In the tinnitus group, only the first network is observed. Fig. 5– Correlation between connectivity measures and tinnitus questionnaire/tinnitus handicap inventory scores. Each color represents the value of the correlation coefficient observed between the connectivity measures of all possible pairs (i,j) of regions of interest (sum of beta-values minus the absolute value of their difference) with respectively the TQ and THI scores.
This “shared” network consists of brain regions generally considered to be part of the auditory resting-state network (Beckmann et al., 2005; Damoiseaux et al., 2006; De Luca et al., 2006; Smith et al., 2009) and reflects the existence of functional connections between auditory regions and the insula. Interest-ingly, the anticorrelation pattern observed in the control group between frontoparietal, anterior cingulate cortex, subcortical regions and the auditory cortices is not observed in the tinnitus population. The absence of a negative correlation between the two neuronal systems seems to corroborate the hypothesized modification of cortical and subcortical functional connectivity in tinnitus (Burton et al., 2012; Schlee et al., 2008, 2009; Vanneste et al., 2011a, 2011c).
The only difference in connectivity surviving multiple comparisons is an increased functional connectivity between auditory cortices and the left parahippocampal region in tinnitus patients. This increase in functional connectivity between auditory and parahippocampal regions in tinnitus is in accordance withVanneste et al. (2011a, 2011c). Comparing resting-state electrical brain activity of tinnitus patients and controls, they reported an increase in gamma frequency band in the parahippocampal area. They also found an increase in connectivity between parahippocampal regions and auditory cortices in tinnitus patients compared to control subjects. Neuroanatomically, the auditory cortex is connected to the parahippocampal cortices. Anatomy studies of the rhesus monkey revealed the existence of reciprocal connections between the associative auditory cortices and the parahippo-campal regions (Engelien et al., 2000). Besides these direct projections there is evidence that auditory information may reach the parahippocampal regions through multisynaptic connections via frontal (Insausti et al., 1987; Van Hoesen et al., 1975) and (para) insular regions (Insausti et al., 1987). By regulating the entrance of auditory information to the medial temporal memory system, where salient information is stored, the parahippocampal region is well situated to play a role for retention of sensory information (Young et al., 1997; Zola-Morgan et al., 1989) and for the evaluation of the salience of an auditory stimulus. In fact, previous Positron Emission Tomography (PET) studies show that brain activity specifically associated with processing of meaningful versus meaningless sounds was lateralized to the left hemisphere and was specifically located in the parahippocampal region (Engelien et al., 2000). It was also suggested that the parahippocampal area has a sensory gating function for irrelevant or redundant auditory input (Boutros et al., 2008) and plays an important role in auditory-mnemonic processing (Engelien et al., 2000). Tinnitus, mistakenly considered as salient by the parahippo-campal region, could be stored in auditory memory leading to a paradoxical auditory memory, i.e. establishment of an auditory memory for an aberrant sound (Shulman et al., 2009). Interest-ingly, previous studies byDe Ridder et al. (2006)showed that selective amobarbital injections in the anterior choroidal artery, which supplies the amagdalohippocampal region, controlateral to the tinnitus percept, could suppress tinnitus. Other neuro-imaging studies also demonstrated the implication of the hippocampal region in tinnitus physiopathology.Shulman et al. (1995)studied the brain activity of two tinnitus patients using single-photon emission computed tomography (SPECT) and reported a modified perfusion of the hippocampal/amygdala
complex bilaterally.Lockwood et al. (1998)used an oxygen-15-water PET scanner to map brain regions responding to changes in tinnitus loudness in four patients who could alter tinnitus loudness by performing voluntary oral facial movements. Modification of regional cerebral blood flow was observed in the left hippocampal region in patients following oral facial movements but also during pure tone stimulation. More-over, dysfunction of the parahippocampal area has already been suggested as an explanation for complex auditory phantom percepts such as auditory hallucinations (Diederen et al., 2010).
When we compare the connectivity graphs of both groups, there is a trend toward an increased connectivity between the auditory regions and the previously described“anti-correlated” network in tinnitus patients and a decreased connectivity between the auditory regions and the occipital cortex. Even if not surviving correction for multiple comparisons (with the exception of the connection with the left parahippocampal region) one could speculate on the meaning of the loss of the distinct anti-correlated organization of the auditory component observed in tinnitus. The observed decrease in connectivity between the auditory and the occipital regions is in accordance with the negative correlation observed between auditory cortices and occipital/visual cortex byBurton et al. (2012). The distributed set of regions part of the“anti-correlated” network (prefrontal, inferior parietal and anterior cingular cortices, amygdala, basal ganglia/nucleus accumbens and parahippo-campal gyrus) have been previously proposed to play an important role in attention, salience and conscious sensory perception. Indeed, the tinnitus literature frequently refers to alteration of “attentional” or “salience” processes to explain neuropathological observations (De Ridder et al., 2011; Husain et al., 2011; Schlee et al., 2008). In the auditory modalities, stimuli trigger electrophysiological responses including steady-state response and miss-match negativities (Bekinschtein et al., 2009; Naatanen et al., 2001). These early responses are followed by a later neuronal response labeled P300 which, as opposed to steady-state response and miss-match negativities, seems dependent on attention and conscious awareness of the stimulus (Del Cul et al., 2007). The fMRI correlates of the auditory miss-match negativities are the activation of superior temporal gyri, including primary auditory cortices. Whereas, the latter electrophysiological response correlates are the activation of a distributed network of brain regions including frontoparietal and anterior cingulate areas (Bekinschtein et al., 2009). Based on these observations, conscious perception of auditory stimuli requires activation of frontoparietal and cingulate regions in addition to activation of the auditory cortices. A recent fMRI study that contrasted detected versus undetected near-threshold noise bursts confirmed these previ-ously mentioned results (Sadaghiani et al., 2009). These observations are in line with theories regarding consciousness (in the context of the present study, consciousness should not refer to the“state of consciousness”, also called wakefulness, but rather to conscious access or conscious processing of a specific information) (Dehaene and Changeux, 2011). To reach awareness, sensory stimuli (e.g. tinnitus) need to have either sufficient bottom-up stimulus strength (salience) and/or a top-down attentional amplification (attention process) (Bayen et al., 2009; Dehaene et al., 2006). According to this theory, top-down
tinnitus attentional amplification is conditioned by extension of brain activation to higher association cortices, particularly parietal, prefrontal and anterior cingulate areas. In light of this hypothesis, the loss of the anti-correlation pattern observed in the tinnitus group between fronto-parietal, anterior cingulate and auditory cortices could suggest increased top-down in-fluences from fronto-parietal areas to temporal auditory areas, resulting in increased tinnitus awareness. The“anti-correlated” network does also encompass the parahippocampal, basal ganglia/nucleus accumbens and amygdala regions. Previous tinnitus theories have suggested that a dysfunction of the parahippocampal and/or nucleus accumbens regions might result in a deficient sensory gating mechanism, increasing salience and providing higher bottom-up strength to tinnitus (De Ridder et al., 2006, 2011; Rauschecker et al., 2010). Similarly, activation of the amygdala pathway can lower the stimulus threshold for conscious perception. Further studies should be done to confirm the loss of the distinct anti-correlated organi-zation of the auditory network observed in tinnitus with regions implicated in attention, salience and conscious sensory percep-tion as, in our study, those modificapercep-tions of connectivity did not survive correction for multiple comparisons. Such modification of connectivity could indeed suggest that the pathophysiological causes of disabling tinnitus (which might be diverse and specific to certain tinnitus subpopulations) might find a common expression in increasing subcortical bottom-up and frontopar-ietal/anterior cingulate top-down influences to temporal audi-tory areas.
Based on previous tinnitus EEG (Vanneste et al., 2011b, 2011c) and MEG (Schlee et al., 2008) studies, it seems that depending on clinical characteristics of the tinnitus population the functional connectivity pattern changes. Our connectivity analysis focused on a tinnitus population composed of chronic tinnitus patients with near to normal hearing. We report the connectivity pattern (correlation and anti-correlation) for this specific population only. However, it is important to note that even if we did select the auditory component for further analysis, our connectivity analysis focused on both regions of the auditory network and extra-auditory regions (i.e. regions that are believed to be related to memory process, anxiety…). In fact, if the time course of the auditory component mainly explained the BOLD signal in regions of the auditory network, it still contributes to the activity of regions belonging to other networks. That is why some of the observed connectivity modifications might still be related to clinical/distress tinnitus measures. In fact, we performed a correlation analysis to see if some tinnitus characteristics might explain the connectivity pattern observed in the tinnitus population. When looking at the results of the correlation analysis performed on the auditory component of tinnitus patients, it seems that the activity and connectivity pattern of the posterior cingulate cortex/precuneus region are related to the importance of the tinnitus distress. Functional imaging studies indicate that the posterior cingulate cortex has an important role in pain processing and in integrating sensory, emotional and mnemonic information (Maddock et al., 2003; Nielsen et al., 2005; Pearson et al., 2011). Indeed, increased activity in the caudal posterior cingulate cortex has been observed in emotional disorders like major depression (Ho et al., 1996), and has been reported to correlate with severity of anxiety symptoms in major depression. We know that tinnitus
subject might be prone to develop major distress due to their condition. In fact, clinical depression has been reported in 20–60% of tinnitus patients (Robinson et al., 2003; Sullivan et al., 1988). Note also the correlation trend between the left parietal region and the TQ score, similar to previous MEG results (Schlee et al., 2008). As to which of the THI or the TQ questionnaire better evaluated the tinnitus distress it is intriguing to note that the correlation patterns observed for both scores were very similar.
In conclusion, we here provide fMRI evidence of brain functional connectivity modification in chronic tinnitus suf-ferers. Our findings stress the importance of the parahippocam-pal region in tinnitus physiopathology and raise the question of possible increased bottom-up and top-down influences of extra-auditory regions to temporal extra-auditory areas in tinnitus subjects. Our results also suggest that the activity and connectivity pattern of the posterior cingulate cortex/precuneus region are related to the development of the tinnitus associated distress.
4.
Experimental procedures
4.1. Patients and controls
Two independent groups were included. Group 1 included 12 control subjects (4 women; mean age 21 years, SD = 3). Group 2 included 13 patients with chronic tinnitus (6 women; mean age 52 years, SD= 11) and 15 age-matched healthy volunteers (6 women; mean age 51 years, SD= 13). The data of the first healthy control group (group 1) were analyzed in order to select auditory ROIs subsequently used for auditory independent component selection in the second group (group 2). Data from group 2 were analyzed to compare the auditory resting-state fMRI activity of healthy subjects and tinnitus patients.
Healthy volunteers and tinnitus patients were free of major neurological, neurosurgical or psychiatric history. Patients with hyperacusis or phonophobia were excluded. Tinnitus patients underwent audiological testing and tinnitus evaluation, they were also screened using the tinnitus handicap inventory (THI) (Newman et al., 1996) and the tinnitus ques-tionnaire (TQ) (Hallam, 1996) (Table 1). According to the World Health Organization grades of hearing impairment (WHO, 1991), only one tinnitus patient had a grade 1 impairment (slight impairment) while all the others had a grade 0 impairment (no impairment). No patients showed profound hearing loss at any frequency (>90 dB above threshold). Four patients didn't exhibit any degree of hearing loss at any of the tested frequencies. The remaining patients exhibited a mild or moderate hearing loss at one or more frequencies (20–40 dB or 40–60 dB above threshold, respectively), and two of these patients demonstrated severe hearing loss in at least one tested frequency (60–90 dB above threshold, on the 4 and 8 kHz). None of the healthy volunteers reported hearing difficulties.
Written informed consent was obtained from all patients and healthy volunteers. The study was approved by the Ethics Committee of the Faculty of Medicine of the University of Liège. 4.2. fMRI data acquisition procedure
In group 1, resting state BOLD data were acquired on a 3 T magnetic resonance scanner (Siemens, Allegra, Germany) with a
gradient echo-planar sequence using axial slice orientation (32 slices; voxel size=3.4×3.4×3 mm3; matrix size=64×64×32;
repetition time=2460 ms, echo time=40 ms, flip angle=90°; field of view=220 mm). A protocol of 350 scans was performed. A T1-weighted MPRAGE sequence was also acquired for registration with functional data on each subject.
In group 2, resting state BOLD data were acquired on a 3 T magnetic resonance scanner (Siemens, Trio Tim, Germany) with a gradient echo-planar sequence using axial slice orienta-tion (32 slices; voxel size=3.0×3.0×3.75 mm3; matrix size=64×
64×32; repetition time=2000 ms, echo time=30 ms, flip angle= 78°; field of view=192 mm). A protocol of 300 scans lasting 600 s was performed. A T1-weighted MPRAGE sequence was also acquired for registration with functional data on each subject. 4.3. Data preprocessing and analysis
fMRI data were preprocessed and analyzed using the “Brain-Voyager” software package (Brain Innovation, Maastricht, The Netherlands) and a previously published method (Soddu et al., 2012). Preprocessing of functional scans included 3D motion correction, linear trend removal, slice scan time correction and filtering out low frequencies of up to 0.005 Hz. The data were spatially smoothed with a Gaussian filter of full width at half maximum value of 8 mm. The functional images from each subject were aligned to the participant's own anatomical scan and warped into the standard anatomical space ofTalairach and Tournoux (1988). The spatial transformation was performed in two steps. The first step consisted in rotating the 3-D data set of each subject to be aligned with stereotaxic axes (for this step the location of the anterior commissure, the posterior commissure and two rotation parameters for midsagittal alignment were specified manually). In the second step, the extreme points of the cerebrum were specified. These points together with the anterior commissure and posterior commissure coordinates were then used to scale the 3-D data sets into the dimensions of the standard brain of theTalairach and Tournoux (1988)atlas using a piecewise affine and continuous transformation.
4.4. Auditory component selection
The selection of the components of interest was based on a previously validated selection method which takes advantage
of the capability of ICA to decompose the signal in neuronal and artifactual sources while preserving the concept of connectivity in a defined network of ROIs (Soddu et al., 2012). Our selection method employed ROIs that were representative regions of previously described auditory resting state network (Beckmann et al., 2005; Damoiseaux et al., 2006; De Luca et al., 2006; van den Heuvel and Hulshoff Pol, 2010). The ROIs were defined on an average auditory map calculated on a group of twelve indepen-dent healthy subjects (group 1). Fourteen ROIs were selected as representative clusters of the Heschl gyrus (Brodmann area 41/ 42), secondary/associative auditory cortices (Brodmann area 22) and the insula of our average auditory map. Similarly to the target ROIs of the auditory component, we then selected six other ROIs representing the most representative regions appearing as anti-correlated regions in the auditory average map calculated on the healthy subjects of group 1 (Table 1, Supplementary materials). These ROIs were used in order to rule out the global signal from the selection. Finally, we picked as auditory component the component that was selected using a compromise between spatial and temporal properties as described bySoddu et al. (2012).
4.5. Connectivity graph analysis
Our connectivity study employed twenty-three ROIs defined on a fixed effect contrast T-test map (Tinnitus vs Controls, group 2). The selected twenty-three ROIs were representative regions of our T-test map (Table 2). The ROIs were set initially to a cubic shape 10 × 10 × 10 mm3, and the center was chosen
accordingly to the most significant voxel of the contrast statistical map but once the ROI was saved in Brain Voyager only the ROI's voxels surviving at p < 0.05 end up making the saved ROI. The only exception to this selection criterion was the inclusion of a ROI corresponding to the left amygdala. We did so in order to have bilateral amygdala regions in our connectivity analysis.
To study connectivity between each pair of target points, we used a previously published method which is based on ICA followed by a General Linear Model (Soddu et al., 2012). After running ICA with thirty components, we used the thirty independent component time courses to regress in the BOLD signal in each of the twenty-three ROIs. The time courses from each ROI were extracted as the arithmetic mean of the Table 1– Tinnitus population.
Participant Sex Age
(years) Tinnitus ear Tinnitus duration (years) Tinnitus frequency (Hz) THI/TQ score Initial onset related to Tinnitus loudness during scan (0–10)
Patient #1 F 44 Right 9 8000 58/35 Unknown 7
Patient #2 M 47 Right 33 3000 38/22 Unknown 10
Patient #3 M 36 Left 1.75 2500 84/58 Sudden deafness 6.5
Patient #4 M 66 Left 2 4000 80/56 Earwax extraction 8
Patient #5 M 67 Left 3.75 1500 30/26 Noise trauma 5
Patient #6 M 57 Bilateral 2 8000 50/52 Unknown 6.5
Patient #7 M 50 Right 10 6000 38/29 Stress 3
Patient #8 F 60 Bilateral > 20 4000 20/20 Fatigue 3
Patient #9 F 42 Right 2.4 3000 40/34 Noise trauma 2.5
Patient #10 M 33 Left 3.5 8000 32/22 Unknown 4
Patient #11 F 60 Bilateral 5 3000 36/21 Unknown 4.5
Patient #12 F 66 Left 2 6000 16/18 Hypoacousis 4
time courses of the voxels belonging to the same ROI. We then extracted the beta-values corresponding to the auditory component for each of the twenty-three ROIs.
In order to build a mean connectivity graph for both populations we drew an edge between each pair of ROIs with a sum of beta-values significantly different (permutation test) from the absolute value of their difference. This enabled us to obtain a connectivity graph for both tinnitus patient and control groups with edges linking regions that are functionally connected in these two populations. Moreover, a color was assigned to each ROI depending on how the averaged time course of the ROI correlated to the time course of the corresponding auditory component. This was made in order to visualize which of the selected ROIs had a spontaneous activity that positively correlated or anti-correlated to the auditory component time course. Red nodes correspond to ROIs with a positive beta-value (with a time course that is positively correlated to the time course of the auditory component) and blue nodes to ROIs with a negative beta-value (with a time course that is anti-correlated to the time course of the auditory component). Two sets of colors were used to represent the edges. Red/dark blue, orange/light blue and yellow/green colors represent edges between ROIs with a sum of beta-values significantly higher than the absolute value of their difference with a p-value of 0.05, 0.01 and 0.001 respectively. Thicker lines are the connections which survive a multiple comparisons Bonferroni correction.
In order to know how, in the tinnitus population, the auditory regions interact with other brain regions and how these inter-regional interactions deviate from normal, we looked at the difference of functional connectivity between tinnitus patients and controls. We focused on functional connectivity between the four auditory ROIs and all nineteen other ROIs. The difference graph shows a connection between each pair of ROIs (in which at
least one of the ROI is either one of the four auditory ROIs mentioned before) for which the sum of beta-values minus the absolute value of their difference is significantly different (permutation test) between tinnitus patients and controls. Red, orange and yellow colors represent edges between ROIs for which the sum of beta-values minus their difference is significantly higher in the tinnitus group. Dark blue, light blue and green colors represent edges between ROIs for which the sum of beta-values minus their difference is significantly higher in the control group. Thickness for the edges in the difference graph has the same meaning as in the mean graphs.
4.6. Correlation analysis in the tinnitus group
We first performed a correlation analysis between beta values of all 23 regions of interest with four tinnitus relevant measures: THI and TQ scores, tinnitus duration and tinnitus intensity during the scanning session (Fig. 4). Based on these first results we then performed a correlation analysis between connectivity measures of all possible pair of regions of interest (sum of beta-values minus the absolute value of their difference) with the THI and the TQ scores (Fig. 5). Each pair of regions is represented by a color depending on the observed correlation coefficient between the connectivity measures of the targeted pair with the TQ and THI scores.
Supplementary data related to this article can be found online athttp://dx.doi.org/10.1016/j.brainres.2012.05.006.
Acknowledgments
The authors thank the technicians of the Department of Radiology for their active participation in the MRI studies in tinnitus patients. This research was funded by the Belgian National Funds for Scientific Research (FNRS), the Tinnitus Prize 2011 (FNRS 9.4501.12), the European Commission, the James McDonnell Foundation, the Mind Science Foundation, the French Speaking Community Concerted Research Action (ARC-06/11-340), the Public Utility Foundation “Université
Européenne du Travail”, “Fondazione Europea di Ricerca
Biomedica” and the University and University Hospital of Liège. A.M. is Research Fellow, A.V. and A.S. are Post-doctoral Fellows, and S.L. is Senior Research Associate at the FNRS.
R E F E R E N C E S
Adjamian, P., Sereda, M., Hall, D.A., 2009. The mechanisms of tinnitus: perspectives from human functional neuroimaging. Hear. Res. 253, 15–31.
Bayen, T., Cleeremans, A., Wilken, P., 2009. The Oxford Companion to Consciousness. Oxford University Press.
Beckmann, C.F., DeLuca, M., Devlin, J.T., Smith, S.M., 2005. Investigations into resting-state connectivity using independent component analysis. Philos. Trans. R. Soc. Lond. B Biol. Sci. 360, 1001–1013.
Bekinschtein, T.A., Dehaene, S., Rohaut, B., Tadel, F., Cohen, L., Naccache, L., 2009. Neural signature of the conscious processing Table 2– Regions of interest used for the connectivity
graph analysis.
Common names (area) x y z p value
R Primary auditory cortex (41) 48 −25 13 < 0.001
L Primary auditory cortex (41) −49 −26 12 0.003
R Superior temporal gyrus (42) 54 −10 9 0.002
L Superior temporal gyrus (42) −53 −11 9 0.004
R Middle frontal gyrus (9) 40 20 34 0.018
L Middle frontal gyrus ( 9) −39 20 34 < 0.0001
R Inferior parietal lobe (19) 40 −67 32 0.002
L Inferior parietal lobe (19) −31 −68 32 0.0001
Mesiofrontal lobe (10) 0 57 16 0.002
Anterior cingulate cortex (24) −1 28 19 0.001
Thalamus −2 −5 5 0.007 R Parahippocampal gyrus 23 −21 −16 0.003 L Parahippocampal gyrus −24 −22 −19 0.005 R Amygdala 18 −7 −14 0.01 L Amygdala −17 −3 −20 0.223 L PCC/precuneus (31) −5 −49 26 < 0.001
R Superior occipital gyrus (18) 15 −75 25 0.002
L Superior occipital gyrus (18) −12 −76 25 < 0.0001
R Insula 43 −7 6 0.002
L Insula −46 −7 10 0.008
R Basal ganglia/NAc 10 −1 −5 0.003
L Basal ganglia/NAc −8 −1 −6 0.023
of auditory regularities. Proc. Natl. Acad. Sci. U. S. A. 106, 1672–1677.
Boly, M., Tshibanda, L., Vanhaudenhuyse, A., Noirhomme, Q., Schnakers, C., Ledoux, D., Boveroux, P., Garweg, C.,
Lambermont, B., Phillips, C., Luxen, A., Moonen, G., Bassetti, C., Maquet, P., Laureys, S., 2009. Functional connectivity in the default network during resting state is preserved in a vegetative but not in a brain dead patient. Hum. Brain Mapp. 30, 2393–2400.
Boutros, N.N., Mears, R., Pflieger, M.E., Moxon, K.A., Ludowig, E., Rosburg, T., 2008. Sensory gating in the human hippocampal and rhinal regions: regional differences. Hippocampus 18, 310–316.
Boveroux, P., Vanhaudenhuyse, A., Bruno, M.A., Noirhomme, Q., Lauwick, S., Luxen, A., Degueldre, C., Plenevaux, A., Schnakers, C., Phillips, C., Brichant, J.F., Bonhomme, V., Maquet, P., Greicius, M.D., Laureys, S., Boly, M., 2010. Breakdown of within- and between-network resting state functional magnetic resonance imaging connectivity during propofol-induced loss of consciousness. Anesthesiology 113, 1038–1053.
Burton, H., Wineland, A., Bhattacharya, M., Nicklaus, J., Garcia, K.S., Piccirillo, J.F., 2012. Altered networks in bothersome tinnitus: a functional connectivity study. BMC Neurosci. 13, 3.
Damoiseaux, J.S., Rombouts, S.A., Barkhof, F., Scheltens, P., Stam, C.J., Smith, S.M., Beckmann, C.F., 2006. Consistent resting-state networks across healthy subjects. Proc. Natl. Acad. Sci. U. S. A. 103, 13848–13853.
De Luca, M., Beckmann, C.F., De Stefano, N., Matthews, P.M., Smith, S.M., 2006. fMRI resting state networks define distinct modes of long-distance interactions in the human brain. Neuroimage 29, 1359–1367.
De Ridder, D., Fransen, H., Francois, O., Sunaert, S., Kovacs, S., Van De Heyning, P., 2006. Amygdalohippocampal involvement in tinnitus and auditory memory. Acta Otolaryngol. Suppl. 50–53.
De Ridder, D., Elgoyhen, A.B., Romo, R., Langguth, B., 2011. Phantom percepts: tinnitus and pain as persisting aversive memory networks. Proc. Natl. Acad. Sci. U. S. A. 108, 8075–8080.
Dehaene, S., Changeux, J.P., 2011. Experimental and theoretical approaches to conscious processing. Neuron 70, 200–227.
Dehaene, S., Changeux, J.P., Naccache, L., Sackur, J., Sergent, C., 2006. Conscious, preconscious, and subliminal processing: a testable taxonomy. Trends Cogn. Sci. 10, 204–211.
Del Cul, A., Baillet, S., Dehaene, S., 2007. Brain dynamics underlying the nonlinear threshold for access to conscious-ness. PLoS Biol. 5, e260.
Demertzi, A., Soddu, A., Faymonville, M.E., Bahri, M.A., Gosseries, O., Vanhaudenhuyse, A., Phillips, C., Maquet, P., Noirhomme, Q., Luxen, A., Laureys, S., 2011. Hypnotic modulation of resting state fMRI default mode and extrinsic network connectivity. Prog. Brain Res. 193, 309–322.
Diederen, K.M., Neggers, S.F., Daalman, K., Blom, J.D., Goekoop, R., Kahn, R.S., Sommer, I.E., 2010. Deactivation of the parahippocampal gyrus preceding auditory hallucinations in schizophrenia. Am. J. Psychiatry 167, 427–435.
Eggermont, J.J., Roberts, L.E., 2004. The neuroscience of tinnitus. Trends Neurosci. 27, 676–682.
Engelien, A., Stern, E., Isenberg, N., Engelien, W., Frith, C., Silbersweig, D., 2000. The parahippocampal region and auditory-mnemonic processing. Ann. N. Y. Acad. Sci. 911, 477–485.
Fox, M.D., Snyder, A.Z., Vincent, J.L., Corbetta, M., Van Essen, D.C., Raichle, M.E., 2005. The human brain is intrinsically organized into dynamic, anticorrelated functional networks. Proc. Natl. Acad. Sci. U. S. A. 102, 9673–9678.
Greicius, M.D., Srivastava, G., Reiss, A.L., Menon, V., 2004. Default-mode network activity distinguishes Alzheimer's disease from healthy aging: evidence from functional MRI. Proc. Natl. Acad. Sci. U. S. A. 101, 4637–4642.
Greicius, M.D., Flores, B.H., Menon, V., Glover, G.H., Solvason, H.B., Kenna, H., Reiss, A.L., Schatzberg, A.F., 2007. Resting-state
functional connectivity in major depression: abnormally increased contributions from subgenual cingulate cortex and thalamus. Biol. Psychiatry 62, 429–437.
Hallam, R.S., 1996. Manual of the Tinnitus Questionnaire (TQ). Psychological Corporation, London.
Ho, A.P., Gillin, J.C., Buchsbaum, M.S., Wu, J.C., Abel, L., Bunney Jr., W.E., 1996. Brain glucose metabolism during non-rapid eye movement sleep in major depression. A positron emission tomography study. Arch. Gen. Psychiatry 53, 645–652.
Husain, F.T., Pajor, N.M., Smith, J.F., Kim, H.J., Rudy, S., Zalewski, C., Brewer, C., Horwitz, B., 2011. Discrimination task reveals differences in neural bases of tinnitus and hearing impairment. PLoS One 6, e26639.
Insausti, R., Amaral, D.G., Cowan, W.M., 1987. The entorhinal cortex of the monkey: II. Cortical afferents. J. Comp. Neurol. 264, 356–395.
Kelly, A.M., Uddin, L.Q., Biswal, B.B., Castellanos, F.X., Milham, M.P., 2008. Competition between functional brain networks mediates behavioral variability. Neuroimage 39, 527–537.
Lockwood, A.H., Salvi, R.J., Coad, M.L., Towsley, M.L., Wack, D.S., Murphy, B.W., 1998. The functional neuroanatomy of tinnitus: evidence for limbic system links and neural plasticity. Neurology 50, 114–120.
Maddock, R.J., Garrett, A.S., Buonocore, M.H., 2003. Posterior cingulate cortex activation by emotional words: fMRI evidence from a valence decision task. Hum. Brain Mapp. 18, 30–41.
Maudoux, A., Lefebvre, P., Cabay, J.-E., Demertzi, A.,
Vanhaudenhuyse, A., Laureys, S., Soddu, A., 2012. Auditory resting-state network connectivity in tinnitus: a functional MRI study. PLoS One 7 (5), e36222 (Electronic publication ahead of print 2012 May 4).
Moller, 2011. Textbook of Tinnitus. Springer.
Naatanen, R., Tervaniemi, M., Sussman, E., Paavilainen, P., Winkler, I., 2001.“Primitive intelligence” in the auditory cortex. Trends Neurosci. 24, 283–288.
Newman, C.W., Jacobson, G.P., Spitzer, J.B., 1996. Development of the Tinnitus Handicap Inventory. Arch. Otolaryngol. Head Neck Surg. 122, 143–148.
Nielsen, F.A., Balslev, D., Hansen, L.K., 2005. Mining the posterior cingulate: segregation between memory and pain
components. Neuroimage 27, 520–532.
Pearson, J.M., Heilbronner, S.R., Barack, D.L., Hayden, B.Y., Platt, M.L., 2011. Posterior cingulate cortex: adapting behavior to a changing world. Trends Cogn. Sci. 15, 143–151.
Raichle, M.E., MacLeod, A.M., Snyder, A.Z., Powers, W.J., Gusnard, D.A., Shulman, G.L., 2001. A default mode of brain function. Proc. Natl. Acad. Sci. U. S. A. 98, 676–682.
Rauschecker, J.P., Leaver, A.M., Muhlau, M., 2010. Tuning out the noise: limbic–auditory interactions in tinnitus. Neuron 66, 819–826.
Robinson, S.K., McQuaid, J.R., Viirre, E.S., Betzig, L.L., Miller, D.L., Bailey, K.A., Harris, J.P., Perry, W., 2003. Relationship of tinnitus questionnaires to depressive symptoms, quality of well-being, and internal focus. Int. Tinnitus J. 9, 97–103.
Sadaghiani, S., Hesselmann, G., Kleinschmidt, A., 2009.
Distributed and antagonistic contributions of ongoing activity fluctuations to auditory stimulus detection. J. Neurosci. 29, 13410–13417.
Schlee, W., Weisz, N., Bertrand, O., Hartmann, T., Elbert, T., 2008. Using auditory steady state responses to outline the functional connectivity in the tinnitus brain. PLoS One 3, e3720.
Schlee, W., Mueller, N., Hartmann, T., Keil, J., Lorenz, I., Weisz, N., 2009. Mapping cortical hubs in tinnitus. BMC Biol. 7, 80.
Seghier, M.L., Zeidman, P., Neufeld, N.H., Leff, A.P., Price, C.J., 2010. Identifying abnormal connectivity in patients using dynamic causal modeling of fMRI responses. Front. Syst. Neurosci. 4.
Shulman, A., Strashun, A.M., Afriyie, M., Aronson, F., Abel, W., Goldstein, B., 1995. SPECT imaging of brain and
tinnitus–neurotologic/neurologic implications. Int. Tinnitus J. 1, 13–29.
Shulman, A., Goldstein, B., Strashun, A.M., 2009. Final common pathway for tinnitus: theoretical and clinical implications of neuroanatomical substrates. Int. Tinnitus J. 15, 5–50.
Smith, S.M., Fox, P.T., Miller, K.L., Glahn, D.C., Fox, P.M., Mackay, C.E., Filippini, N., Watkins, K.E., Toro, R., Laird, A.R., Beckmann, C.F., 2009. Correspondence of the brain's functional architecture during activation and rest. Proc. Natl. Acad. Sci. U. S. A. 106, 13040–13045.
Soddu, A., Vanhaudenhuyse, A., Bahri, M.A., Bruno, M.A., Boly, M., Demertzi, A., Tshibanda, J.F., Phillips, C., Stanziano, M., Ovadia-Caro, S., Nir, Y., Maquet, P., Papa, M., Malach, R., Laureys, S., Noirhomme, Q., 2012. Identifying the default-mode component in spatial IC analyses of patients with disorders of consciousness. Hum. Brain Mapp. 33 (4), 778–796 (Electronic publication ahead of print 2011 Apr 11).
Sullivan, M.D., Katon, W., Dobie, R., Sakai, C., Russo, J.,
Harrop-Griffiths, J., 1988. Disabling tinnitus. Association with affective disorder. Gen. Hosp. Psychiatry 10, 285–291.
Talairach, J., Tournoux, P., 1988. Co-planar stereotactic atlas of the human brain: 3-dimensional proportional system: an approach to cerebral imaging. Thieme.
van den Heuvel, M.P., Hulshoff Pol, H.E., 2010. Exploring the brain network: a review on resting-state fMRI functional connectivity. Eur. Neuropsychopharmacol. 20, 519–534.
Van Hoesen, G., Pandya, D.N., Butters, N., 1975. Some connections of the entorhinal (area 28) and perirhinal (area 35) cortices of the rhesus monkey. II. Frontal lobe afferents. Brain Res. 95, 25–38.
Vanhaudenhuyse, A., Noirhomme, Q., Tshibanda, L.J., Bruno, M.A., Boveroux, P., Schnakers, C., Soddu, A., Perlbarg, V.,
Ledoux, D., Brichant, J.F., Moonen, G., Maquet, P., Greicius, M.D., Laureys, S., Boly, M., 2010. Default network connectivity reflects the level of consciousness in non-communicative brain-damaged patients. Brain 133, 161–171.
Vanneste, S., Focquaert, F., Van de Heyning, P., De Ridder, D., 2011a. Different resting state brain activity and functional connectivity in patients who respond and not respond to bifrontal tDCS for tinnitus suppression. Exp. Brain Res. 210, 217–227.
Vanneste, S., Plazier, M., van der Loo, E., Van de Heyning, P., De Ridder, D., 2011b. The difference between uni- and
bilateral auditory phantom percept. Clin. Neurophysiol. 122, 578–587.
Vanneste, S., van de Heyning, P., De Ridder, D., 2011c. The neural network of phantom sound changes over time: a comparison between recent-onset and chronic tinnitus patients. Eur. J. Neurosci. 34, 718–731.
WHO, 1991. Grades of hearing impairment. Hearing Network News. 1.
Young, B.J., Otto, T., Fox, G.D., Eichenbaum, H., 1997. Memory representation within the parahippocampal region. J. Neurosci. 17, 5183–5195.
Zhou, J., Greicius, M.D., Gennatas, E.D., Growdon, M.E., Jang, J.Y., Rabinovici, G.D., Kramer, J.H., Weiner, M., Miller, B.L., Seeley, W.W., 2010. Divergent network connectivity changes in behavioural variant frontotemporal dementia and Alzheimer's disease. Brain 133, 1352–1367.
Zola-Morgan, S., Squire, L.R., Amaral, D.G., Suzuki, W.A., 1989. Lesions of perirhinal and parahippocampal cortex that spare the amygdala and hippocampal formation produce severe memory impairment. J. Neurosci. 9, 4355–4370.