Noise characterization in millimeter sized micromanipulation systems.
Texte intégral
Figure


Documents relatifs
In the AWN case, the signal-to-noise ratio (SNR), re- ceiver height h and frequency dependent SNR of the sound pressure P SNR and particle velocity U SNR are taken as variables
Then the multi-frequency acoustic calculation method allows us to estimate the noise levels over the mesh and at every points in free space.. The main idea of this approach is to
In any case, since using the inexact variant always does better in the presence of noise, an effective strategy could be to start with a fixed value for δ (say 0.7, since there
On figure 6 are also plotted the conductance G of the crystal deduced from bridge measurements at 1 kHz and the square of the spectrum component of the fluctuating
The introduction of ϕ in the process of identifying vertices, provides an additional capability, that of acquiring a global view of the locations of the vertex points, introducing
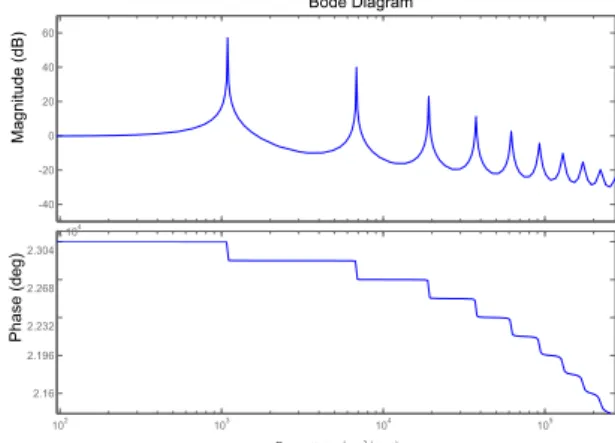
Top : modulus (dB ref. That allows to invert that transfer function in order to filter the signals measured on vehicles, so that the mechanical influence of the system can
In this paper, we have analyzed relative intensity noise of optical heterodyne signals in MMW frequency band for RoF applications and systems, and we have
maximum envelope amplitude of the stacked signals as a function of reduction velocity (slowness) and profile azimuth, for frequency band FB2.. This calculation corresponds to the
