Open Archive TOULOUSE Archive Ouverte (OATAO)
OATAO is an open access repository that collects the work of Toulouse researchers and
makes it freely available over the web where possible.
This is an author-deposited version published in :
http://oatao.univ-toulouse.fr/
Eprints ID : 13227
To link to this article :
DOI:10.1002/cpe.3312
URL :
http://dx.doi.org/10.1002/cpe.3312
To cite this version :
Tsafack Chetsa, Ghislain Landry and Lefèvre,
Laurent and Stolf, Patricia A three step blind approach for improving
HPC systems' energy performance. (2014) Concurrency and
Computation, vol. 26 (n° 15). pp. 2612-2629. ISSN 1532-0626
Any correspondance concerning this service should be sent to the repository
administrator:
[email protected]
A Three Step Blind Approach for Improving
HPC Systems’ Energy Performance
Ghislain Landry Tsafack Chetsa1,2 and Laurent Lefevre1
{ghislain.landry.tsafack.chetsa, laurent.lefevre}@ens-lyon.fr Patricia Stolf2
INRIA, LIP Laboratory (UMR CNRS, ENS, INRIA, UCB) Ecole Normale Superieure de Lyon, Universit´e de Lyon, France
2
IRIT (UMR CNRS), University of Toulouse 118 Route de Narbonne, F-31062 Toulouse CEDEX 9, France
Abstract. Nowadays, there is no doubt that energy consumption has become a limiting factor in the design and operation of high performance computing (HPC) systems. This is evidenced by the rise of efforts both from the academia and the industry to reduce the energy consumption of those systems. Unlike hardware solutions, software initiatives targeting HPC systems’ energy consumption reduction despite their effectiveness are often limited for reasons including: (i) the program specific nature of the solution proposed; (ii) the need of deep understanding of applications at hand; (iii) proposed solutions are often difficult to use by novices and/or are designed for single task environments.
This paper propose a three step blind system-wide, application inde-pendent, fine-grain, and easy to use (user friendly) methodology for im-proving energy performance of HPC systems. The methodology typically breaks into phase detection, phase characterization, and phase identifi-cation and system reconfiguration. And it is blind in the sense that it does not require any knowledge from users. It relies upon reconfigurable capabilities offered by the majority of HPC subsystems – including the processor, storage, memory, and communication subsystems – to reduce the overall energy consumption of the system (excluding network equip-ments) at runtime. We also present an implementation of our method-ology through which we demonstrate its effectiveness via static analyses and experiments using benchmarks representative of HPC workloads.
1
Introduction
With the “race to exascale” one of the major concern for actors involved in the development and operation of HPC systems is no longer the number of PFlops (petaflops) their system can achieve per second, but how many PFlops they can achieve per Watt. This novel fashion of evaluating supercomputers’ performance place a great emphasis on their energy consumption. This interest can be justified by the fact that computer chips seem to have hit a wall, meaning that we can’t make them go any faster. Consequently, supercomputer designers just have to
add more chips to increase computing power. But this approach has a significant impact on energy usage.
However, tremendous efforts are being undertaken by HPC operators from multiple levels to make supercomputers greener. This is evidenced by the Green500 list; its latest issue shows that the greenest supercomputers are getting greener. The rise of graphics processors in massive server clusters and the acquisition of low power memories are probably the main reason of their sudden improvement in energy efficiency. Just to give a global picture, in 2010 Samsung claimed that more that 34TWh/year or $2.2B/year could potentially be saved if the mem-ory in all 11.5Mu servers within the U.S. could be replaced with their Samsung Green DDR3 memory chip [1].
Similar efforts are being carried out regarding all other HPC subsystems from the processor to the network to the storage subsystems. However, significant efforts still need to be made if today’s supercomputers want to meet the 20MW constraint for exascale.
There is a common believe that a considerable share of energy consumed by HCP systems during their operations could be potentially saved if user applica-tions were programmed differently. Put another way, throughout their life cycle, user applications exhibit behaviours whose understanding allows implementing power reduction schemes which can significantly reduce the amount of energy they consume at runtime. This has been proven right by the literature [2–7].
From what precedes, making HPC applications more energy friendly requires designing or rewriting the applications with energy constraints in mind. These alternatives may not always be feasible. Rewriting some HPC applications is so costly that most people find paying the electrical bill worth (There is no evidence; however this issue has been in people’s mind for a while, but to our knowledge no one has proposed an energy efficient version of an application so far) whereas application developers usually don’t pay much attention to how much energy their applications will consume. The main reason to this is that power saving schemes are platform specific. For example, let’s consider the dy-namic voltage and frequency scaling (DVFS) technology which allows scaling the processor’s frequency according to the workload in some cases. Integrating DVFS into a program source code assumes that the developers know all the potential platforms that will run their applications which doesn’t make sense. Although DVFS support is available in nearly all platforms today, at some point one need to select the appropriate frequency at which a specific must run. This can be very difficult to achieve at the coding stage since CPU frequency ranges are processor specific.
One could rely upon existing approaches such as those in the above references, unfortunately they are application specific and require extensive knowledge from those. As a consequence, it can be extremely difficult or near to impossible to implement one of those approaches in your own HPC environment.
In this paper, we present a three step blind methodology for improving en-ergy performance of HPC systems. The methodology typically breaks into phase detection, phase characterization, and phase identification and system
reconfig-uration. And it is blind in the sense that it does not require any knowledge from users. It allows system-wide, application independent, and reconfiguration of HPC subsystems including the processor, memory, storage, and communica-tion subsystems. Its flexibility lies in the fact that it implements power saving schemes relying on computational behaviours also known as phases that the plat-form exhibits instead of those of individual applications. This flexibility enables its use on any HPC cluster provided that mechanisms upon which the power saving schemes rely are available on the platform. We also provide an imple-mentation of our methodology through which we demonstrate its effectiveness considering benchmarks representative of HPC applications.
The remainder of the paper is organised as follows: Background and related work are presented in Section 2. In section 3 we present our general purpose energy saving methodology. Section 4 presents a concrete implementation of the generic methodology for its evaluation along with experimental results. Finally, Section 5 concludes the paper and discusses future work.
2
Related Work
There is a large body of work addressing the issue of power consumption in high performance computing (HPC) systems. These work can be roughly di-vided into off-line and on-line approaches. Off-line approaches necessitating hu-man intervention involve several steps including: source code instrumentation for performance profiling; execution with profiling; determination of the appropriate CPU-frequency for each phase; and source code instrumentation for inserting dy-namic voltage and frequency scaling (DVFS) instructions. Freeh et al. [8] exploit PMPI to time MPI calls to insert DVFS scheduling calls based on duration while Cameron et la. [9] profile MPI communications. Kimura et al. [2] instrumented program source code to insert DVFS directives according to the program’s be-haviour in order to reduce the program’s energy consumption without significant performance degradation.
On-line approaches attempt to detect program execution phases to apply DVFS accordingly. In [6, 10] authors use on-line techniques to detect program execution phases, characterize them and set the appropriate CPU frequency accordingly. They rely upon hardware monitoring counters to compute run-time statistics – cache hit/miss ratio, memory access counts, retired instructions counts – which are then used for program phases detection and characterization. Policies developed in [6, 10] tend to be designed for single task environments. The methodology we present herein bypass that limitation by focusing on the system instead of any individual applications. Its independence from any application allows its implementation on different systems without significant effort.
Online recognition of communication phases in MPI applications was inves-tigated by Lim et al. [5]. Once a communication phase is recognized, authors apply CPU DVFS to save energy. They intercept and record the sequence of MPI calls during program execution and consider a segment of program code to be reducible if there are high concentrated MPI calls or if an MPI call is
long enough. The CPU is then set to run at the appropriate frequency when the reducible region is recognized again.
Power saving schemes presented above are effective in the sense that they per-mit to reduce application’s energy consumption without significant performance degradation; however, those techniques can hardly be used by non experts ei-ther because of the technique itself and/or because they sometimes require deep understanding of the application. For example, although intercepting MPI calls may be transparent, the is still the need to know what the application is doing in between those calls in order to set the appropriate frequency.
More recently in previous works [11, 12], we showed that the energy con-sumption (the energy used when operating) of HPC systems can be significantly reduced through system reconfiguration mechanisms such as using DVFS to scale the processor’s frequency down/up according to the workload. Those work can be seen as instances of the generic methodology we present in this paper; however, in this paper, we present a different phase characterization approach relying on the concept of last level cache per instruction ration (LLCRIR). In addition, the phase identification approach also attempts to classify execution vectors for a better reactivity.
3
Approach Description
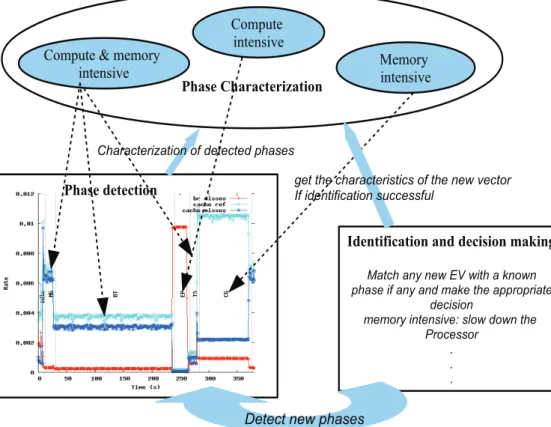
HPC systems throughout their life cycle exhibit several behaviours – in terms of utilisation of resources (processors, memory subsystems, storage subsystems, and communication subsystems) – reflecting execution phases of a specific workload or workloads, which are similar in comparison with other workloads or regions of execution of a specific workload. Taking advantage of workloads variability and reconfigurable hardware, we propose a generic methodology for reducing the energy consumption of HPC systems. Our methodology breaks into three steps including: (i) phase detection , (ii) phase characterization, and (iii) phase identification and reuse of configuration information. It is labelled as “blind” because users do not need any information from workloads or applications being executed on the system. To guide the reader throughout this section, we have summarized the whole methodology in Figure 1, where the phase detection step attempts to detect phases on a system which successively runs five different workloads (in this case, each workload is detected as a specific phase or behaviour the system went through).
3.1 Step 1: Phase Detection
The first step called phase detection is the process through which program/system phase changes are detected. A program phase is a region of execution through-out which a well defined metric is relatively stable. This definition assumes that performance is also relatively stable throughout a specific program phase or phase of execution of the program. Phase detection techniques fall into off-line and on-line techniques. Off-line phase detection techniques are irrelevant to our
!!"#$%&'%(%)(*+, ! !"#$%&-"#.#)(%.*/#(*+, "#$%&'(!)!$($#*+! ,-'(-.,/( "#$%&'(! ,-'(-.,/( 0($#*+! ,-'(-.,/( 01%,(*2*)#(*+,&#,1&1%)*$*+,&3#4*,5 !"#$%&"'(&')*&+,&*-#%&"&.'/*' &0%"1)&-2&"'(&"'3&4".)&#%)&"005/05-"#)& 3)$-1-/' 4)4/5(&-'#)'1-6)7&18/*&3/*'&#%)& 95/$)11/5 : : : ;%"5"$#)5-<"#-/'&/2&3)#)$#)3&0%"1)1& =)#&#%)&$%"5"$#)5-1#-$1&/2&#%)&')*&6)$#/5 >2&-3)'#-2-$"#-/'&1?$$)112?8& @)#)$#&')*&0%"1)1 !"#$%&1%(%)(*+,
Fig. 1.Summary of the methodology on a system which successively runs five different workloads.
case since users only need to launch their applications and the methodology will “magically” do the work for them.
In general, phase detection mechanisms attempt to detect program phase changes, which sometimes require good understanding of the program itself. To avoid that, we suggest detecting phase changes at the system level. This makes sense because program phase changes are also reflected in the behaviour of the system (on which it is running) through resource utilisation. For example, when a program changes from a compute intensive/bound (we use the terms inten-sive or bound interchangeably) phase to a communication inteninten-sive phase, this also results in changes in utilization patterns of processor and communication subsystems. As the methodology is designed for non experts, the on-line phase detection mechanism must require nearly no user intervention. In addition, since phases are often too large for efficient representation and comparison in hard-ware, the detection step also involves compressing those phases (phase detection techniques usually use a few elements for representing and comparing phases).
3.2 Step 2: Phase Characterization
In the presence of dynamically reconfigurable hardware, initiating system recon-figuration at the right time is as important as selecting hardware or software eligible for reconfiguration (for power saving purposes, the most common recon-figurable hardware is the processor). As we mentioned earlier, a system goes through different phases or behaviours throughout its life cycle, so initiating system reconfiguration at the boundary of a phase seems natural; however, re-configuring non eligible for reconfiguration hardware can result in significant performance degradation. The term “significant performance degradation” is a relative term and may be interpreted differently; however, a performance degra-dation of up to 10% is usually acceptable.
Our phase characterization process aims to associate each workload/phase with a label which implicitly indicates the type of system reconfiguration ac-ceptable (which does not result in significant performance degradation) for that specific workload. We define five labels reflecting the kind of workloads a typi-cal HPC system runs on a daily basis. These labels are: (a) compute intensive, (b) memory intensive, (c) mixed, (d) network intensive and (e) I/O intensive. They are self explanatory with the exception of “mixed”. In a few words, work-loads/phases labelled as mixed are both memory and compute intensive, which means that they alternate between memory intensive and compute intensive be-haviours; however, the granularity at which this occurs is low to the point into which they cannot be considered as phases.
3.3 Step 3: Phase Identification and System Reconfiguration
Phase identification is the ability to identify recurring phases, or more generally to identify phases with each other. It is a desirable property for phase detection techniques, since it can be used in tuning algorithms to reuse previously found optimal configurations for recurring phases.
Phase identification is often used in conjunction with phase prediction. If the predicted phase is identified with an existing phase, then the optimal configu-ration (if there is any) for that specific phase is applied to the system. Because the coupling of phase identification and prediction for power/performance im-provement widely depends on the phase detection technique, we will not discuss them in depth in this section.
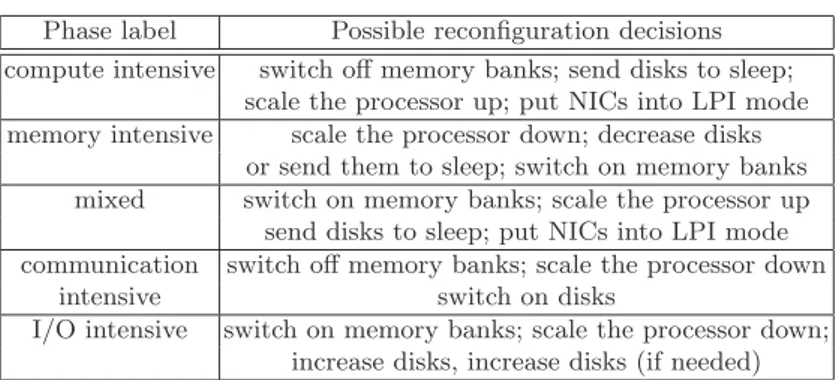
Table 1 summarizes possible reconfiguration decisions that can be taken given a specific workload/phase label. Decisions are selected so as to guarantee that they do not result in significant performance degradation; they lie on the fact that some specific workloads might not need certain resources. Note that some elements in the table are counter-intuitive: switching on memory banks when running I/O intensive workloads is indeed efficient. An increase in RAM size reduces the dependency on disk which in turn improves the overall performance. If the system has several disks, some can be switched off instead of sending them to sleep, the reverse operation is performed if necessary when running I/O inten-sive workloads. Also notice that the disk (respectively the NIC) automatically changes to active when it is accessed.
Table 1.Phase labels and associated energy reduction schemes. Phase label Possible reconfiguration decisions compute intensive switch off memory banks; send disks to sleep;
scale the processor up; put NICs into LPI mode memory intensive scale the processor down; decrease disks
or send them to sleep; switch on memory banks mixed switch on memory banks; scale the processor up send disks to sleep; put NICs into LPI mode communication switch off memory banks; scale the processor down
intensive switch on disks
I/O intensive switch on memory banks; scale the processor down; increase disks, increase disks (if needed)
4
Methodology for Reducing the Energy Consumption of
HPC Systems: an Implementation
In this Section, we present an implementation of our generic methodology for reducing the energy consumption of HPC systems for its evaluation. There is a large body of work investigating phase detection techniques, so we will only provide an overview of the phase detection mechanism used in this work.
The phase detection technique we use relies upon the concept of execution vector (EV). An execution vector is simply a column vector of sensors including hardware performance counters, disk read/write and network byte sent/received counts. Sensors are selected so as to provide insight into resource utilization of the system. EVs are sampled on a per second basis and a phase change occurs when the Manhattan distance (which serves as a similarity metric) between two consecutive EVs exceeds a threshold which varies throughout the life cycle of the system. Note that phase changes are detected at the system level; meaning that we detect phases of the system. The number of EVs collected during a phase is proportional to its length; consequently, long run phases resulting in a huge amount of EVs cannot be efficiently stored. We address this by representing a phase with a single EV: the closest vector to the centroid of the group composed of EVs belonging to that phase. This vector is called reference vector.
4.1 Description of our Phase Characterization Methodology
Unlike off-line phase characterization techniques, on-line phase characterization techniques must guarantee a minimal overhead on the host system. To charac-terize system phases or system behaviours at runtime, we rely upon memory sensitivity of workloads being executed. We define the memory sensitivity met-ric of a workload as its last level cache (LLC) references per instruction ratio (LLCRIR). A high LLCRIR indicates that the workload has stringent memory requirement while a low LLCRIR indicates that the workload is not memory bound. Computing LLCRIR is as simple as reading two hardware events
coun-ters. Beside, modern processors have on-chip integrated facilities for counting events, so reading the counter can be done without any additional overhead.
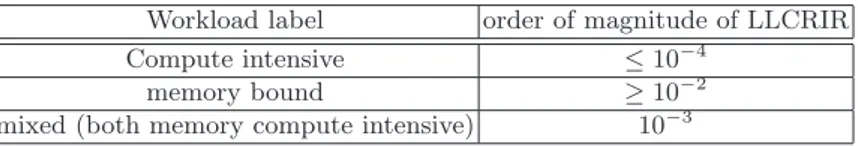
We next associate characterization labels (labels are listed in Section 3.2) with phases or workloads according to the order of magnitude of the average LLC per instruction ratio of the corresponding phases. Table 2 defines the relationship between labels and the order of magnitude of LLC per instruction ratio averaged over corresponding phases (figures in Table 2 are based on empirical evidences). As it can be seen from Table 2, the LLCRIR metric permits us to determine whether a workload is either compute intensive, memory intensive or a mixture of them. However, it does not tell the difference between communication intensive and I/O intensive.
Table 2.Order of magnitude of LLC references per instruction ratio and associated labels.
Workload label order of magnitude of LLCRIR Compute intensive ≤10−4
memory bound ≥10−2
mixed (both memory compute intensive) 10−3
This being an on-line power oriented workload characterization, a detailed workload characterization might be too costly. For characterizing I/O intensive workloads, we use the percentage of CPU time during which I/O requests were issued to any storage devices (bandwidth utilization for the device) as the I/O sensitivity metric; That percentage increases as the load on the disk increases; typically, a value close to 100% indicates that the disk is fully loaded. In this pa-per, we assume that a workload is I/O intensive when its disk utilization exceeds 50% (CPU time during which I/O requests are issued). We do not characterize network or communication intensive workload; instead, we proceed by discrimi-nation meaning that, if a workload does not fall into a known and characterized group then, it is probably network intensive.
4.2 Phase Identification
As mentioned earlier herein, on-line system configuration algorithms often use phase identification together with phase prediction. The rationale behind pre-dicting the next phase is the need to set up the appropriate system configuration at the boundaries of the ongoing phase before the new one gets started. Unfortu-nately, predicting the next phase without any information about the execution pattern of the workloads being executed can be very difficult if not near to impossible.
The similarity between execution vectors of recurring phases is likely to be very high. This said, we implicitly attempt to identify EVs with existing phases and take a reactive decision when the identification process is successful. The reactive decision lies on a principle widely used in caching algorithms; the idea
is that if the system is running a task labelled as label1at time t it is likely to be running a task with the same label at time t + 1 (e.g., if the system is running a memory intensive workload/phase at time t, then it is likely to be running a memory intensive workload at time t + 1). So to summarise, when an EV is iden-tified with an existing phase having a label say label1, then system configuration decisions associated to the corresponding label (label1) are triggered; the same process is repeated for the next vector and so on. For example, if the system is running a memory intensive workload at time t (EVt, execution vector sampled at time t is identified with a memory intensive phase/workload), then it is likely to be running a memory intensive workload at time t + 1; consequently, at time tthe system can be configured for running memory intensive workloads.
This works as long as EVt is identified with an existing phase, but what happen when EVtis unknown to the management mechanism (it is not identified with any known phase)? We assume that any unknown EV indicates a new type of workload and consequently a default system configuration can be defined for such cases. To mitigate the risk of degrading performance we define the default configuration as the optimal system configuration (system configuration offering acceptable performance over a wide array of workloads) regarding performance.
4.3 Experiments and Results Analysis
Platform Description We evaluate our methodology on a 25 node cluster system (100 cores in total) set up on the French large-scale experimental platform called Grid5000 [13]. Each node is an Intel Xeon X3440 with 4 cores and 16 GB of RAM. Available frequency steps for each core are: 2.53 GHz, 2.40 GHz, 2.27 GHz, 2.13 GHz, 2.00 GHz, 1.87 GHz, 1.73 GHz, 1.60 GHz, 1.47 GHz, 1.33 GHz and 1.20 GHz. The Intel Xeon X3440 is provided with dynamic voltage and frequency scaling (DVFS) technology which allows users to scale its frequency and voltage in order to reduce the energy consumption of the processor. All the reconfiguration decisions are directed towards the processor since it is the sole component dynamically reconfigurable without extensive efforts (via DVFS) available to our evaluation platform.
Nodes are interconnected with Infiniband-20G and Linux kernel 2.6.35 is installed on each of them; perf event is used to read the hardware monitoring counters. Class B problem set of benchmarks – including Block Tri-diagonal solve (BT), Embarrassingly Parallel (EP), Conjugate Gradient (CG), Multi-Grid (MG), discrete 3D fast Fourier Transform (FT), Integer Sort (IS), and Scalar Penta-diagonal solver (SP) – from NPB-3.3 [14] is used for the experiments. During the experiments, NPB benchmarks use OpenMPI as message passing interface (MPI) library.
The approach is implemented using two components both residing of each node of the cluster. The two components act in a client server like fashion. The client side captures resource utilisation metrics and performance counters and implements system reconfiguration decisions; whereas the server side per-forms phase detection, phase characterization and identification. The decisions
are taken locally to each node; however, the server (side available on each) node is capable of acting as a central server if a centralized decision maker is needed. Experimental Methodology and Results As the methodology is designed to take advantage of varying workloads; the main objective is to see how the system reacts under different types of workloads. To this extent, we first define two basics system reconfiguration decisions targeting the processor. These decisions involve running workloads labelled as compute intensive at 2.53GHz, workloads labelled as memory intensive at 1.87GHz, and those labelled as mixed at 2.00GHz. These processor frequencies are not selected so as to guarantee that energy will be saved, but to make the impact of the methodology noticeable; however, they must be carefully selected in a production environment.
We next randomly executed workloads listed above several times to see how the system reacts in their presence. In a few words, EP and MG are compute intensive; BT, FT, and SP are mixed workloads and must fall into the mixed group at runtime; whereas, CG and IS are memory intensive workloads.
Initially, the processor’s frequency on each node of the cluster is set to its maximum (2.53GHz in this specific case), which means that we first assume that all the workloads are compute intensive. This is arguable; however, we be-lieve it guarantees a certain quality of service to workloads unbeknown to the management mechanism. With the frequency sets, we randomly execute each of the above workload five times (we selected five times because of the time con-straint) while letting the system decides by itself the appropriate category of each workload. The system selects the label/category of the workload through setting the processor’s frequency to the appropriate value. For example, for a compute intensive workload, the processor’s frequency must be set to 2.53GHz, it is set to 2GHz and 1.87GHz for mixed and memory intensive workloads re-spectively. Since the characteristics of a workload are only known to the system when that workload has already been seen in the past (remember that the idea is to reuse configuration information for recurring phases/workloads) or when a similar workload is already known, we do not expect the first instance of any workloads to fall in the right category (or to be labelled by the most convenient label). Roughly speaking, the first instance of each workload serves as a reference point since it is likely to run at the highest frequency available.
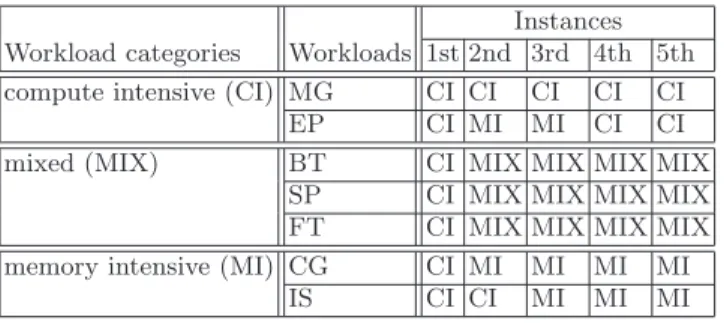
Table 3 summarises decisions made by the system management mechanism. As expected, the first instance of each workload is considered compute intensive (CI in the table), because at that point the management mechanism does not have any information about them. Still from Table 3, we can notice that EP which is compute intensive was labelled memory intensive twice; however, the management mechanism redeemed itself for the 4th and 5th instances. Overall, Table 3 indicates that our methodology is capable of detecting, charactering, and identifying recurring workloads or specific phases of a workload.
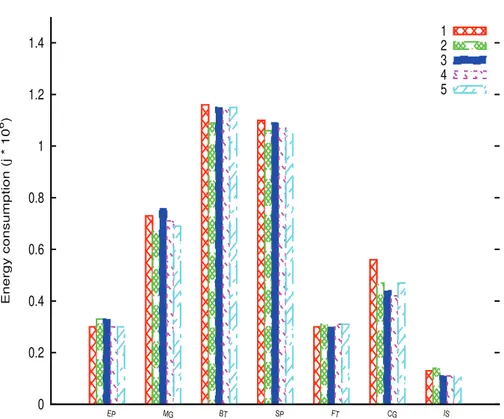
Figure 2 – where the legend from 1 to 5 represents the order of occurrence of each workload (1 for the 1st occurrence of the workload, 2 for the 2nd, 3 for the 3rd, 4 and 5 for the 4th and 5th occurrences respectively) – shows the impact of
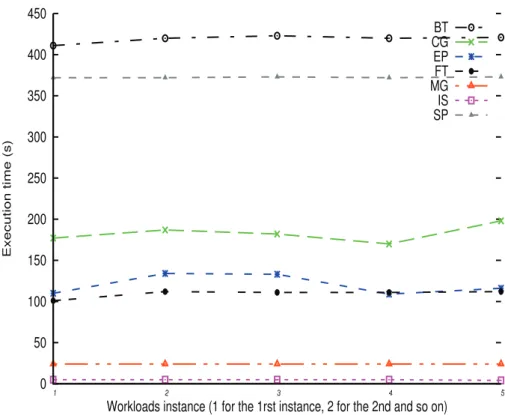
the management mechanisms on the energy consumption of recurring workloads. Figure 3 shows the execution time of each instance of the workloads at hand. Figure 2 and Figure 3 indicates that on the system provided with energy reduc-tion technologies, one can fully take advantage of our three step methodology to reduce the energy consumption of the overall computing infrastructure without significant performance degradation. On the one hand, the approach is capable of reducing the energy consumption of some workloads such as MG with nearly no performance degradation (Figure 3). On the other hand, for applications such as FT, BT, and SP the benefit in terms of energy reduction is less noticeable because of the increase in their execution time. However, the system was able to correctly label them; this suggests that their poor performance might be related to the CPU frequency at which they were run.
Table 3.Recurring workloads identification along with associated characteristics Instances
Workload categories Workloads 1st 2nd 3rd 4th 5th compute intensive (CI) MG CI CI CI CI CI
EP CI MI MI CI CI mixed (MIX) BT CI MIX MIX MIX MIX
SP CI MIX MIX MIX MIX FT CI MIX MIX MIX MIX memory intensive (MI) CG CI MI MI MI MI
IS CI CI MI MI MI
5
Conclusion
In this paper, we present a generic methodology to efficiently address the energy consumption problem of high performance computing (HPC) systems. It takes advantage of the variability of workloads that a typical HPC system runs on a daily basis, and breaks into three steps including (i) phase detection which attempts to detect system phases/behaviour changes; (ii) phase characterization which associate a characterization label to each phase (the label indicates the type of workload); (iii) finally, phase identification and system reconfiguration attempt to identify phase with known phase and make reactive decisions when the identification process is successful.
We further presented an implementation of the generic methodology and show how it can be used to effectively address the energy consumption in a system which experiences varying workloads. Results obtained with benchmarks representative of HPC systems show that in a HPC environment where power reductions technologies are available, our three step methodology can fully take advantage of those power reduction technologies to reduce energy consumption without any information about workloads being executed. As future work, we
0 0.2 0.4 0.6 0.8 1 1.2 1.4 EP MG BT SP FT CG IS Energy consumption (j * 10 6 ) 1 2 3 4 5
Fig. 2.Variations in energy consumption of recurring workloads due to decisions made by the management mechanism. The legend from 1 to 5 represents the order of occur-rence of each workload (1 for the 1st occuroccur-rence of the workload, 2 for the 2nd, 3 for the 3rd, 4 and 5 for the 4th and 5th occurrences respectively).
plan on improving the identification process in order to prevent erroneous la-belling of workloads and extending the number of instances of workloads involved in the experiments. We are also planning to investigate more complex scenarios such as those wherein the system may experience idle periods; this implies an effective characterization of idle periods.
Acknowledgments This work is supported by the INRIA large scale initia-tive Hemera focused on “developing large scale parallel and distributed experi-ments”. Some experiments of this article were performed on the Grid5000 plat-form, an initiative from the French Ministry of Research through the ACI GRID incentive action, INRIA, CNRS and RENATER and other contributing partners (http://www.grid5000.fr).
It was also partially supported by the COST (European Cooperation in Sci-ence and Technology) framework, under Action IC0804.
0 50 100 150 200 250 300 350 400 450 1 2 3 4 5 Execution time (s)
Workloads instance (1 for the 1rst instance, 2 for the 2nd and so on) BT CG EP FT MG IS SP
Fig. 3.Execution time of recurring workload with respect to reconfiguration decisions made by the management mechanism. The x-axis represents the order of occurrence of the workloads (1 for the 1st occurrence of the workload, 2 for the 2nd, 3 for the 3rd, 4 and 5 for the 4th and 5th occurrences respectively).
References
1. S. Peng, “Green memory moving into the driver’s seat,” Intel Developer Forum IDF2010.
2. H. Kimura, T. Imada, and M. Sato, “Runtime energy adaptation with low-impact instrumented code in a power-scalable cluster system,” in Proceedings of the 2010
10th IEEE/ACM International Conference on Cluster, Cloud and Grid Computing,
CCGRID ’10, (Washington, DC, USA), pp. 378–387, IEEE Computer Society, 2010.
3. V. W. Freeh, N. Kappiah, D. K. Lowenthal, and T. K. Bletsch, “Just-in-time dy-namic voltage scaling: Exploiting inter-node slack to save energy in mpi programs,”
J. Parallel Distrib. Comput., vol. 68, no. 9, pp. 1175–1185, 2008.
4. B. Rountree, D. K. Lownenthal, B. R. de Supinski, M. Schulz, V. W. Freeh, and T. Bletsch, “Adagio: making dvs practical for complex hpc applications,” in
Pro-ceedings of the 23rd international conference on Supercomputing, ICS ’09, (New
5. M. Y. Lim, V. W. Freeh, and D. K. Lowenthal, “Adaptive, transparent frequency and voltage scaling of communication phases in mpi programs,” in Proceedings
of the 2006 ACM/IEEE conference on Supercomputing, SC ’06, (New York, NY,
USA), ACM, 2006.
6. K. Choi, R. Soma, and M. Pedram, “Fine-grained dynamic voltage and frequency scaling for precise energy and performance tradeoff based on the ratio of off-chip access to on-chip computation times,” Trans. Comp.-Aided Des. Integ. Cir. Sys., vol. 24, pp. 18–28, Nov. 2006.
7. R. Ge, X. Feng, and K. W. Cameron, “Performance-constrained distributed dvs scheduling for scientific applications on power-aware clusters,” in Proceedings of
the 2005 ACM/IEEE conference on Supercomputing, SC ’05, (Washington, DC,
USA), pp. 34–, IEEE Computer Society, 2005.
8. V. W. Freeh and D. K. Lowenthal, “Using multiple energy gears in mpi programs on a power-scalable cluster,” in Proceedings of the tenth ACM SIGPLAN symposium
on Principles and practice of parallel programming, PPoPP ’05, (New York, NY,
USA), pp. 164–173, ACM, 2005.
9. K. W. Cameron, R. Ge, and X. Feng, “High-performance, power-aware distributed computing for scientific applications,” Computer, vol. 38, pp. 40–47, Nov. 2005. 10. C. Isci, G. Contreras, and M. Martonosi, “Live, runtime phase monitoring and
prediction on real systems with application to dynamic power management,” in
Proceedings of the 39th Annual IEEE/ACM International Symposium on Microar-chitecture, MICRO 39, (Washington, DC, USA), pp. 359–370, IEEE Computer
Society, 2006.
11. G. L. Tsafack, L. Lefevre, J.-M. Pierson, P. Stolf, and G. Da Costa, “A runtime framework for energy efficient hpc systems without a priori knowledge of applica-tions,” in ICPAD 2012 : 18th International Conference on Parallel and Distributed
Systems, (Singapore, Singapore), pp. 660–667, IEEE, Dec 2012.
12. G. L. Tsafack, L. Lefevre, J.-M. Pierson, P. Stolf, and G. Da Costa, “Beyond cpu frequency scaling for a fine-grained energy control of hpc systems,” in
SBAC-PAD 2012 : 24th International Symposium on Computer Architecture and High Performance Computing, (New York City, USA), pp. 132–138, IEEE, oct 2012.
13. R. Bolze, F. Cappello, E. Caron, M. Dayd´e, F. Desprez, E. Jeannot, Y. J´egou, S. Lanteri, J. Leduc, N. Melab, G. Mornet, R. Namyst, P. Primet, B. Quetier, O. Richard, E.-G. Talbi, and I. Touche, “Grid’5000: A large scale and highly re-configurable experimental grid testbed,” Int. J. High Perform. Comput. Appl., vol. 20, pp. 481–494, Nov. 2006.
14. D. H. Bailey, E. Barszcz, J. T. Barton, D. S. Browning, R. L. Carter, R. A. Fatoohi, P. O. Frederickson, T. A. Lasinski, H. D. Simon, V. Venkatakrishnan, and S. K. Weeratunga, “The nas parallel benchmarks,” tech. rep., The International Journal of Supercomputer Applications, 1991.