UNCORRECTED
PROOF
Journal of Cleaner Production xxx (2017) xxx-xxx
Contents lists available at ScienceDirect
Journal of Cleaner Production
journal homepage: www.elsevier.com
Valorization of waste concrete through CO
2
mineral carbonation: Optimizing
parameters and improving reactivity using concrete separation
Alia Ben Ghacham, Louis-César Pasquier
∗, Emmanuelle Cecchi, Jean-François Blais, Guy Mercier
INRS-ETE, 490 rue de la Couronne, Québec, QC, G1K 9A9, Canada
A R T I C L E I N F O Article history:
Received 5 January 2017
Received in revised form 1 August 2017 Accepted 2 August 2017
Available online xxx
Keywords:
Waste concrete Flue gas composition Aqueous mineral carbonation Response methodology surface Parameters influence
A B S T R A C T
The use of CO2mineral carbonation represents an attractive approach to recycling waste concrete. In this
study, the effect of gas pressure, Liquid/Solid (L/S) ratio (w/w), Gas/Liquid (G/L) ratio (v/v) and reaction time for CO2sequestration were investigated. While carbonation of such matrix is already described, this study
opens new insights in concrete carbonation. To increase the reactivity potential of concrete, the fine fraction (<500 μm), which contains mostly cement paste, was separated from the inert coarse aggregates. Separation was conducted by crushing and sieving. The ground fine concrete fraction showed enhanced reactivity with 75% of CO2removed (corresponding to 0.057 g CO2removed/sample) compared to that of raw concrete, with
54% of CO2removed (corresponding to 0.034 g CO2removed/sample). Tests were conducted under 144 psi
of gas pressure (9.93 Bars) at ambient temperature for 10 min. On the other hand, the resulting aggregates fraction have an improved potential recycling value. The new proposed approach allows better carbonation efficiency and increases the overall valuation of waste concrete.
© 2017.
Abbreviations
CO2 c CO2converted
CO2 r CO2removed (sum of CO2dissolved and CO2 con-verted)
G/L gas/liquid
L/S liquid/solid
1. Introduction
Carbon dioxide (CO2) sequestration is an important challenge that involves various technologies known as Carbon Capture, Utilization and Storage (CCUS). Among them, mineral carbonation (MC) is an attractive method that allows for safe and permanent CO2storage. The approach mimics the natural silicate weathering process involving the reaction between CO2and divalent cations (Ca2+or Mg2+) to form metal carbonates (Huijgen and Comans, 2003).
An example of carbonation reactions involving CaO and MgO are presented in the following equations (1) and (2):
∗Corresponding author.
Email address: [email protected] (L-C Pasquier)
MC can be performed under dry, wet or aqueous conditions with various type of feedstocks. Among them, several industrial wastes such as; steelmaking slags, cement kiln dust, waste cement, asbestos tailings, nickel tailings, red mud, municipal solid waste incinerator (MSWI) bottom ash, MSWI fly ash/air pollution control (APC) residue, coal fly ash, oil shale ash and alkaline paper mill waste can be used (Bobicki et al., 2012).
Construction and demolition (C&D) wastes are increasingly con-sidered to be a valuable source of building materials for the construc-tion industry (Kuosa, 2012). Of the total C&D waste generated, it is reported that 40% is concrete (De Belie et al., 2007). As a result, the waste concrete obtained after C&D activities is potentially reusable in the production of fresh concrete (Corinaldesi and Moriconi, 2009). In general, only coarse aggregates can be used in producing con-crete because finer particles have a larger absorption capacity, which leads to a higher water demand for the new concrete (Domone and Illston, 2010). Therefore, the fine fraction of concrete could be man-aged rather than continuing the normal practice of disposal (Martins et al., 2013). Instead, MC could be an alternative or complementary so-lution for recycling waste concrete.
https://doi.org/10.1016/j.jclepro.2017.08.015 0959-6526/© 2017.
(1)
UNCORRECTED
PROOF
Cementitious materials are interesting for MC due to the presenceof reactive phases, especially portlandite (Ca(OH)2) and calcium sil-icate hydrate (C-S-H) (Thouvenot et al., 2013). Table 1 summarizes the main carbonation processes and cementitious material uses that have been reviewed, along with the results. In most cases, previous re-search has focused on the curing process of concrete and the use of cement kiln dust (CKD). Otherwise, the use of cement waste in an in
direct MC process with the goal of producing pure calcium carbonate (PCC).
As shown in Table 1, chemical additives, high pressure gas, high temperatures, long reaction durations and concentrated CO2have been employed to achieve reasonable CO2sequestration results within ce-mentitious materials. However, these methods may represent signif-icant energy and economic constraints when applied in practice. In this way, the use of moderate pressure and temperature
Table 1
Summary of mineral carbonation processes using cementitious materials as feedstock (L/S – liquid/solid, amb. – ambient). Author
Type
process Material Duration T (°C) Gas comp.
Pressure
(Bar) Ratio L/S Gas Flow Results Remarks (Shuto et al., 2015) -
Dis- con- tinu-ous -
Indi-rect
Waste cement Calcium Extraction: 40 min
CaCO3Precipitation:
30 min
amb. 100% CO2 – – – Carbonates
purity>94% - Calciumextraction with HNO3
- Carbonates precipita-tion with NaOH (Shao et al., 2014) -
Dis- con- tinu-ous - Indi-rect Cement 2 h amb. 99.50% CO2 1.5 0.36 – CO2absorption: 12%/cement weight Concrete curing process
(Mun and Cho, 2013) - Dis- con- tinu-ous -
Indi-rect
Waste cement Calcium Extraction: 1 h
CaCO3Precipitation:
1 h
amb. 100% CO2 amb. 10 1.5 mL/min 0.06 g CO2/g
cement Calcium extraction with: EDTA and CH3COOH. (Uliasz-Bocheńczyk and Pomykała, 2011) - Dis-
con- tinu-ous -
Indi-rect
Cement 14 days 20–25 100% CO2 9 à 10 – – Absorption: 0.31
gCO2/g cement
Relative Humidity: 40%
(Gunning et al., 2010) - Dis- con- tinu-ous - Di-rect Cement 72 h 25 100% CO2 80 0.26 – CO2absorption: 30%/cement weight Relative Humidity: 75% (Kashef-Haghighi and
Ghoshal, 2009) - Con- tinu-ous - Di-rect
Cement Concrete hydration: 180 min Carbonation.: 16 min 25 20% CO2, 40% N2 0.2 (CO2 Pressure) – 1.17 L/min Carbonation efficiency: 18% Concrete curing process
(Huntzinger et al., 2009) - Dis- con- tinu-ous - Di-rect Cement Kiln Dust (CKD) 8 h amb. 5 à 15% CO2 amb. 0.3 – Carbonation efficiency: 75–80% –
(Shao et al., 2006) - Dis- con- tinu-ous - Di-rect
Cement 2 h amb. 100% CO2 5 0.15 – CO2absorption:
9%–16% per cement weight
Concrete curing process
UNCORRECTED
PROOF
Table 1 (Continued)
Author Typeprocess Material Duration T (°C) Gas comp. Pressure(Bar) Ratio L/S Gas Flow Results Remarks (Katsuyama et al., 2005) -
Dis- con- tinu-ous -
Indi-rect
Waste cement Calcium Extraction: 0–120 min Precipitation:0–30 min 50–30 100% CO2 30–1 Ratio S/ L: 0.29–2.9 Purity CaCO3>98%
(Short et al., 2001) - Dis- con- tinu-ous - Di-rect Cement 24 h 60 100% CO2 93 0.6 – Carbonation efficiency: 16.2% –
(Teramura et al., 2000) - Dis- con- tinu-ous - Di-rect Waste cement 0.8–100 h 20 0.03–100% CO2 1–4 0.25–0.5 – Carbonation efficiency: 1.6–16.5% –
conditions was also studied. Baciocchi et al. (2010) investigated the carbonation of steel slags under less extreme pressure (3 Bar) and tem-perature (50 °C) conditions for a reaction duration of 2 h using 100% CO2. In this process, they demonstrated the possibility of achieving reasonable results (0.13 g CO2/g sample) under moderate conditions. Additionally, Huntzinger et al. (2009) studied the mineral carbonation of CKD under ambient temperature and atmospheric pressure. Never-theless, the best results were obtained with reaction duration of 8 h, which would not be viable when applied in practice. While these re-sults are encouraging with respect to the feasibility of the carbonation process under moderate conditions, the aforementioned studies used pure CO2, which requires an additional step for capturing flue gas. Technical feasibility of MC relies in simplicity and low cost opera-tions. Thus, the use of diluted sources such as industrial flue gases un-der mild conditions is preferable.
Our previous work demonstrated that waste concrete obtained from the C&D activities is quite reactive when used in direct aqueous MC, under moderate temperature and pressure and the use of simulated flue gas (18% CO2) (Ben Ghacham et al., 2015). In continuity with the precedent work, this study investigate the effects of the different fac-tors that influence the reactivity of concrete under the conditions pre-viously tested. We also developed a novel approach that enhance the level of reactivity towards an improved recycling scenario.
2. Materials and methods
2.1. Methodology
Experiments were conducted by the aqueous route using a Mini bench top reactor (model 4560, Parr Instrument Company), as illus-trated in Fig. 1. In this process, the feedstock material was mixed with distilled water to obtain the required Liquid/Solid (L/S) ratio. Next, the gas representing a cement plant flue gas (18.2% vol. CO2 and 4.0% vol. O2), balanced with N2, was introduced in the reactor. At the end of the reaction, the concentration of the exiting gas was determined using an infrared CO2analyzer (Quantek Instruments). Then, the slurry was filtered using 934-AH filters (porosity: 1.5 μm), and the liquid phase was analyzed for the Cinorg concentration (Schi
Fig. 1. Experimental presentation of aqueous mineral carbonation (Pasquier et al.,
2014).
madzu TOC-VCPH, equipped with NDIR detection) and its chemical composition after acidification (at 5% HNO3) with ICP-AES analysis. Afterwards, the solid phase was oven-dried at 60 °C for 24 h, and then, its carbon content was determined by CHNS (Leco).
Thermogravimetry analysis (TGA) was conducted for a few sam-ples of raw concrete and carbonated residue to obtain results. TGA tests were carried out using a Perkin Elmer Diamond instrument. Heat was increased at a rate of 10 °C/min, reaching 1000 °C. The initial weight of the samples was between 30 and 40 mg.
In the first part of the study, an experimental design was used for the Response Surface Methodology (RSM), using the Design Expert 9.0.3 (Stat-ease, Inc. Minneapolis, USA) software. This class of re-sponse surface design offers an advantage in that it requires fewer runs compared to a central composite circumscribed (CCC) design or cen-tral composite inscribed (CCI) design (Yetilmezsoy et al., 2009).
We intended to conduct the experiment under moderate conditions composed of a low gas pressure range, an ambient temperature and a short reaction duration. The factors that were evaluated consisted of the following: gas pressure (120–280 psi/8.25–19.30 Bar), liquid/
UNCORRECTED
PROOF
solid (L/S) ratio (w/w) (2.5:1–10:1), the gas/liquid (G/L) ratio (v/v)(1:1–3:1) and the reaction time (10–30 min). Because the goal of the study was to enhance the CO2removal capacity per sample mass unit, the chosen response was the amount of CO2removed according to the following equation: (converted + dissolved)/sample (w/w).
The aim of the second part of the study was to enhance the reac-tivity of the concrete by recovery, using the hardened cement paste fraction. In general, the fresh concrete formula contains 6–16% by volume of cement, 12–20% of water, 20–30% of fine aggregates and 40–55% of coarse aggregates. During hardening, chemical hydration reactions between cement and water will produce hardened cement that binds the aggregates together. Generally, coarse aggregates are crushed rocks or gravel obtained from local sources (Domone and Illston, 2010). While these components could be inert in mineral car-bonation, there are reports in the literature indicating that during sev-eral mechanical stages in the concrete recycling process, the amount of mortar attached to the coarse aggregates is reduced. In this case, the cement paste would accumulate in the fine fraction of the concrete (De Juan and Gutiérrez, 2009; Gokce et al., 2011; Silva et al., 2014).
Therefore, in this study, the coarse aggregates were separated by crushing and sieving the samples prior to carbonation. The crushing was performed by adjusting the operating distance of the jaw crusher (C-RC-335). Then, separation was conducted using two sieves in suc-cession. The first sieve contained a 2-mm mesh that allowed the sep-aration of the coarse aggregates. The second sieve, composed of a 500-μm mesh, further separated the fine fraction of the concrete. The fine fraction was then tested with and without grinding to compare the level of reactivity. The grinding was conducted using a vibratory disc mill (Retsch RS200).
The third part of the study consisted of conducting tests to estimate the enhancement of the material reactivity. This was accomplished by bringing the same slurry in contact with successive batches of gas (of 10 min). The first method involved applying successive batches of gas without renewing the water. The second method involved re-newing the liquid phase after each batch of gas was applied, while the third method included both water renewal and grinding the material between successive applications of gas.
2.2. Material
The waste concrete samples were recovered from an eco-center located in Québec City. Two batches of concrete were selected and used in the study. The first batch (Concrete 1) was used for the Box-Benkhen runs, and the second batch (Concrete 2) was used for the concrete separation. After the samples were grinded, they were an-alyzed for their chemical composition. In addition, a portion of the samples for analyzed for their mineralogical composition using X-ray powder diffraction (XRD).
Table 2 shows the chemical composition of the different concrete fractions. The results indicate that the samples are rich in CaO. The samples contained in Concrete 1, total Concrete 2 (TC) and the fine concrete fraction (FC) were analyzed for their mineralogical compo-sition using XRD (Siemens D5000 X-Ray Diffractometer with cop-per anode X-ray tube) (2θ between 0 and 65). The results are shown in Fig. 2. For each of the two batches of concrete, the dominant min-eral phases included calcite, quartz and other natural minmin-erals, such as albite and microcline, which were likely derived from the aggre-gates contained in the concrete structure. Unfortunately, the C-S-H phases generally present in the composition of the concrete were not observed; this is probably due to their amorphous nature.
Table 2
Chemical composition of the samples. CaO (%) FeO (%) MgO (%) SiO2 (%) Al2O3 (%) LOI (%) Ct (%) Weight (%) Concrete 1 26.77 2.1 0.63 45.2 8.1 17.2 4.00 Total concrete 2 (TC) 29.22 1.69 2.11 37.95 6.35 27.62 4.75 100 Coarse aggregates (CA) (>2 mm) 38.42 1.17 1.29 20.66 2.65 35.63 7.8 62.63 Fine aggregates (FA) (2 mm > FA> 500 μm) 29.33 1.41 1.55 38.43 6.52 25.4 5.57 30.01 Fine concrete fraction (FC) (<500 μm) 30.84 2.08 2.02 40.54 8.29 17.29 3.04 6.14
Fig. 2. XRD pattern of (a) concrete (Batch 1), (b) concrete powder and (c) total
con-crete (Batch 2) consisting of Bi (Biotite), Gy (Gypsum), Po (Portlandite), Qu (Quartz), Al (Albite), Mi (Microcline), Ca (Calcite) and Ho (Hornblende).
2.3. Calculations
The formula used in this study is the same as that used in our pre-vious work (Ben Ghacham et al., 2015):
- CO2removal (%)
As the composition of CO2in the gas before and after the reaction is known, the percentage of CO2removed is calculated as follows:
UNCORRECTED
PROOF
The mass of CO2in the gas is calculated using the ideal gas law.- Calcium initially present as calcium carbonate in raw samples (g)
% C inorg (i): percentage of initial inorganic carbon present in the raw sample that was analyzed with CHNS
M: molar mass (g/mol)
- Mass of CO2converted into carbonate (g)
- Theoretical carbonation capacity (g CO2/g sample)
This calculation excluded calcium that was initially carbonated for concrete samples.
- Carbonation efficiency:
- Mass calcium converted into carbonate (g)
3. Results and discussion
3.1. Box-Benkhen statistical analysis
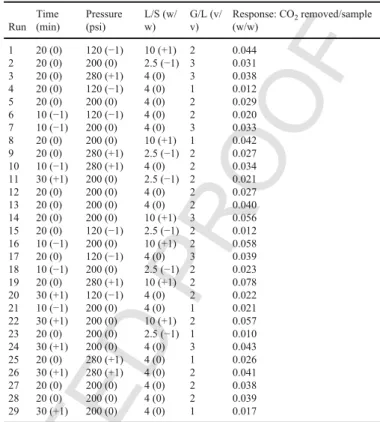
Table 3 shows the experiment matrix and response in terms of the amount CO2removed/sample obtained. The best response (0.078 g CO2removed/g sample) was obtained using the following parame-ters: 20 min of reaction time, 280 psi (19.30 Bar) of total gas pres-sure, a L/S ratio of 10:1 and a G/L ratio of 2:1. Conversely, the low-est response (0.010 g of CO2removed/g of sample) was obtained us-ing the followus-ing parameters: 20 min of reaction time, 100 psi (6.89 Bar) of total gas pressure, a L/S ratio of 2.5:1 and a G/L ratio of 1:1. The differences between these results show that increasing the gas
Table 3
Design matrix for the experimental factors. Run Time (min) Pressure (psi) L/S (w/ w) G/L (v/ v) Response: CO2removed/sample (w/w) 1 20 (0) 120 (−1) 10 (+1) 2 0.044 2 20 (0) 200 (0) 2.5 (−1) 3 0.031 3 20 (0) 280 (+1) 4 (0) 3 0.038 4 20 (0) 120 (−1) 4 (0) 1 0.012 5 20 (0) 200 (0) 4 (0) 2 0.029 6 10 (−1) 120 (−1) 4 (0) 2 0.020 7 10 (−1) 200 (0) 4 (0) 3 0.033 8 20 (0) 200 (0) 10 (+1) 1 0.042 9 20 (0) 280 (+1) 2.5 (−1) 2 0.027 10 10 (−1) 280 (+1) 4 (0) 2 0.034 11 30 (+1) 200 (0) 2.5 (−1) 2 0.021 12 20 (0) 200 (0) 4 (0) 2 0.027 13 20 (0) 200 (0) 4 (0) 2 0.040 14 20 (0) 200 (0) 10 (+1) 3 0.056 15 20 (0) 120 (−1) 2.5 (−1) 2 0.012 16 10 (−1) 200 (0) 10 (+1) 2 0.058 17 20 (0) 120 (−1) 4 (0) 3 0.039 18 10 (−1) 200 (0) 2.5 (−1) 2 0.023 19 20 (0) 280 (+1) 10 (+1) 2 0.078 20 30 (+1) 120 (−1) 4 (0) 2 0.022 21 10 (−1) 200 (0) 4 (0) 1 0.021 22 30 (+1) 200 (0) 10 (+1) 2 0.057 23 20 (0) 200 (0) 2.5 (−1) 1 0.010 24 30 (+1) 200 (0) 4 (0) 3 0.043 25 20 (0) 280 (+1) 4 (0) 1 0.026 26 30 (+1) 280 (+1) 4 (0) 2 0.041 27 20 (0) 200 (0) 4 (0) 2 0.038 28 20 (0) 200 (0) 4 (0) 2 0.039 29 30 (+1) 200 (0) 4 (0) 1 0.017
pressure, L/S and G/L ratios had a positive effect on the amount of CO2removed/sample (g/g).
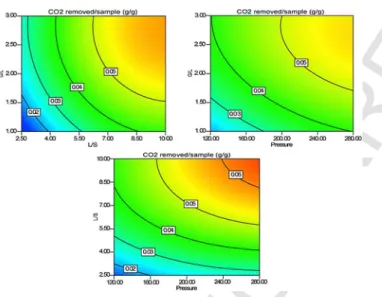
The statistical analysis obtained using ANOVA (Table 4) indicated that gas pressure and the L/S and G/L ratios were significant factors. Fig. 3 illustrates the positive effect of gas pressure and the L/S and G/ L ratios on the amount of CO2removed/sample. According to Henry's law, the partial pressure of CO2would increase the dissolution of CO2 in the aqueous phase, thereby increasing the reaction efficiency. In ad-dition, the response improved with an increase in the L/S ratio within the range tested, while an increase in the slurry dilution increased the dissolution and precipitation of the CO2per unit of mass of the initial material within the range tested. Indeed, the ratio of 10:1 appears to be the better value, and the enhancement of the G/L ratio increased the reaction efficiency. This observation might be explained by the greater quantity of gas introduced in the reactor. In fact, under the same condi-tions, in terms of gas pressure and temperature, an increase in the vol-ume of gas would likely improve the dissolution of the gas and there-fore the reaction efficiency.
To yield the maximum amount of CO2removed/sample, the para-meters were optimized by increasing the response and decreasing the gas pressure. As such, the optimized reaction conditions proposed by the software were: reaction duration of 10 min, total gas pressure of 144 psi (10.68 Bar), L/S ratio of 10:1 and G/L ratio of 2.43:1. The pre-dicted response was: 0.042 CO2removed/sample (w/w). The result of the experiment was 0.037 CO2removed/sample (w/w) (corresponding to 0.031 g CO2converted/sample).
Geochemical simulations were conducted using the PHREEQC software to predict the potentially precipitated phases under these conditions. Due to the lack of data concerning the molar ratio of the mineral phases present in the concrete, a molar ratio range of 0.002–0.007 was selected for both C-S-H 1.6 (Ca1.6SiO3.6: 2.58H2O) and (Ca(OH)2), representing the cementitious reactive phases. Simu-lation results using portlandite (Ca(OH)2) as the main mineral phase indicated that the potentially precipitated phases are mainly calcite (4)
(5)
(6)
(7)
UNCORRECTED
PROOF
Table 4
ANOVA results for Response Surface Quadratic model. Source Degree of freedom Sum of square F value p-value Pr > F Conclusion Model 14 0.005 20.85 5.64 E−07 significant A- Time 1 5.22E-05 2.89 0.11 not
significant B-Pressure 1 0.0007 40.03 1.97E-5 significant C- L/S 1 0.0029 163.92 4.05E-09 significant D- G/L 1 0.00091 50.46 5.31E-06 significant AB 1 1.03E-05 0.57 0.46 not significant AC 1 3.23E-05 1.79 0.20 not significant AD 1 7.08E-05 3.03 0.067 not significant BC 1 1.64E-05 0.91 0.35 not significant BD 1 7.63E-06 0.42 0.52 not significant DC 1 3.84E-06 0.21 0.65 not significant
Aˆ2 1 3.06E-05 1.69 0.21 not
significant Bˆ2 1 5.08E-05 2.81 0.11 not significant Cˆ2 1 0.00015 8.53 0.001 significant Dˆ2 1 0.00018 9.96 0.007 not significant Residual 14 0.000252 Lack of Fit 10 0.0001 0.28 0.95 not significant Pure Error 4 0.000148 Cor Total 28 0.0055
R2= 0.95; predicted R2= 0.85; adjusted R2= 0.91; adequation precision = 17.50.
Fig. 3. Effects of different factors on the response CO2removed/sample using a
re-sponse surface contour plot.
and aragonite with saturation indices (SIs) of between 0.94-3.21 and 0.77–3.07, respectively. For simulations conducted with C-S-H, cal-cite, aragonite and CaCO3.H2O (s) were the favored forms to precip-itate thermodynamically (with SIs between 1.64 and 3.99 for calcite and 1.47–3.8 for aragonite).
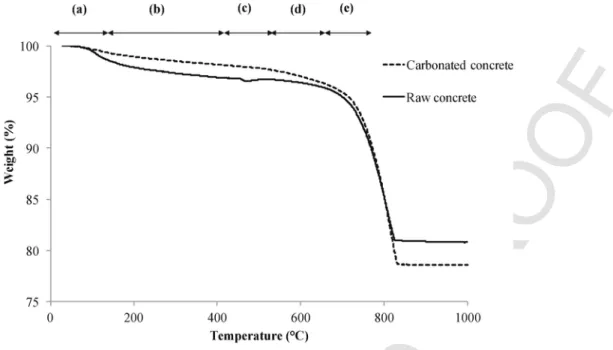
XRD analysis of the reaction residue was completed. However, because the calcite signature was initially high in the raw material, the enhancement of the peak intensity was not clearly observed from
the reacted residue. To obtain more relevant data, a thermal analysis (TGA) of the solid material was completed before and after the re-action, the results of which are presented in the Fig. 4. The results showed a different trend for the samples in terms of weight loss (%). The data interpretation, based on Lee et al. (2009), summarizes the temperature ranges that correspond to the amount thermal decomposi-tion from the different mineral phases present in the hydrated cement paste. Fig. 4 highlights the differences between the reacted and unre-acted samples. The level of dehydration in phases of C-S-H and cal-cium hydroxide is higher in raw concrete. However, it may be that the decomposition curve between 640 and 830 °C is greater for the car-bonated sample. Indeed, Lee et al. (2009) found that the peak tem-perature for CaCO3decomposition is in the range of 640–800 °C, while Bye (1999) noted that the peak temperature for calcite decom-position is between 802 and 882.85 °C. In light of these observa-tions, the weight loss (%) between 640 °C and 830 °C for the reacted sample could be related to the CaCO3decomposition, which corre-sponds to both the CaCO3initially present in the raw concrete and that was formed during the mineral carbonation reaction of the concrete. The resulting mass loss from the carbonated residue (corresponding to the calcium carbonate decomposition) is 2.64%, which represents 0.0264 g of CO2when converted into carbonates/g sample. The differ-ence compared the carbon analysis using CHNS could be attributed to the sum of experimental errors and analysis sensitivity.
These results suggest that the C-S-H and portlandite (Ca(OH)2) phases present in the initial material reacted during the MC and were thus transformed into calcium carbonate.
3.2. Concrete separation and reactivity of the fine fraction of concrete in mineral carbonation
In this section, the fine concrete powder (<500 μm) contained in the concrete matrix was separated according to the steps illustrated in Fig. 5.
Tests were conducted using the following: grinded total concrete (TC), grinded fine concrete fraction (GFC) and non-grinded fine con-crete fraction (NGFC). The mean size of TC, NGFC and GFC are 33.31 μm 253.25 μm and 32.60 μm, respectively.
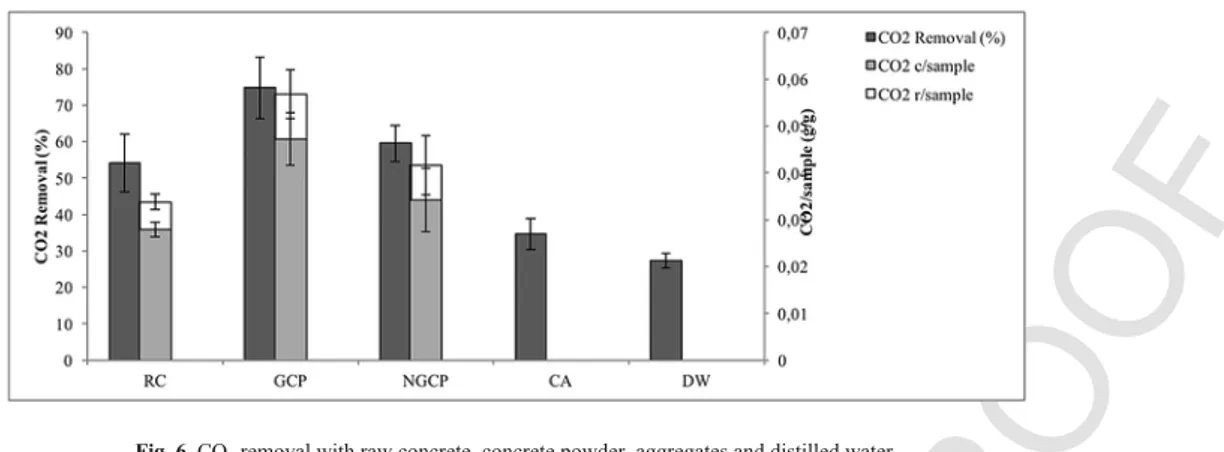
To evaluate the reactivity of the coarse aggregates (CA) in the same experimental conditions, samples of pure CA were selected, crushed and grinded as previously discussed. Tests with only water (DW) were also conducted to represent a blank reaction. Tests were performed under optimal conditions consisting of the following: L/ S ratio of 10:1, total gas pressure of 144 psi and a reaction time of 10 min. The results are shown in the Fig. 6.
The GFC material demonstrated the highest amount of CO2 re-moved of 74.79% and a CO2removed/sample ratio of 0.057. In con-trast, the amount of CO2removed from the TC and NGFC samples was 54.16% and 59.55%, corresponding to 0.034 and 0.043 g CO2 re-moved/g sample, respectively. Finally, CO2removed from the CA and DW samples were similar at 34.6% and 27.25%, respectively.
To compare these results, a bivarious analysis coupled with a sim-ple regression was performed following a Tukey-Kramer honest sig-nificant difference (HSD) analysis (average-to-average method) us-ing JMP software. This method allows one to compare differences in terms of CO2removal and CO2converted/sample between all the sam-ples. The results are presented in Tables 5 and 6.
The results from the GFC sample are significantly higher than from the TC samples. The presence of a higher quantity of coarse aggre-gates per unit mass for the TC has an influence on the material reac-tivity compared to the fine concrete fraction.
UNCORRECTED
PROOF
Fig. 4. TGA decomposition data for raw and carbonated concrete. ((a) 20–120 °C: evaporation of free water and dehydration of C-S-H and ettringite, (b) 230–400 °C: dehydration of
C-S-H and dehydration of Calcium Hydroxide, (c) 400–530 °C: dehydration of C-S-H and dehydration of Calcium Hydroxide, (d) 530–640 °C: dehydration of C-S-H and decompo-sition of poorly crystallized CaCO3, (e) 640–800 °C: dehydration of C-S-H and decomposition of CaCO3).
Fig. 5. Concrete separation and carbonation process.
According to the chemical composition, coarse aggregates >2 mm represent 7.8% of the total carbon. On the other hand, in Fig. 2 (b), the peak of calcite present in the TC is higher than in the fine con-crete fraction. The difference in the calcite intensity peak (between the total concrete and the finer concrete fraction) and the higher ini-tial carbon content in the coarse aggregates suggests that the coarse aggregates present in the concrete composition have a mostly calcare-ous nature. Further, the calcium content in the CA is high, but is not reactive for MC, as it is already in a carbonated form. Additionally, the amount of reactive calcium content would be greater in the FC
compared to the TC. Therefore, as initially expected, the cement paste is mainly present in the fine concrete fraction. In comparing the NGFC and TC samples, both the amount of CO2 removed and CO2 con-verted/sample are not significantly different. In comparing the GFC and NGFC in terms of CO2removed (%), the following p-value was obtained: 0.07 (not significantly different). For the CO2converted/ sample, a small difference was identified in which a p-value of 0.05 was obtained. From these data, it is possible to determine the rela-tive differences in their reactivity. This observation may be due to the higher specific area (due to the differences in term of granulome
UNCORRECTED
PROOF
Fig. 6. CO2removal with raw concrete, concrete powder, aggregates and distilled water. Table 5
Statistical comparison based on results of % CO2removed.
Material 1 Material 2 P-Value
GFC DW <0.001 GFC CA <0.001 NGFC DW 0.0005 TC DW 0.0020 NGFC CA 0.0035 GFC TC 0.0126 TC CA 0.0176 GFC NGFC 0.0680 CA DW 0.5874 NGFC TC 0.8064 Table 6
Statistical Comparison based on CO2c/sample.
Material 1 Material 2 P-Value
GFC TC 0.0089
GFC NGFC 0.0495
NGFC TC 0.3505
try) present in the GFC compared to NGFC, which influences the dis-solution of the reactive elements (calcium essentially). In summary, the GFC presented a higher level of reactivity compared to other samples, except compared to the NGFC. In addition, a conversion ratio of 0.047 CO2converted/sample obtained with the GFC corre-sponds to a 36.15% efficiency rate (based on a theoretical carbona
tion capacity of 0.13). However, even if the level of reactivity is lower for the NGFC, its use could avoid the grinding process, an energy-in-tensive step as reported by Huijgen et al. (2006).
3.3. Experiments with successive batches of gas
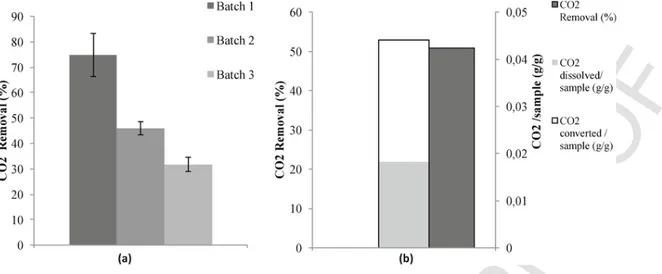
The results from the application of successive batches of gas to the same slurry are shown in Figs. 7–9. Fig. 7 (a) shows a decrease in CO2removed (%) between batch 1 and batch 3, from 71.17% to 14.62%, respectively. The total amount of CO2removed from the in-troduced CO2 mass (with 3 batches of gas) is 41.5% which corre-sponds to 0.051 g CO2converted/sample (Fig. 7 (b)).
However, for the second and third methods, an increase in CO2 re-moval was observed, especially for the third batch (Figs. 8 and 9), in-cluding batches in which water was renewed between batches. This outcome is due to further dissolution of the gas in the fresh water. This stands in contrast to the saturation state in the first methodology in which increased dissolution was not possible. In fact, for the amount of CO2dissolved/sample, an increase was observed from 0.009 for a simple batch to 0.013 when successive batches of gas were ap-plied without water renewal, to 0.018 when water was renewed, and to 0.027 for the process that involved water renewal and grinding residue.
Globally, the maximum amount of CO2removal (%) of 55.57% is obtained using the method of water renewal and residue grinding be-tween successive applications of batches of gas (Fig. 9). This corre-sponds to 0.054 g CO2converted/sample. In these methods, there is a
UNCORRECTED
PROOF
Fig. 8. Experiment results for successive batches with water renewal. (a) CO2Removal (%); (b) Total CO2Removal (%), CO2converted/sample and CO2dissolved/sample.
Fig. 9. Experiment results for successive batches of gas with water renewal and material grinding between batches. (a) CO2Removal (%); (b) Total CO2Removal (%), CO2
con-verted/sample and CO2dissolved/sample.
slight overall increase in the amount of CO2converted/sample com-pared to a simple batch.
As considered previously (Table 1), few studies have examined the possibility of using waste concrete as a feedstock material in MC. While Shuto et al. (2015) and Katsuyama et al. (2005) focused on car-bonate purity as a result of indirect processes, the sequestration capac-ity of waste concrete was not discussed. Indeed, the amount of energy required by indirect processes would be more significant compared to a simple and direct process.
However, Mun and Cho (2013) were able to obtain 0.06 g CO2/g waste cement from an indirect process that included the use of chem-ical additives (EDTA and acetic acid) as well as pure CO2over the course of 2 h. Therefore, the present result shows a comparable se-questration rate of 0.047 g CO2converted/g sample achieved using the grinded fine fraction of concrete after a reaction time of 10 min using a simple batch. Additionally, a rate of 0.051 g CO2converted/g sam-ple resulted when applying three successive batches of gas. Therefore, this study demonstrates that it is possible to obtain a relatively signif-icant sequestration rate by using a direct process and flue gas compo-sition.
Moreover, the process involving the separation of coarse aggre-gates from the fine fraction of concrete represents two advantages. First, the fine fraction contains more cement paste in its composi-tion, which would cause increased reactivity during MC. Second, the process allows for the recovery of coarse aggregates, which helps limit the amount of natural aggregate that must be extracted for new con-crete. According to previous research, this has significant benefits be-cause the process of extracting and crushing natural aggregates re-quires a large amount of energy and is responsible of increased CO2 emissions (Gokce et al., 2011).
4. Conclusion
In the first section of this study, an experimental design using the Box-Benkhen methodology demonstrated that increasing the total gas pressure, the G/L and the L/S ratios improved the efficiency of MC. In the second section, the separation of the larger-sized aggregates pre-sent in the concrete matrix enhanced the reactivity of the material, in particular with the smaller particles obtained after grinding. More-over, the NGFC showed good results and could also be used as feed-stock material in MC, eliminating the grinding step. In overall, 75%
UNCORRECTED
PROOF
of the CO2 contacted with the fine concrete fraction is removed fromthe gas phase within 10 min at ambient temperature and 144 PSI (9.93 Bars). It corresponds to a conversion of 0.057gCO2 per g of concrete. Besides increasing the carbonation efficiency, the proposed methodology is integrated into the actual practice regarding concrete recycling. Thus, the process allows removing the coarse aggregates present in the concrete. This material could be easily reused in con-struction. While the environmental benefit is increased, only the re-active fraction is used in MC, decreasing the mass of solid mater-ial transported. Nevertheless, the low sequestration potentmater-ial of waste concrete remains a potential major barrier for an application, and a more detailed technical and economic study should be performed. References
Baciocchi, R., Costa, G., Di Bartolomeo, E., Polettini, A., Pomi, R., 2010. Carbonation of stainless steel slag as a process for CO2 storage and slag valorization. Waste Biomass Valorization 1, 467–477.
Ben Ghacham, A., Cecchi, E., Pasquier, L.C., Blais, J.F., Mercier, G., 2015. CO2 se-questration using waste concrete and anorthosite tailings by direct mineral carbon-ation in gas–solid–liquid and gas–solid routes. J. Environ. Manage 163, 70–77. Bobicki, E.R., Liu, Q., Xu, Z., Zeng, H., 2012. Carbon capture and storage using
alka-line industrial wastes. Prog. Energy Combust. Sci. 38, 302–320.
Bye, G.C., 1999. Portland cement: Composition, Production and Properties. Thomas Telford.
Corinaldesi, V., Moriconi, G., 2009. Influence of mineral additions on the performance of 100% recycled aggregate concrete. Constr. Build. Mater. 23, 2869–2876. De Belie, N., Robeyst, N., Van Gemert, D., Imamoto, K., 2007. 2.2 Recycling of
con-struction materials. Environment 11–23.
De Juan, M.S., Gutiérrez, P.A., 2009. Study on the influence of attached mortar con-tent on the properties of recycled concrete aggregate. Constr. Build. Mater. 23, 872–877.
Domone, P., Illston, J., 2010. Construction Materials: Their Nature and Behaviour. CRC Press.
Gokce, A., Nagataki, S., Saeki, T., Hisada, M., 2011. Identification of frost-susceptible recycled concrete aggregates for durability of concrete. Constr. Build. Mater. 25, 2426–2431.
Gunning, P.J., Hills, C.D., Carey, P.J., 2010. Accelerated carbonation treatment of in-dustrial wastes. Waste Manag. 30, 1081–1090.
Huijgen, W., Ruijg, G., Comans, R., Witkamp, G., 2006. Energy consumption and net CO2 sequestration of aqueous mineral carbonation. Ind. Eng. Chem. Res. 45, 9184–9194.
Huijgen, W.J.J., Comans, R.N.J., 2003. Carbon Dioxide Sequestration by Mineral Car-bonation. Literature Review. Energy research Centre of the Netherlands ECN. Huntzinger, D.N., Gierke, J.S., Kawatra, S.K., Eisele, T.C., Sutter, L.L., 2009. Carbon
dioxide sequestration in cement kiln dust through mineral carbonation. Environ. Sci. Technol. 43, 1986–1992.
Kashef-Haghighi, S., Ghoshal, S., 2009. CO2 sequestration in concrete through accel-erated carbonation curing in a flow-through reactor. Ind. Eng. Chem. Res. 49, 1143–1149.
Katsuyama, Y., Yamasaki, A., Iizuka, A., Fujii, M., Kumagai, K., Yanagisawa, Y., 2005. Development of a process for producing high purity calcium carbonate (Ca-CO3) from waste cement using pressurized CO2. Environ. Prog. Sustain. Energy
24, 162–170.
Kuosa, H., 2012. Reuse of Recycled Aggregates and Other C&D Wastes. Research Re-port, Project-advanced Solutions for Recycling Complex and New Materials. VTT, 2010–2012.
Lee, J., Xi, Y., Willam, K., Jung, Y., 2009. A multiscale model for modulus of elastic-ity of concrete at high temperatures. Cem. Concr. Res. 39, 754–762.
Martins, I., Müller, A., di Maio, A., Forth, J., Kropp, J., Angulo, S., John, V., 2013. Use of Fine Fraction, Progress of Recycling in the Built Environment. Springer, 195–227.
Mun, M., Cho, H., 2013. Mineral carbonation for carbon sequestration with industrial waste. Energy Procedia 37, 6999–7005.
Pasquier, L.C., Mercier, G., Blais, J.F., Cecchi, E., Kentish, S., 2014. Parameters opti-mization for direct flue gas CO2 capture and sequestration by aqueous mineral car-bonation using activated serpentinite based mining residue. Appl. Geochem. 50, 66–73.
Shao, Y., Mirza, M.S., Wu, X., 2006. CO2 sequestration using calcium-silicate con-crete. Can. J. Civ. Eng. 33, 776–784.
Shao, Y., Rostami, V., Jia, Y., Hu, L., 2014. Feasibility study on replacing steam by carbon dioxide for concrete masonry units curing, masonry 2014. ASTM Int. Short, N., Purnell, P., Page, C., 2001. Preliminary investigations into the supercritical
carbonation of cement pastes. J. Mater. Sci. 36, 35–41.
Shuto, D., Igarashi, K., Nagasawa, H., Iizuka, A., Inoue, M., Noguchi, M., Yamasaki, A., 2015. CO2 fixation process with waste cement powder via regeneration of al-kali and acid by electrodialysis: effect of operation conditions. Ind. Eng. Chem. Res. 54, 6569–6577.
Silva, R., De Brito, J., Dhir, R., 2014. Properties and composition of recycled aggre-gates from construction and demolition waste suitable for concrete production. Constr. Build. Mater. 65, 201–217.
Teramura, S., Isu, N., Inagaki, K., 2000. New building material from waste concrete by carbonation. J. Mater. Civ. Eng. 12, 288–293.
Thouvenot, P., Bildstein, O., Munier, I., Cochepin, B., Poyet, S., Bourbon, X., Treille, E., 2013. Modeling of concrete carbonation in deep geological disposal of interme-diate level waste. EPJ Web Conf. 56.
Uliasz-Bocheńczyk, A., Pomykała, R., 2011. Mineral sequestration of CO2 with the use of cement waste. Energy Procedia 4, 2855–2860.
Yetilmezsoy, K., Demirel, S., Vanderbei, R.J., 2009. Response surface modeling of Pb (II) removal from aqueous solution by Pistacia vera L.: Box–Behnken experimen-tal design. J. Hazard Mater 171, 551–562.